Article Text

Abstract
Objective To quantify rheumatoid arthritis (RA) cases attributable to selected non-genetic risk factors.
Design National Health and Nutrition Examination Survey (NHANES) and meta-analysis.
Participants US adults.
Data sources The prevalence of exposure was obtained from NHANES. Weighted analysis was performed to account for the complex sampling design in NHANES. PubMed and Web of Science up to 31 March 2019 were searched to identify epidemiological studies reported the association between non-genetic risk factors and RA in US adults. Relative risk (RR) value and the corresponding CI were pooled by meta-analysis to evaluate the associations between modifiable risk factors and RA. Population attributable fraction (PAF) was calculated based on the prevalence and RR data.
Results The weighted percentages of former smokers, current smokers and overweight or obese people were 24.84%, 23.93% and 63.97%, and the average alcohol consumption was 51.34 g/week. In the meta-analysis, we found that former smokers (RR 1.22, 95% CI 1.10 to 1.36) and current smokers (RR 1.47, 95% CI 1.29 to 1.68) had higher risks of RA. Overweight and obese individuals had 1.27-fold (95% CI 1.09 to 1.48) increased risk of RA. Each per 50 g/week increment of alcohol consumption was associated with 8% (95% CI 0% to 16%) reduction in the risk of RA. Therefore, PAF value of smoking was 14.00% (95% CI 8.13% to 23.33%). Excess body mass index (BMI) was found to account for 14.73% (95% CI 5.45% to 23.50%) of RA incidence. The fraction of RA risk attributed by low alcohol intake was 8.21% (95% CI 0.31% to 16.39%). Collectively, we found that 32.69% (95% CI 13.41% to 50.96%) of RA cases were attributable to smoking, overweight or obesity and low alcohol drinking.
Conclusion Nearly 33% of RA incidence was attributed to smoking, excess BMI and low alcohol drinking in USA. Our findings could provide a basis for developing guidelines of RA prevention and control in USA.
- epidemiology
- rheumatology
- public health
This is an open access article distributed in accordance with the Creative Commons Attribution Non Commercial (CC BY-NC 4.0) license, which permits others to distribute, remix, adapt, build upon this work non-commercially, and license their derivative works on different terms, provided the original work is properly cited, appropriate credit is given, any changes made indicated, and the use is non-commercial. See: http://creativecommons.org/licenses/by-nc/4.0/.
Statistics from Altmetric.com
Strengths and limitations of this study
This study is the first to comprehensively evaluate the burden of rheumatoid arthritis (RA) incidence attributable to well-known risk factors among US adults.
Population attributable fraction estimation was based on the prevalence from National Health and Nutrition Examination Survey database and relative risk value by meta-analysis, which ensures data quality and scale.
Limitations of this study included that several other known risk factors of RA exist but have not been included in our study.
Background
Rheumatoid arthritis (RA) is a systemic disease that causes progressive articular destruction and associated comorbidities in vascular, metabolic, bone and psychological domains.1 RA affects at least twice as many women as men, and although it can occur at any age, the peak incidence is at the age of 50 years.2 Incidence varies considerably in different regions and published work suggests that North American and North European countries have higher median incidence rates than South European countries.3
RA is considered to be a multifactorial disease, resulting from the interaction of both genetic and environmental factors.4 Multiple lifestyle and dietary risks factors have been found to be associated with RA.5–8 One of the ways in which individuals may respond to an environmental exposure is through changes in their epigenome to have a profound effect on gene expression, such as post-translational histone modifications and DNA methylation, to influence the risk of RA.9 The weight of risk factors to the burden of RA in a given population is critical for better understanding of the relative importance of risk factors and for prioritisation of public health efforts.
The population attributable fraction (PAF) is an epidemiological measure widely used to assess the public health impact of certain risk factors in populations.10 Several studies illustrate preventive measures will have distinct effects on the societal and on the individual level. For example, evidence in Sweden showed that smoking seems to be responsible for 20% of all RA, 35% of all antibodies to citrullinated protein antigen-positive RA and for 55% of all cases of RA in individuals carrying double HLA-DRB1 SE alleles.11 The PAF calculation could also be generalised to the joint effects of two or more exposures, which is expected to be less than the sum of the PAF for each exposure, because individuals exposed to all of the exposures should not be counted multiple times.12 However, most of these studies were limited because they included only a single risk factor. Comprehensive evaluation of the burden of RA attributable to potentially modifiable risk factors is essential in prioritising resources and planning preventive measures against RA.
It should be noted that there may be ethnic and geographical variations in the association of each risk factor with RA. However, no systematic assessment of the preventable risk factors on RA is available for USA so far. Therefore, this study aimed to estimate the numbers and proportions of RA incidence among US adults that could be attributable to the documented risk factors. It also provides the opportunity to evaluate the potential to draw together preventative health messages for RA.
Methods
RA incidence data
Estimated deaths and mortality by RA in USA in 2016 was obtained from WHO Global Health Estimates (GHE) project.13 GHE 2016 presents results for 183 WHO Member States, encompassing all those with a population of 90 000 or greater in 2016, which confirms and expands previous WHO analyses of global health trends and improvements for years 2000–2016. The specific data sources and methods are described in the website.14 Overall, 2.3 thousand people aged more than 15 years died with RA, and the total death rate of RA was 0.88 per 100 000.
RA incidence data were estimated by applying incidence mortality rates (IMR) to the data on RA deaths. We obtained IMR from a meta-analysis involving a total of 11 longitudinal studies, which used Poisson regression to model IMR.15 The IMR value was calculated as follows: number of deaths at the end of the study divided by the product of the mean number of RA patients during the study multiplied by the mean patient follow-up. The pooled IMR was 2.0/100 after the year of 1983. Thus, the total number of RA cases was 114.8 thousand at an estimated incidence of 0.44 per 1000 among US adults.
Selection of risk factors
We included the convincing and probable risk factors in our study to estimate the joint effect on RA risk. The risk factors which met the following explicit criteria were included: (1) it was one of the 84 behavioural, environmental and occupational, and metabolic risks defined by Global Burden of Disease Study 201616; (2) there was sufficient evidence on the presence and magnitude of likely causal associations with RA risk from systematic reviews and meta-analysis, or high-quality epidemiological studies and (3) data on risk factor exposure were available from representative surveys in USA.
Two independent investigators (Mao Y and Ye D) performed the literature search, and the risk factors included in our study were listed in table 1.
Exposure rate of risk factors among US adults
Prevalence of risk factors
Prevalence of exposure data was extracted from nationally representative studies in USA. As the current health effects of risk factors are a result of the accumulative patterns of past exposure to the risk factors, we assumed an average latency time of 10 years for risk factors and RA. Thus, priority was given to prevalence data of exposure referring to around 2006. In addition, we also conducted a sensitivity analysis with respect to different lag-time.
Prevalence data analysed in this study were extracted from the National Health and Nutrition Examination Survey (NHANES), which used a complex, multistage, probability sampling design to collect nationally representative sample of civilian, non-institutionalised US population and had become a continuous programme since 1999. A stratified, multistage probability cluster process was employed as the sampling strategy.17 NHANES 2005–2006 was used to estimate the prevalence of risk factors. For sensitivity analysis, we also calculated the exposure rate in other 2-year survey cycle.
Smoking status was defined as never, former and current smoker.18 Individuals who reported that they had never smoked or smoked less than 100 cigarettes during their lifetimes were classified as never smokers. Former smokers were defined as participants who smoked at least 100 cigarettes during their lifetimes and were not currently smoking at the time of the survey. Participants who reported smoking at least 100 cigarettes in their lifetimes and smoked either every day or some days at the time of the survey were classified as current smokers.19 Body mass index (BMI) was calculated as weight in kilograms divided by height in metres squared. Alcohol consumption was classified as never for those who reported <12 drinks ever.20
Relative risk data
To evaluate the relative risk (RR) of risk factors and RA in the US population, we conducted a systematic search through databases of PubMed and Web of Science up to 31 March 2019, and the search strategy was presented in online supplemental table 1. We conducted a meta-analysis to pool the RRs of epidemiological studies which reported the association between the risk factors and risk of RA in US population. The studies that fulfilled the following criteria were included for meta-analysis: (1) the study design was cohort, case–control or nested case–control study conducted in US population; (2) RR, and the corresponding 95% CIs should be provided or sufficient data to calculate them were reported; (3) if several reports were from the same study, only the one with largest sample size was included. Two authors (Xu Y and Xu X) extracted detailed information including first author, year of publication, study design, sample size, gender, age, category of each risk factor, RR and 95% CI. We extracted RR estimates from the maximally adjusted model to reduce the risk of possible unmeasured confounding. In addition, estimates for an alternative comparison of the categories was calculated by the method of Hamling et al.21 Two researchers (Xu Y and Xu X) independently rated the quality of the included studies using the Newcastle-Ottawa Scale with scores ranging from 0 to 9 points.22 Studies with a quality score more than seven points were considered as high quality.
Supplemental material
We calculated study specific slopes (linear trends) and 95% CIs from the natural logs of the reported RRs and CIs across categories of BMI.23 We also pooled the categories with BMI more than 25 to evaluate the association between excess BMI and risk of RA for PAF estimation.
As different studies used different units to express alcohol intake, the conversion was performed using the method developed by Fedirko et al24 (one drink=12.5 g; one ounce=28.35 g and 1 mL=0.8 g). A dose–response analysis on the association between alcohol drinking and risk of RA was carried out using both linear and nonlinear models on the natural logarithm of the RR using the method by Orsini N.25 The midpoint of the categories was used in the dose–response analysis. When the highest category was open ended, the midpoint was calculated as 1.2 times its lower bound.26 Data fitting was based on restricted cubic spline models using the fixed percentiles 5%, 35%, 65% and 95% as knot locations.
Population attributable fraction
PAF is the proportion of RA in the total population that can be avoided by modifying or removing the exposure of certain risk factors. For protective factors, the PAF was calculated for the group without the exposure.
PAF can be calculated by the formula proposed by Levin,27 among which P is the prevalence of exposure in a population, such as overweight and obesity.

For multicategorical variable in risk factors such as smoking, PAF was estimated by the following formula.28

RRi was the RR at group i, and Pi was the prevalence of group.
For continuous variables in risk factors such as alcohol consumption (started at zero), PAF was obtained by multiplying the RR for unit exposure and the average exposure level (d), shown in the following formula, assuming a log-linear relationship between exposure and RA risk.29

We calculated the fraction of new cases of individual RA attributable to selected risk factors by applying the combined PAF. It can be estimated by the following formula,12 where r=individual risk factor and N is number of risk factors.

Statistical analysis
In the data analyses for prevalence of the risk factors in NHANES, the sampling weights for interview (WTMEC2YR) and study design variables (SDMVPSU and SDMVSTRA) were applied. Weighted analyses were conducted to consider the complex sampling design and to obtain appropriate SEs.
Summary RR was synthesised to evaluate the association between each risk factor and risk of RA. The heterogeneity among studies was assessed using the Cochran Q test30 and I2 statistic,31 with a statistically significant heterogeneity defined as p<0.10 or I2 >50%. A random-effects model32 was applied when a statistically significant value was presented; otherwise the fixed-effects model33 was used. Sensitivity analysis was performed to evaluate the stability of the association by sequential removal of each study from the analysis. Publication bias was assessed using Egger’s test and Begg’s test. A funnel plot was generated, of which symmetry suggested no evidence of publication bias. The Preferred Reporting Items for Systematic Reviews and Meta-Analyses checklist for reporting systematic reviews and meta-analyses was used.
Statistical tests were performed using SAS V.9.2 software (SAS) and STATA V.12.0 software (StataCorp). A p<0.05 was considered significant.
Patient and public involvement
Patients or the public were not involved in the design, conduct, reporting or dissemination of our research.
Results
Distribution of risk factors
Of the 6437 individuals aged more than 15 years sampled for NHANES 2005–2006, the total percentages of never smokers, former smokers and current smokers were 52.79%, 25.32% and 21.90% (table 1). For BMI, the percentages of overweight and obesity were 23.44% and 22.93%, respectively. The average alcohol consumption was 3.57 drink/week, approximately equal to 44.63 g/week. Table 1 also presents the weighted proportion of smoking status, and the weighted means of BMI and alcohol consumption, which were used for PAF calculation in subsequent analysis. If a lag-time of 15 years instead of 10 years between the selected risk factors and risk of RA was considered, we used NHANES 2001–2002 dataset for sensitivity analysis, and the corresponding result was shown in table 1.
Association between selected risk factors and RA
The flow chart of study inclusion and exclusion was shown in online supplemental figure 1. Nine studies34–42 were included to evaluate the association between smoking status and risk of RA among US adults, among which there were five cohort studies, three case–control studies and one nested case–control study (table 2). Four studies had a score of 8, three studies scored 7 and two study scored 6, respectively (online supplemental table 2). Compared with never smokers, former smokers (I2=57.4%, RR=1.22, 95% CI 1.10 to 1.36) and current smokers (I2=60.1%, RR=1.47, 95% CI 1.29 to 1.68) in the meta-analysis (figure 1). In sensitivity analysis, omission of one study at a time did not materially alter the results, with RR ranging from 1.05 to 1.41 in former smoking and from 1.24 to 1.75 in current smoking, respectively. The Begg’s test (p=0.917 for past smoking; p=0.917 for current smoking) and Egger’s test (p=0.174 for past smoking; p=0.062 for current smoking) did not suggest evidence of potential publication bias.
Supplemental material
Supplemental material

Forest plot of the association between smoking and risk of RA. RA, rheumatoid arthritis; RR, relative risk.
Basic characteristic of included studies in the meta-analysis on the association between selected risk factors and RA
Four studies34 40 43 44 reported the association between BMI and risk of RA, including three cohort studies and one case–control study (table 2). One study had a score of 8, two studies scored 7 and one study scored 6, respectively (online supplemental table 2). The linear regression model indicated a high goodness of fit for the risk of RA, with the RR of 1.09 (95% CI 1.04 to 1.15) for every 5 kg/m2 increase in BMI. In the categorical meta-analysis, excess BMI was found to be higher risk of RA (I2=44.0%, RR=1.27, 95% CI 1.09 to 1.48; figure 2). Sensitivity analysis suggested that RRs ranged from 0.92 to 1.70, as the study by Lu et al44 had a strong effect on the combined effect estimates. The Begg’s test (p=1.000) and Egger’s test (p=0.772) did not suggest evidence of potential publication bias.
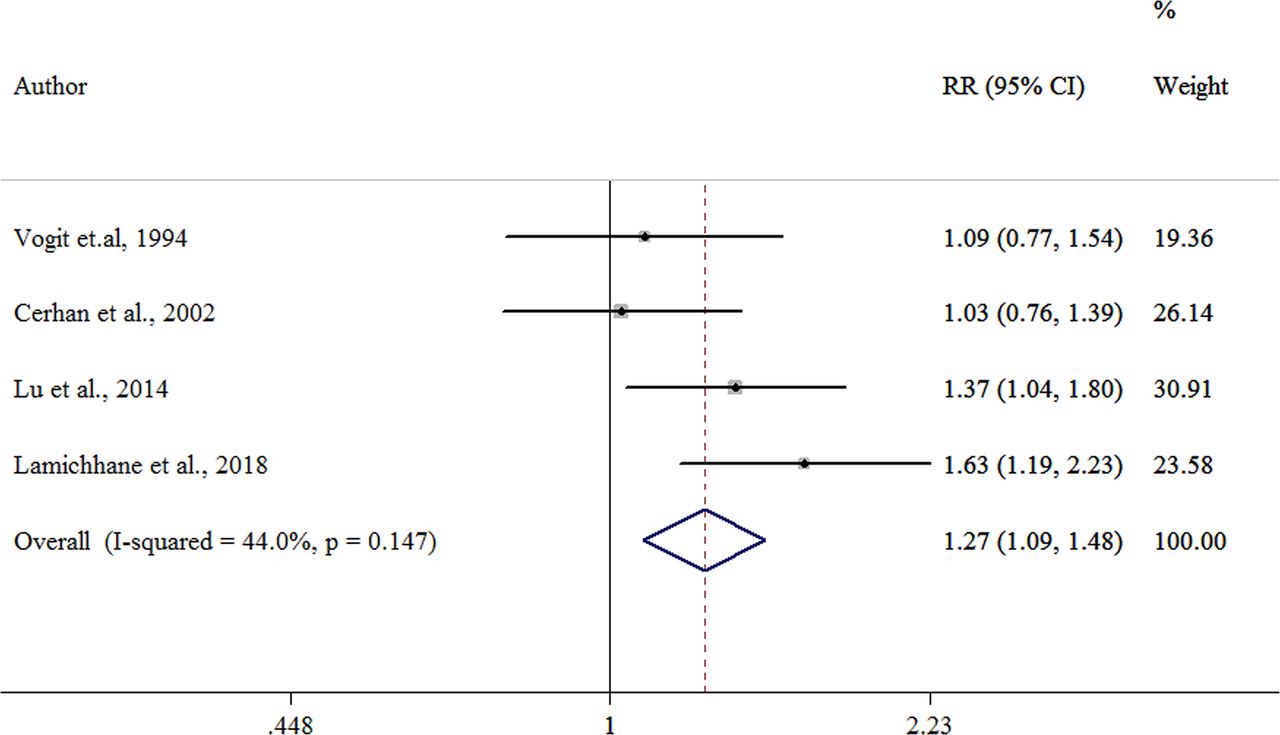
Forest plot of the association between overweight/obesity and risk of RA. RA, rheumatoid arthritis; RR, relative risk.
Likewise, a total of four studies34 40 43 45 were included in the dose–response meta-analysis of the association between alcohol consumption and risk of RA among US adults (table 2). There were three cohort studies and one case–control study. Two studies scored 8 and two study scored 7, respectively (online supplemental table 2). As no evidence of a non-linear relationship was found (pnon-linearity=0.321), we used linear model to assess the association between alcohol consumption and risk of RA (figure 3). The linear dose–response relationship was statistically significant for RA (RR (95% CI) per 50 g/week increment: 0.92 (0.84 to 1.00)) with low heterogeneity (p=0.690). Sensitivity analysis and publication bias test were not available in the dose–response meta-analysis.

Dose–response relationship between alcohol consumption and risk of RA. RA, rheumatoid arthritis.
PAFs of selected risk factors
The estimated PAFs were summarised in table 3. Smoking was one of the main RA risk factors in US adults with a PAF of 14.00% (95% CI 8.13% to 23.33%), with an estimation of 16 072 attributable RA incident cases. Excess BMI accounted for 14.73% (95% CI 5.45% to 23.50%) of RA risk (16 910 cases). The fraction of RA risk attributed by alcohol intake was 8.21% (95% CI 0.31% to 16.39%), with the estimated cases of 9425. Overall, we estimated that 32.69% (95% CI 13.41% to 50.96%) of the total incident RA cases in 2016 were attributable to the combined effects of smoking, high BMI and no alcohol drinking.
Number and proportion of RA cases attributable to selected risk factors in USA (2016), aged more than 15 years
In sensitivity analysis, the proportion of RA risk attributable to smoking, high BMI and no alcohol intake would be 14.14% (95% CI 8.28% to 23.44%), 14.38% (95% CI 5.30% to 22.99%) and 9.49% (95% CI 0.36% to 18.82%), respectively. Collectively, the above three risk factors contributed to 33.46% (95% CI 13.45% to 52.14%) of RA cases.
Discussion
This study comprehensively estimates the burden of RA incidence attributable to well known risk factors among US adults. Overall, we estimated that 32.69% of RA incident cases were attributable to the combined effect of smoking, excess BMI and no alcohol intake. Smoking and excess BMI accounted for the most fraction of RA incidence, and the robustness of PAF with respect to different lag-time was confirmed by sensitivity analysis.
Smoking is by far the most recognised risk factor for RA. The biological effect of smoking in the risk of RA was found to interact with human leukocyte antigen-DRB1 shared epitope (HLA-DRB1 SE) alleles in triggering and persuading immunity against citrullinated proteins.46 In our meta-analysis for previous epidemiological studies conducted in US adults, we found consistent association between smoking and risk of RA, with pooled RRs of 1.22 in former smokers and 1.47 in current smokers, although we found modest heterogeneity. The complexity of participant characteristics may possibly explain the difference, for example, reproductive factors among female participants, while most of these variables were not available for subgroup analysis and meta-regression analysis. The magnitude of PAF value (14.00%) between smoking and RA is similar to, or smaller than, those in three previous studies of US women. For example, among 65 457 women with sufficient data of familial RA or lupus in the Nurses’ Health Study, smoking more than 10 pack-years was found to account for 14% of RA risk.47 It is estimated that smoking contributes 18% and 25% of the population-attributable risk of RA in Iowa Women’s Health Study36 and Nurses’ Health Study.48 The discrepancy may mainly due to that our RR estimation was based on meta-analysis from original studies among both men and women, which was more stable and comprehensive than one single study.
Although high BMI is a less established RA risk factor than smoking, there is growing interest in understanding the association between excess weight and disease risk, as the prevalence of overweight and obesity is increasing worldwide at an alarming rate.49 Adipocytes present in overweight and obese individuals have been shown to secrete inflammatory markers,50 including tumour necrosis factor-α and interleukin-6, which have been implicated in RA pathogenesis. In our meta-analysis, categorical and continuous BMI were both found to be associated with increased risk of RA. The PAF value of overweight and obesity on RA reached 14.73%, and the result of sensitivity analysis for estimating PAF using the prevalence in 2001 remained robust. Our estimation was higher than Sparks’s study,47 which could be explained by the source of prevalence of overweight and obesity.
Previous studies found that low to moderate level of alcohol consumption was inversely and significantly associated with the development of RA in a dose–respondent manner.6 The mechanism behind this association may be that alcohol could downregulate the immune response and decrease production of proinflammatory cytokines.49 In the current dose–response meta-analysis, a decreased risk of RA was found with an RR of 0.92 for every 50 g/week increase in alcohol consumption. Moreover, the fraction of RA risk attributed by no alcohol intake was 8.21%. Only one similar study was available in USA,47 and showed that low alcohol intake (none or <5 g/day) accounted for 12% of RA risk. Thus, more research is needed to elucidate the burden of alcohol consumption on risk of RA among US adults.
In terms of actionable prevention for RA, currently there is likely enough evidence to recommend that to reduce risks for RA that individuals should stop smoking and maintain optimal body weight. The decision of whether alcohol drinking is beneficial becomes a trade-off, because it might increase the proportion of heavy drinkers and thereby enhance the risk of other diseases such as strokes, some cancers, cirrhosis of the liver or injuries. But at least that moderate drinking will not increase risk of RA.
The main strength of our study was the systematic assessment of RA causes among US adults, which integrated prevalence data from nationally representative studies with meta-analysis on the association between selected risk factors and risk of RA. However, our results have several limitations, because there were several sources of uncertainty in the PAF estimates. First, RA incidence was lacking, and was estimated from mortality data using IMR. Limited by the available IMR estimation near the year of 2016, the current study used the IMR value estimated by pooling seven cohorts after the year of 1983 from a previous meta-analysis published in 2013.15 For the downward trend in IMR over time, as the availability of new treatments such as methotrexate and biological disease-modifying antirheumatic drugs, introduced huge benefits for the treatment of RA and these drugs are associated with survival benefits, the outdated IMR value from previous study may result in underestimation of RA incidence. Second, several other known risk factors of RA exist but have not been included in our study. For example, further emerging evidence suggests that diet might be associated with risk of RA, but the results were inconsistent. Third, we cannot exclude the possibility of residual confounding on account of the nature of the included observational studies in the meta-analysis, although most of the studies adjusted for major risk factors of RA. Fourth, we estimated the PAF value under the assumption that there would be no change in the lifestyle factors over time, which is often unrealistic. Fifthly, we did not adjust the PAFs for the potential interaction of the selected risk factors (eg, the joint effects of smoking and alcohol drinking), because few data from USA can be available to provide the accurate RRs for interaction between these risk factors. Combined PAF for the three risk factors, however, was estimated in our study. Furthermore, as PAF value can vary from one population to another because of the impact of other risk factors and the interaction with environmental and genetics factors, the PAF calculation in the current study was estimated among US adults, confining its representativeness.
Conclusion
We estimated RA incident cases attributable to smoking, overweight or obesity and alcohol drinking, informing key intervention targets to reduce RA risk in the region. The effect of unselected risk factors on RA is still unknown. It is needed to continue more fundamental research on other lifestyle factors to illuminate the questions.
References
Supplementary materials
Supplementary Data
This web only file has been produced by the BMJ Publishing Group from an electronic file supplied by the author(s) and has not been edited for content.
Footnotes
Contributors CW and DY conceived the study. DY, YM, CW and ZX designed the study. YX and XX conducted the systematic review and meta-analysis. DY and YM conducted the PAF analysis. DY and YM drafted the manuscript, and all of the coauthors contributed to critical revision of the manuscript. The corresponding authors attest that all listed coauthors meet authorship criteria and that no others meeting the criteria have been omitted. All authors interpreted the data, critically revised the manuscript for important intellectual content, and approved the final version of the manuscript.
Funding This work was supported by grants of National Key R&D Program of China (2018YFC1705500) and National Natural Science Foundation of China (81973663).
Disclaimer The funders had no role in the study design, data analysis, interpretation of data, or preparation of the manuscript.
Competing interests None declared.
Patient consent for publication Not required.
Provenance and peer review Not commissioned; externally peer reviewed.
Data availability statement All data relevant to the study are included in the article or uploaded as online supplemental information.
Supplemental material This content has been supplied by the author(s). It has not been vetted by BMJ Publishing Group Limited (BMJ) and may not have been peer-reviewed. Any opinions or recommendations discussed are solely those of the author(s) and are not endorsed by BMJ. BMJ disclaims all liability and responsibility arising from any reliance placed on the content. Where the content includes any translated material, BMJ does not warrant the accuracy and reliability of the translations (including but not limited to local regulations, clinical guidelines, terminology, drug names and drug dosages), and is not responsible for any error and/or omissions arising from translation and adaptation or otherwise.