Article Text

Abstract
Objectives To improve exposure estimates and reexamine exposure–response relationships between cumulative styrene exposure and cancer mortality in a previously studied cohort of US boatbuilders exposed between 1959 and 1978 and followed through 2016.
Methods Cumulative styrene exposure was estimated from work assignments and air-sampling data. Exposure–response relationships between styrene and select cancers were examined in Cox proportional hazards models matched on attained age, sex, race, birth cohort and employment duration. Models adjusted for socioeconomic status (SES). Exposures were lagged 10 years or by a period maximising the likelihood. HRs included 95% profile-likelihood CIs. Actuarial methods were used to estimate the styrene exposure corresponding to 10-4 extra lifetime risk.
Results The cohort (n= 5163) contributed 201 951 person-years. Exposures were right-skewed, with mean and median of 31 and 5.7 ppm-years, respectively. Positive, monotonic exposure–response associations were evident for leukaemia (HR at 50 ppm-years styrene = 1.46; 95% CI 1.04 to 1.97) and bladder cancer (HR at 50 ppm-years styrene =1.64; 95% CI 1.14 to 2.33). There was no evidence of confounding by SES. A working lifetime exposure to 0.05 ppm styrene corresponded to one extra leukaemia death per 10 000 workers.
Conclusions The study contributes evidence of exposure–response associations between cumulative styrene exposure and cancer. Simple risk projections at current exposure levels indicate a need for formal risk assessment. Future recommendations on worker protection would benefit from additional research clarifying cancer risks from styrene exposure.
- cancer
- epidemiology
- risk assessment
- retrospective exposure assessment
- occupational health practice
Statistics from Altmetric.com
Key messages
What is already known about this subject?
Styrene is a widely used high-production chemical that is deemed a probable human carcinogen, on the basis of sufficient evidence in animals, but limited evidence in humans.
Styrene exposure, primarily via inhalation, is highest among workers in the fiberglass-reinforced plastics industry.
Consistency among study examining cancer and styrene is lacking, as is adequate exposure–response information for quantifying occupational cancer risks.
What are the new findings?
In line with recent findings in other working populations, this study revealed exposure–response associations between styrene inhalation exposure and mortality from leukaemia and bladder cancer in a cohort of US boatbuilders.
How might this impact on policy or clinical practice in the foreseeable future?
The study supports future efforts in risk assessment to develop occupational exposure limits and other risk management practices aimed to reduce cancer risks in workers exposed to styrene.
Background
This study extends analysis of a cohort of US boatbuilders in Washington state exposed to styrene and followed from 1959 to 2016.1 The previous study found evidence of an exposure–response between employment duration (a proxy for styrene exposure) and leukaemia mortality. The current study introduces new exposure assessment information, including estimates of individual cumulative styrene exposures and improved exposure–response modelling for leukaemia and other cancers of a priori interest.
Styrene is a high production chemical that is widely used to manufacture polystyrene plastics and resins. US production is about 5 million metric tons per year, employing about 128 000 US workers.2 The primary route of occupational exposure is inhalation, although styrene is readily absorbed through skin. Among multiple styrene uses, the reinforced plastics and composites (RPC) industry is of particular interest for epidemiological study, especially those RPC workers involved in manual lay-up and spray operations (eg, as in fibreglass boatbuilding), given exposures to relatively high levels of styrene in the absence of other occupational carcinogens.3
Associations between styrene and cancer have been studied extensively.3–8 Based on sufficient evidence in animals, but limited evidence in humans, the National Toxicology Program identified styrene as reasonably anticipated to be a human carcinogen.5 Similarly, the International Agency for Research on Cancer classified styrene as a probable human carcinogen (group 2A).8 In observational studies, modest associations between styrene exposure and cancers of the lymphohematopoietic (LH), respiratory, digestive and urinary systems occur most often.1–5 8–16 Still, uncertainty in animal-to-human extrapolation, inconsistencies across human observational studies and a general lack of exposure–response information raises questions on styrene carcinogenicity.7
Methods
Study population
Cohort enumeration and vital status ascertainment were conducted previously.1 9 17 The cohort comprised all workers employed in one of two Washington state boatbuilding facilities between 1 January 1959 and 31 September 1978. Workers without adequate information for planned analysis were excluded (n=38). Observation was from the date of cohort entry to the earliest of the date of death, date last observed or study end (31 December 2016). To reduce exposure misclassification, person-time was truncated at 1 October, 1978+exposure lag, for those workers who were actively employed on that date (~15%), which was the last day of available records for assessing exposure. Vital status was ascertained using data from the National Death Index (NDI), Social Security Administration, Internal Revenue Service, Washington State Department of Motor Vehicles and a case location service. Death data were collected from death certificates prior to 1979 and from the NDI hereafter. Mortality from cancers of the LH, digestive, urinary and respiratory systems was determined from the underlying cause of death, coded by a trained nosologist according to the revision of the International Classification of Diseases (ICD) in effect at the time of death. Data on tobacco use were not available; therefore, patterns of smoking-related solid cancers18 were examined to assess the potential for confounding by smoking. Outcome definitions are provided in the online supplementary table s-1.
Supplemental material
Exposure assessment
For this cohort, previous studies have relied on limited data to construct proxies for styrene exposure for use in exposure–response assessments, such as employment duration and crude categories of exposure potential.1 9 17 The current analysis is the first to make full use of available employment information and exposure measurement data to construct a job-exposure matrix describing career cumulative exposures for each worker as a continuous variable that accounted for changes in exposure potential over time.
The exposure assessment was conducted by exposure scientists blinded to case status. Work history information for each worker was abstracted and coded into a relational database. Samples of records were periodically recoded and compared with the database for quality control. These records (n=9731) comprised job titles and department assignments from both plants held throughout a worker’s career, including periods of unemployment and other time away from work (eg, furlough, medical leave and vacation). This information was linked to exposure data from personal air samples (n=399) collected in each plant during operations in 1978 that also included job titles, task and department assignment (online supplementary table s-2).19 20 Measurements were recorded as 8-hour time-weighted average (TWA) styrene concentrations in parts per million (ppm). General area air-sampling data collected during the same surveys were used in job locations with inadequate personal measurements. For example, personal measurements were not available for office workers; however, general-area air sampling was conducted in some offices.
Expert judgement was used to collapse individual jobs and departments into similar exposure groups by plant (plant 1, n = 19; plant 2, n = 13), which were derived from the exposure data (online supplementary table s-2). Cumulative exposure (ppm-years) for each worker was expressed as  , for exposure groups i = 1, 2, …, n, exposure duration, Di, in years and group-specific mean styrene airborne concentration, Ci
, in ppm. Exposures were accrued up to the time of the attained age of the index case, with subtraction of any exposure lag. Exposures were reduced by 50% for supervisors in styrene departments to account for time spent in tasks other than styrene work. No credit was given for respiratory protection, contributions from dermal exposure or changes in exposure controls over time.
, for exposure groups i = 1, 2, …, n, exposure duration, Di, in years and group-specific mean styrene airborne concentration, Ci
, in ppm. Exposures were accrued up to the time of the attained age of the index case, with subtraction of any exposure lag. Exposures were reduced by 50% for supervisors in styrene departments to account for time spent in tasks other than styrene work. No credit was given for respiratory protection, contributions from dermal exposure or changes in exposure controls over time.
Socioeconomic status
Information on job descriptions was used as a surrogate for lifestyle and social class, which are risk factors that may confound the association between styrene exposure and cancer.21 The first job held by each worker was related to occupation categories listed in the 1980 Classified Index of Industries and Occupation.22 The first job title was chosen to represent lifestyle behaviours that may be related to cancer risk (eg, smoking and alcohol use) that are usually established in adolescence and early adulthood. Socioeconomic status (SES) was determined for each worker using the occupational prestige scale developed by Nakao and Treas, linking first job title to a prestige score.23 Details on the derivation of these indices are provided elsewhere.24 25 Briefly, the prestige score was generated by a national sample of survey respondents who placed job titles into nine ‘ladder rungs’ (bins) representing degrees of social standing. Ratings were then averaged for each occupation across all respondents to form scores ranging from 0 (lowest prestige) to 100 (highest prestige). This approach is thought to be a more precise conceptualisation of the relationship between occupation and SES.21
Statistical analysis
All statistical analyses were conducted with SAS software, V.9.4 (2002–2012).26 Exposure–response relationships were examined in Cox proportional hazards regression models using methods described by Langholz and Richardson.27 Modelling was restricted to outcomes with 10 or more deaths. Risk sets (each including an index case and matched controls from all others at risk) matched on race, gender, birth date (within 5 years) and employment tenure (<1 year and ≥1 year). Attained age was the timescale. The model form is HR = H(D 50)/H(D 0) and H(Di )=exp(βDi ), where the HR is the ratio of the hazard rate at a specified exposure D 50 = 50 ppm-years to the rate at null exposure, D 0 = 0 ppm-years and β is the estimated exposure parameter. The specified exposure level is equivalent to 1 working year at the current Recommended Exposure Limit.28 Exposure was lagged 10 years. Models were also fitted without an exposure lag. To counter the effects from extreme exposures, models were fitted by excluding person-time with exposure >500 ppm-years (ie, ‘trimmed’ at <1% of the right-tail of the cumulative exposure distribution).29 All model estimates included profile likelihood 95% CIs to ensure adequate coverage.
Additional analyses were conducted for outcomes in a major category with indication of a positive exposure–response association with styrene. In addition to 0, and 10 year lags, a best-fitted lag was determined with a grid search of a range of lags (2–40 years in 1-year increments) to find the period that maximised the likelihood function. Given imprecision in lag estimates, 90% CIs were calculated. The time since last exposure (TSLE) among cases was examined as another descriptor of potential latency. The shape of the exposure–response curve was examined with restricted cubic spline (RCS) models fitted to the full dataset under the best-fitted lag. The RCS used three knots set at 50, 100 and 500 ppm-years to reduce the influence of doses in extremes of the dose distribution. The effect of truncating person-time of active workers was examined using leukaemia models without person-time truncation, assuming null exposures to workers beyond 1 October 1978.
The estimate of the leukaemia excess relative risk per ppm-year was used to project working lifetime risks in a hypothetical working population exposed to styrene. The model applying dose trimming was preferred, given strong risk attenuation at high doses. A 10-year lag was used for consistency with other studies. Given the potential for the loglinear rate function to overestimate risk at higher exposures, the linear slope of the exposure–response between 0 and 50 ppm-years was used to project risk. Actuarial methods (ie, life table analyses) were used to account for mortality from competing causes. These methods account for age-specific death rates assuming that the relative risk, conditional on exposure, is independent of age.30 The model further assumes that increased leukaemia risk from styrene is persistent, proportional to cumulative exposure, and the exposure–response is without a threshold. The risk was characterised as the styrene concentration estimated to cause one extra leukaemia death per 10 000 workers exposed over a working lifetime, defined as 8 hours shifts, 5 days a week, 50 weeks a year, from age 20 to age 65. Lifetime risk was accrued to age 85 years.
Baseline rates for all-cause mortality and all leukaemia (ICD10 C91-C95) were extracted from the Centers for Disease Control and Prevention Wonder Database (1999–2017) with 5-year age groups of the underlying cause of death for all races and both sexes combined.31 A second analysis restricted to male baseline rates was also conducted. The life table predicts risks within age intervals that are conditional on survival to each age interval for intervals specified over the working lifetime period. Summation of the conditional probabilities of death in each interval, using baseline disease rates, provides an estimate of the lifetime risk in the unexposed (R0 ). Likewise, summing the conditional probabilities calculated from rates adjusted for exposure provides a corresponding risk measure, Rx , in the exposed. These measures were used to calculate lifetime extra risk (ie, (Rx – R0 )/(1 – R0 )].
Results
The study cohort (n=5163) was predominately Caucasian (93%) and male (87%). The cohort contributed 175 930 person-years with truncation and 201 951 person-years without. The average age at end of follow-up was 68 years; 46 workers (<1%) were lost to follow-up. The average length of employment was less than 2 years and most (68%) were employed less than 1 year. On average, persons working directly with styrene (n=1958) worked fewer years (1.18 years) than other groups combined (1.85 years) (table 1). Unlagged cumulative exposures were highly positively skewed, with mean and median values of 31 ppm-years and 5.7 ppm-years, respectively table 2, online supplementary figure s-1).
Cohort characteristics by tertiles of cumulative exposure
Cumulative unlagged styrene exposure (ppm-years) by plant
There was no evidence of excess respiratory or digestive cancers from cumulative exposure (table 3). Elevated HRs were found for urinary and LH sites in models using the full dataset; however, CIs included unity. Trimming person-time by exposure increased risk estimates, resulting in significantly positive HRs for LH and urinary outcomes at 50 ppm-years styrene, including bladder cancer (HR=1.64; 95% CI 1.14 to 2.33) and leukaemia (HR=1.46; 95% CI 1.04 to 1.97). There were no cases among persons with cumulative exposure ≥500 ppm-years. There was no evidence of confounding by SES for any outcome. There was no evidence of an association between styrene and smoking-related cancers combined. There was little difference in model estimates without lagging exposure, compared with models assuming a 10-year lag (online supplementary table s-3). Leukaemia findings were not appreciably changed by including person-time for active workers after 1978 (online supplementary table s-4).
HRs at 50 ppm-years styrene (lagged 10 years) by exposure trimming and adjustment for socioeconomic status (SES)
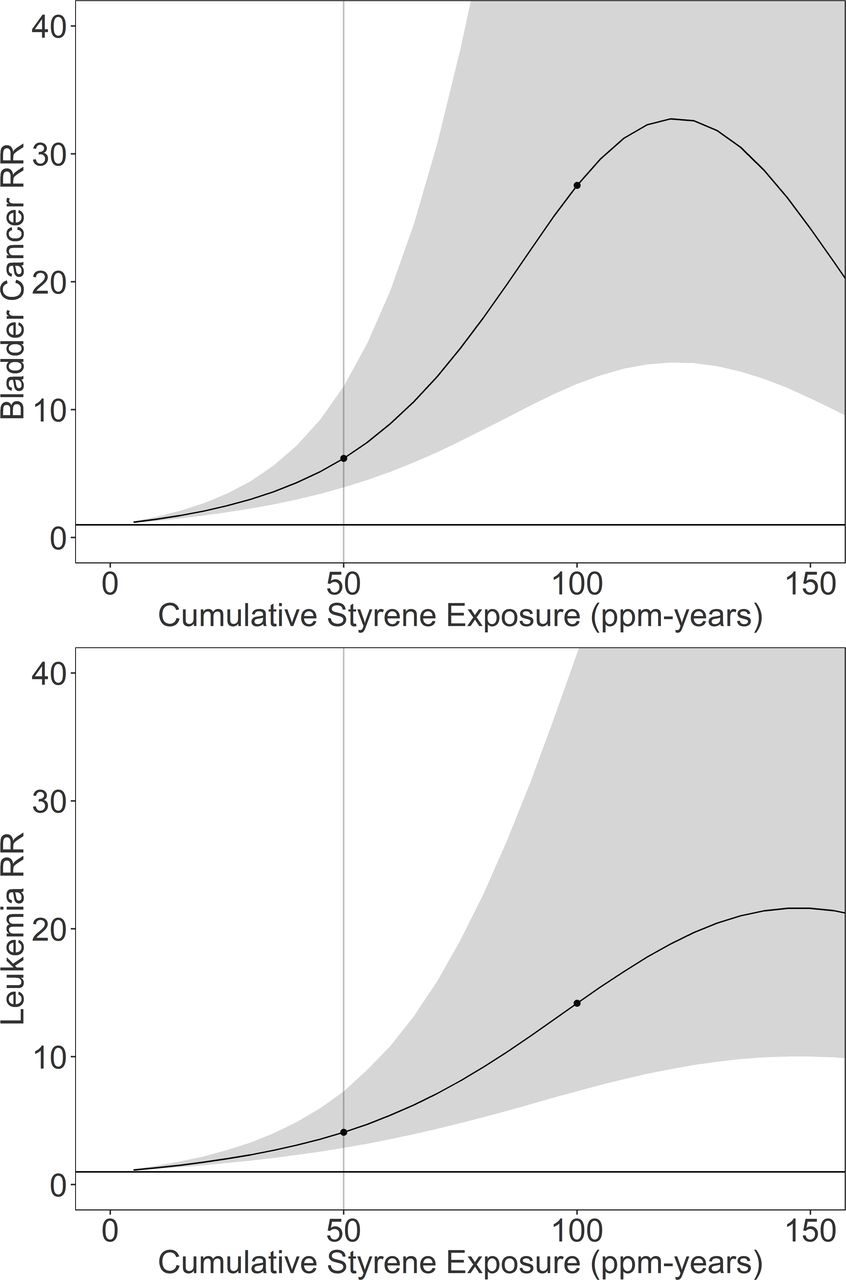
Best-fitted lags were longer than 10 years for all outcomes. The longest lags were for non-Hodgkin’s lymphoma and multiple myeloma, which were at the boundary of the grid search (40 years). The shortest period was for kidney cancer (33 years); however, the 90% CI could not be determined. Median TSLE among cases ranged from 28 years for kidney cancer to 35 years for multiple myeloma. For leukaemia, the minimum TSLE was 19.1 years. RCS models provided substantively increased HRs compared with full and trimmed loglinear models (table 4). Figure 1 shows the plot of the dose-response for bladder cancer (HR at 50 ppm-years=6.20; 95% CI 3.93 to 11.83) and leukaemia (HR at 50 ppm-years=4.10; 95% CI 2.88 to 7.29). The plots were truncated at 150 ppm-years, which is above the 99th percentile of lagged cumulative exposure for both outcomes. The observed exposure–responses indicated a pattern of increasing risk at low exposures, followed by attenuation through attrition of cases at higher exposures. This downward curvature was around 120 ppm-years for bladder cancer and 150 ppm-years for leukaemia.

Results of restricted cubic spline models of the relative risk (RR) of mortality from bladder cancer (top) and leukaemia (bottom). The plot shows the dose response curve (solid line) with knots (solid circles) and the 95% profile-likelihood based CI.
Best-fitted lag period, median time since last exposure (TSLE), and HRs at 50 ppm-years styrene from the restricted-cubic spline models of sites with ≥10 cancer deaths*
The estimate of leukaemia risk under a 10-year lag in trimmed data was selected for projecting risk. The linear slope was 0.0088 per ppm-year, which corresponded to a lifetime extra risk of 10-4 following a 45-year continuous exposure to about 0.05 ppm styrene using sex-averaged baseline rates and 0.03 ppm using male only rates.
Discussion
This study re-examines exposure–response patterns between cancer and cumulative styrene exposure in a cohort of US boatbuilders.1 For this analysis, individual estimates of cumulative styrene exposures were derived from employment records and personal air sampling data not used in previous examinations. The employment records also provided for estimating SES; an unmeasured potential confounder in prior exposure–response assessments. Other strengths include lengthy follow-up and relatively high styrene inhalation exposures without concomitant exposure to other occupational carcinogens. Among cancers of a priori interest, positive associations were evident only for leukaemia and bladder cancer.
The current study reports a 1.5-fold increase in leukaemia risk at 50 ppm-years styrene in a model restricted to exposures <500 ppm-years. In a study of Danish RPC workers, Christensen et al also found a significant linear trend (p=0.01) in acute myeloid leukaemia by increasing cumulative styrene exposure 15–29 years prior, with over a twofold increase in the rate ratio (RR) in the highly exposed category (≥10.6 ppm-years) compared with the unexposed category (RR=2.4; 95% CI 1.2 to 4.6).10 In contrast, other studies of RPC workers have not revealed increased leukaemia risk associated with styrene exposure.11 12 14
In a previous study, Ruder et al reported a standardised rate ratio for bladder cancer of 1.40 (95% CI 0.16 to 12.54) comparing high-exposed and low-exposed groups in workers with one or more years of employment (n=1678).9 The standardised incidence ratio (SIR) was weakly increased among Danish male RPC workers (SIR=1.08; 95% CI 1.00 to 1.16) compared with the general population; however, the study lacked clear indication of an exposure–response.13 Increased bladder cancer risk was not apparent in other major studies of RPC workers.11 12 14 However, evidence of an association between bladder cancer and styrene has been observed in styrene-butadiene rubber workers.16 Sathiakumar et al reported excess bladder cancer risk associated with exposure in analyses of a large cohort of North American synthetic rubber workers, including a positive exposure–response trend in cancer risk with increasing cumulative exposure for both styrene (p=0.004) and 1,3-butadiene (p=0.0003), analysed separately.16 However, exposures were not jointly analysed; therefore, it is unclear if the observed associations were due to styrene, 1,3-butadiene, or both monomers combined. Also, smoking data were not available to control for potential confounding by smoking, which is an important risk factor for bladder cancer.18
Associations between cumulative styrene exposure and some cancers appeared attenuated at higher exposure levels, as evidenced by increased HRs at 50 ppm-years in trimmed models compared with full models and RCS models with relatively steep slopes in the low-dose range of the exposure–response curve, followed by downward curvature in the high exposure range. The downward curvature in risk appeared at exposures levels <200 ppm-years, suggesting that exposure trimming at 500 ppm-years in loglinear models is only partly effective. RCS models revealed much higher risks at low exposures than did loglinear models, including the trimmed models, suggesting that parametric models incorporating standard linear or loglinear response functions may underestimate the risk at lower exposures. However, the cut-points for trimming are arbitrary and fewer data are available for estimating risk in trimmed models. Therefore, flexible models, such as the RCS model shown here, offer potentially superior methods of assessing risk in the low-dose range.
Response attenuation stems from few workers (and fewer cancer cases) residing in the right tail of the highly skewed exposure distribution. Potential causes of risk attenuation are the small effect size and disease rarity, exposure measurement error, depletion of a susceptible population, biological saturation and healthy worker survival effects (HWSE), alone or in combination.32 With respect to HWSE, styrene is a skin and respiratory irritant,33 and work histories revealed that some workers (<3%) were reassigned to less exposed jobs or left work following the onset of acute symptoms (eg, dermatitis, cough) from styrene exposure, which may have biased risk estimates. This type of HWSE cannot be adequately addressed by standard methods of confounding control.34 Other analytic methods, such as G-estimation of structural nested failure time models, may be needed to better elucidate the true exposure–response association between styrene and cancer.35
The RCS models also indicated longer latency than 10 years for all outcomes. The best-fitted lag for leukaemia mortality was 37 (90% CI 20 to 39) years, compared with 15–29 years observed in the Danish RPC workers. However, this lag was consistent with the observed 20 years minimum TSLE among leukaemia deaths. Similarly, the median TSLE for all outcomes ranged from 28 to 39 years in this cohort, which is characterised by brief career exposures (mean employment duration=1.6 years) at young ages (median age at hire=24 years). This exposure pattern may explain longer than expected lags compared with those in other studies. Improvements in cancer survival may also partly explain longer latency.
The current study is among the first to use human exposure–response data to project lifetime cancer risks from occupational styrene exposure. In a simple risk projection, exposure to an 8-hour TWA concentration of 0.05 ppm styrene over a working lifetime corresponded to 10-4 extra leukaemia risk. In comparison, the Office of Environmental Health Hazard Assessment estimated a no significant risk level (NSRL) for styrene at 27 µg/day from studies of cancer in rodents.36 The NSRL is the intake level corresponding to one excess case of cancer per 100 000 persons continuously exposed over a 70-year lifetime. Based on an assumed work shift breathing rate of 9.6 m3, this level is roughly equivalent to 0.01 ppm for 10-4 risk from exposure over a working lifetime. The dose levels corresponding to 10-4 cancer risk in these two small assessments fall well below the Threshold Limit Value of 20 ppm,37 suggesting that current recommendations on occupational exposure may benefit from future quantitative risk assessments of cancer and styrene exposure.
Several sources of uncertainty point to cautious interpretation of study findings. First, although improvements were made to exposure assessment, the validity in exposure estimates is still uncertain. Without validation, bias in risk estimates from measurement error cannot be ruled out. Second, the potential for bias from other sources common to occupational studies, such as HWSE and residual confounding remains. However, there was no evidence of confounding by occupational prestige (a proxy for SES) and no apparent association between styrene and smoking related cancers combined. This suggests an absence of strong confounding by lifestyle risk factors. Third, the study lacks adequate information to appropriately examine tumor-specific risks (eg, leukaemia subtypes) which may exhibit different exposure–response patterns. Fourth, this study is relatively small; therefore, is disadvantaged by low statistical power. Lastly, the mode of action for styrene carcinogenicity remains unclear. Lacking these data, this study assumed a linear relationship between leukaemia and cumulative exposure at low exposure levels, although a true exposure–response, if present, may be sublinear or may have a threshold. Indeed, the exposure–response in RCS models for both leukaemia and bladder cancer appear sublinear at low exposure. Thus, the true risk from a working lifetime exposure to 0.05 ppm styrene may range well above the predicted value of 10-4 or may actually be zero.
Conclusion
In summary, this study builds on previous examinations of cancer mortality in a cohort of workers exposed to styrene while manufacturing fibreglass boats. Incorporating new study data in the exposure–response assessment revealed additional evidence on associations between cumulative styrene exposure and mortality from leukaemia and bladder cancer in these workers. Using the data on leukaemia, simple risk projections at current exposure levels suggest further evaluation is needed. Future recommendations on worker protection would benefit from additional research clarifying cancer risks from styrene exposure.
Acknowledgments
The authors acknowledge staff at the National Institute for Occupational Safety and Health (NIOSH) for contributing to the collection, coding, and management of study data.
References
Footnotes
Contributors Data collection was accomplished by contributors to previous studies, including RDD and SJB. RDD and SJB participated in design, analysis and manuscript development. Both authors participated in the interpretation and presentation of results and have read and approved the final manuscript.
Funding This research was conducted as part of routine duties of NIOSH staff. No external funds were used.
Disclaimer The findings and conclusions in this report are those of the authors and do not necessarily represent the views of the National Institute for Occupational Safety and Health.
Competing interests None declared.
Patient consent for publication Not required.
Ethics approval This work was conducted at the National Institute for Occupational Safety and Health, which is part of the Centers for Disease Control and Prevention (CDC) under the US Department of Health and Human Services. The research was approved by the NIOSH Human Subjects Review Board.
Provenance and peer review Not commissioned; externally peer reviewed.
Data availability statement Data are available on reasonable request. Study data are maintained by the National Institute for Occupational Safety and Health (NIOSH) of the Centers for Disease Control and Prevention (CDC) according to the Privacy Act System Notice 09-20-0147. Some data are protected by an Assurance of Confidentiality authorised under Section 308(d) of the Public Health Service Act (42 U.S.C. 242m). Data may be accessible on reasonable requests meeting the provisions of these protections and CDC data sharing policies made to NIOSH, via the corresponding author.