Article Text

Abstract
Objectives Several governments have taken measures to encourage prolonged working. It is therefore likely that older adults with a chronic disease are required to work longer in poor self-perceived health (SPH) than before. This study examines to what extent working life expectancy (WLE) in good and poor SPH changed between 1992 and 2016 in workers with a chronic disease from age 55 years onwards.
Methods Three cohorts (1992, 2002 and 2012) of workers with a chronic disease aged 55–65 years were selected from the Longitudinal Aging Study Amsterdam with a 3-year follow-up each (n=705). A three-state survival model was estimated, modelling transitions between states ‘working with good SPH’, ‘working with poor SPH’ and ‘exit from work’. WLEs were estimated using Multistate Modelling and Estimating Life Expectancies using Continuous Time in R.
Results Of the workers with a chronic disease, total WLEs at age 55 years were 5.2, 5.7 and 6.8 years in cohorts 1992, 2002 and 2012, respectively. Workers initially having poor SPH, had total WLE of 4.7 years of which 2.4 years in poor SPH in cohort 1992. These workers had total WLE of 5.2 years of which 3.3 years in poor SPH in cohort 2002, and total WLE of 6.5 years of which 3.6 years in poor SPH in cohort 2012.
Conclusions Workers with a chronic disease extended their working lives by approximately 18 months from 1992 to 2016. In the first decade, unhealthy WLE increased, whereas in the second decade, healthy WLE increased, among both workers in general and workers initially having poor SPH.
- working life expectancy
- chronic disease
- ageing workers
- prolonged working
- self-perceived health
Statistics from Altmetric.com
Key messages
What is already known about this subject?
As there are fewer possibilities to leave the labour market early, it is likely that also older adults with a chronic disease are required to work more years than before.
The question arises whether these workers are working more years in good or in poor self-perceived health, which can be examined with the working life expectancy (WLE) measure.
What are the new findings?
Total WLE of subsequent generations of workers with a chronic disease increased by approximately 18 months between 1992 and 2016.
In the first decade, unhealthy WLE increased, whereas in the second decade, healthy WLE increased.
How might this impact on policy or clinical practice in the foreseeable future?
Now that working (longer) with health problems becomes more common, it becomes increasingly important that employers support this group of workers to prolong their working lives.
Healthy and unhealthy WLE may be valuable information in the future debate on prolonged working of vulnerable groups in the labour market.
Introduction
Western societies are facing demographic changes such as ageing of the population. This puts a pressure on social security systems. To counteract negative financial consequences, several governments have implemented measures to encourage prolonged working. One of the measures that the Dutch government took is that the statutory retirement age is gradually increasing from 65 years in 2012 to 67 years and 3 months in 20221. On top of measures that should stimulate prolonged working among the general population, several measures have been taken to stimulate prolonged working among workers with health problems. Since 1966, workers with occupational limitations due to poor health had the opportunity to receive disability benefits in the Netherlands.2 In 2002, regulations were adjusted to support these workers to continue working and to encourage rapid return to work from the first day of sickness absence.2 3 Moreover, in 2006, qualification criteria to enter disability pension became stricter.3 4 This implies that older workers with health problems may need to continue working despite poor health.
Poor health and exit from work were closely related in the recent past. According to a systematic literature review, having a chronic disease increased the likelihood of disability pension and unemployment.5 As there are fewer possibilities to leave the labour market early, it is likely that also older adults with a chronic disease nowadays are required to work more years in poor self-perceived health than in previous decades. Self-perceived health is a comprehensive measure of health, meaning that it encompasses several aspects of health that are important to someone. To illustrate, self-perceived health has previously been associated with depression6 7 and functional limitations.8 Furthermore, it is a strong predictor of mortality, even when controlling for health indicators and other factors known to predict mortality.9 Hence, having a poor self-perceived health is not desirable from the perspective of a worker. As self-perceived health has previously been shown to be associated with absenteeism and presenteeism,10 working while feeling unhealthy may not be desirable from an employer’s perspective either. It is thus important to examine whether prolonged working among workers with a chronic disease is not at the expense of their self-perceived health.
Success of policies aiming at prolonged working is often illustrated by an increase in the average age of leaving employment, because this is the goal of these policies. As working longer in poor self-perceived health is not desirable from the perspective of workers and employers, one may advocate that prolonged working policies are successful, only if it does not increase time in poor self-perceived health. Thus, the question arises whether people are working more healthy or unhealthy years. This can be examined using the working life expectancy (WLE) measure. WLE is similar to life expectancy, except for the endpoint, which is exit from work instead of death.
In 2004, Nurminen et al introduced the WLE measure to investigate the number of years that municipal workers worked in different states of work ability.11 Nurminen et al argued that the WLE measure, which represents duration of occupancy in a given state of work ability, should be preferred above other measures as an indicator of population health in the context of occupational health.11 In 2007, Lievre et al12 introduced the healthy WLE measure, which the researchers defined as the number of years between the age of 50 years and 70 years both in good health and employment. By combining information on participation in paid work and health status, both operationalisations of WLE show which part of the total WLE from a certain age are spent in good health and which part in poor health. The Longitudinal Aging Study Amsterdam (LASA)13 14 provides the unique opportunity to estimate healthy and unhealthy WLE of older workers and to compare WLE in good and poor self-perceived health over three cohorts, that is, from 1992 to 1996, from 2002 to 2006 and from 2012 to 2016. Van der Noordt et al used these data to examine WLE with disability of a Dutch population of older workers.15 To date, no studies on WLE in good or poor self-perceived health have been performed among older workers with chronic diseases.
To gain insight in the consequences of policies aiming at prolonged working for workers with a chronic disease, insight into healthy and unhealthy WLE among this group is of great value. Therefore, the current study aims to investigate to what extent WLE in good and poor self-perceived health changed between 1992 and 2016 in workers with a chronic disease from age 55 years onwards.
Methods
Design and study sample
Data from the Longitudinal Aging Study Amsterdam (LASA) were used. LASA is an interdisciplinary cohort study that aims to determine predictors and consequences of changes in functioning with aging.13 14 The cohort is based on a nationally representative sample of adults aged 55–85 years. Initial response rate was 60% (n=3805). The study started in 1992. Since then, measurement cycles took place once every 3 years. Respondents were examined and interviewed in their homes by trained interviewers. Additional cohorts of respondents aged 55–64 years were recruited in 2002 and 2012 using the same sampling frame as in 1992. More detailed information on LASA can be found elsewhere.13 14
In the present study, the first two measurement cycles from the three cohorts were used, that is, 1992–1996 (cohort 1992), 2002–2006 (cohort 2002) and 2012–2016 (cohort 2012). Inclusion criteria were having a paid job, aged 55–65 years and having one or more chronic diseases at baseline. To assess employment status, respondents were asked if they had a paid job at present, including one or more hours of work per week. Presence of a chronic disease was assessed with one question with answering options: (1) chronic non-specific lung disease; (2) cardiac disease; (3) peripheral arterial disease; (4) diabetes mellitus; (5) cerebrovascular accident or stroke; (6) osteoarthritis; (7) rheumatoid arthritis; (8) cancer; and (9) other. In cohort 1992, 54% of the workers aged 55–65 years had at least one chronic disease. In cohort 2002, this was 66%, and in cohort 2012, this was 73%. Workers who dropped out during follow-up, for other reasons than dying (n=81), and those who had missing information on self-perceived health or employment status at follow-up were excluded (n=87). These inclusion and exclusion criteria resulted in a study sample of 705 persons (cohort 1992: n=134, cohort: 2002 n=247, cohort: 2012 n=324).
Self-perceived health
Self-perceived health was assessed using one question, that is, ‘How is your health in general?’, with response options: ‘very good’, ‘good’, ‘fair’, ‘sometimes good, sometimes bad’ and ‘poor’. Participants were classified as having good health if they reported to have ‘very good’ or ‘good’ health. Those who reported to have ‘fair’, ‘sometimes good, sometimes bad’ or ‘poor’ health were classified as having poor health.
Based on self-perceived health and employment status, respondents can be assigned to one of the following states: (I) ‘Working with chronic disease and good self-perceived health’, (II) ‘Working with chronic disease and poor self-perceived health’ and (III) ‘Exit from work’ (see figure 1). To assess the number of months a respondent stayed in state I or state II, information on age at which they left paid employment was needed. This was assessed using the following question: ‘In which month and which year did you stop doing paid work?’. Based on the registered date of birth, age at exit from work was calculated. If the month and year of exit were not reported (n=15), the date halfway between two interviews was used to calculate age at exit from work. For respondents who died within 3 years after an interview in which they reported to work, the date of death minus 6 months was defined as the age of exit from work (n=15).

Three-state survival model.
Demographics
Age and gender were obtained from municipal registries. Highest level of education completed comprises three levels: low (elementary school, lower vocational education or less), medium (general intermediate, intermediate vocational and general secondary education) and high (higher vocational education, college and university). Gender and level of education were not included in the analyses, but they are used to describe the study sample.
Statistical analyses
Descriptive statistics, that is, means, SD, frequencies and percentages, were used to report on baseline characteristics. Analyses took place in two steps. First, transition probabilities between the states ‘Working with chronic disease and good self-perceived health’ (state I), ‘Working with chronic disease and poor self-perceived health’ (state II) and ‘Exit from work’ (state III) were modelled using a continuous-time three-state survival model (figure 1). In the model, the times of transitions between the first and second state are interval censored. This means that the exact transition times between these states are assumed to lie between two observations and that transitions from state I to state II, or reversed, may take place several times. State III is an absorbing state, which means that this state can be entered only once. The exact transition time was obtained from the data. The model was estimated using the R-package Multistate Modelling. Hazards were estimated for transitions between the states for age and cohort dummies.16 From these hazards, HRs and transition probabilities were derived. An age-dependent model was used, which assumes that state transitions increase or decrease log linearly with age. Second, transition probabilities were used to estimate total WLEs as well as WLEs in good and poor self-perceived health. This was done using the R-package Estimating Life Expectancies using Continuous Time. WLEs are reported by cohort and for groups with good and poor self-perceived health at baseline separately. Differences between WLEs were considered statistically significant when the point estimate of one WLE was not within the 95% CI of the other WLE, and the other way around. WLEs are also graphically presented.17 The graphs show WLEs in good and poor self-perceived health on the y-axis for age 55–68 years presented on the x-axis, for workers with a chronic disease in general and for workers who initially have poor self-perceived health, respectively. WLEs are shown separately for cohort 1992, 2002 and 2012.
Sensitivity analyses
As described under ‘Design and study sample’, we included workers having a paid job of ≥1 hours/week at baseline in the main analyses. To test whether results were sensitive to this cut-off point of 1 hour/week, we performed sensitivity analyses in which we excluded workers who worked ≤8 hours/week at baseline.
Ethical issues
Informed consent was obtained from all participants.
Results
Baseline characteristics
Table 1 shows baseline characteristics of all workers with a chronic disease and of those who initially had good and poor self-perceived health for the three cohorts separately. The average age varied between 58.8 years and 59.6 years across the three cohorts. All three cohorts included somewhat more men than women (54.6%–61.9% men). Educational level increased over time. In cohort 1992 and 2002, most workers had a low level of education, whereas in cohort 2012 workers, most workers had an intermediate level. The percentage of workers with a high level of education were 17.2, 28.7 and 35.2 for cohort 1992, 2002 and 2012, respectively. The percentage of workers having poor self-perceived health were, 46%, 46% and 49% for cohort 1992, 2002 and 2012, respectively.
Baseline characteristic of the workers with a chronic disease who initially have good and poor self-perceived health and the total group of the three cohorts separately
Working life expectancies
Total group of workers with a chronic disease
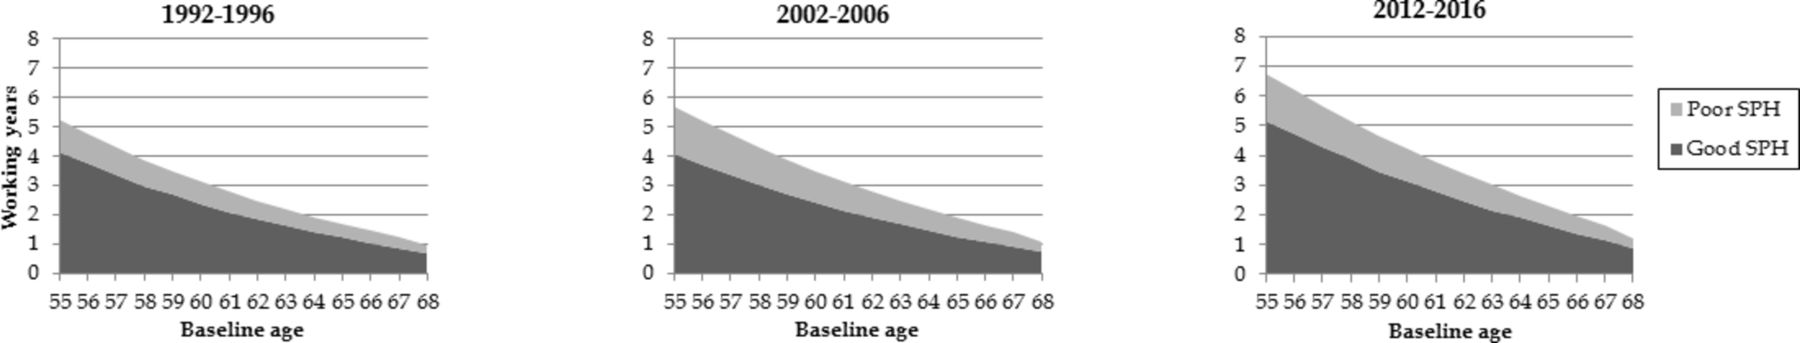
Among the total group of workers with a chronic disease, total WLE at age 55 years was 5.2 years in cohort 1992, 5.7 years in cohort 2002 and 6.8 years in cohort 2012 (table 2; figure 2). The increase between cohorts 1992 and 2002 was not significant, whereas the increase between cohort 2002 and 2012 was significant. Between cohort 1992 and cohort 2002, there was no difference in healthy WLE, but healthy WLE increased from 4.1 to 5.2 years between cohort 2002 and cohort 2012. Unhealthy WLE was 1.1 years in cohort 1992, 1.6 years in cohort 2002 and 1.6 years in cohort 2012. The increase in unhealthy WLE between cohorts 1992 and 2002 was not significant. Using a cut-off point of ≥8 hours/week instead of ≥1 hour/week did not lead to relevantly different results.

Working life expectancies (WLEs) for total group of workers with a chronic disease. SPH, self-perceived health.
Working life expectancy (WLE) of the workers with a chronic disease at age 55 years
Workers with chronic disease who initially had poor self-perceived health
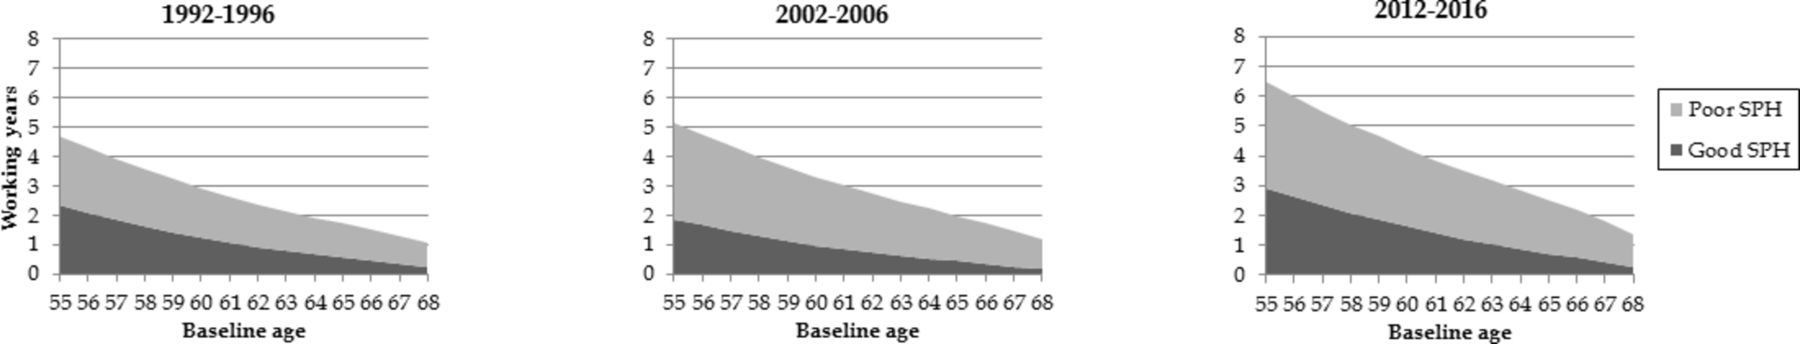
Among workers who initially had poor self-perceived health, total WLE at age 55 years was 4.7 years in cohort 1992, 5.2 years in cohort 2002 and 6.5 years in cohort 2012 (table 2; figure 3). The increase in total WLE between cohort 1992 and 2002 was not significant, whereas the increase between cohort 2002 and 2012 was significant. Healthy WLE decreased from 2.3 years in cohort 1992 to 1.9 years in cohort 2002, but this decrease was not significant. This decrease was followed by an increase to 2.9 years in cohort 2012. Unhealthy WLE increased from 2.4 years in cohort 1992 to 3.3 years in cohort 2002. Between cohort 2002 and cohort 2012, WLE increased to 3.6 years, but this increase was not significant. Using a cut-off point of ≥8 hours/week instead of ≥1 hour/week did not lead to relevantly different results.

Working life expectancies (WLEs) for workers with a chronic disease who initially have poor self-perceived health. SPH, self-perceived health.
Discussion
This study showed that successive generations of older workers with a chronic disease extended their working lives by about 18 months from 1992–1996 to 2012–2016. Workers who initially had poor self-perceived health extended their working lives by 21 months. In the first decade (period from measurement of cohort 1992 to measurement of cohort 2002), it was unhealthy WLE that increased, and in the second decade (period from measurement of cohort 2002 to measurement of cohort 2012), healthy WLE.
The finding that successive generations of workers with a chronic disease extended their working lives by about 18 months from 1992 to 2016 may be explained by the fact that in this period several measures were taken to encourage people to work longer and discourage early exit from the workforce.1 Also measures especially pertaining to workers with health problems may explain increasing WLEs of successive generations of workers.3 4 The increase in total WLE is in line with the increasing average age of leaving employment in the general population in the Netherlands, that is, from 60 years and 10 months in 2000 up to 64 years and 5 months in 2016 (figures before 2000 not available).18 However, also other societal developments may have contributed. To illustrate, in the Netherlands, there is a general increase in educational level,19 which allows people to have an higher occupational class. Higher occupational class is associated with less hazardous physical working conditions and higher job control.20 This may have enabled workers to continue working until higher ages. Policies aiming at prolonged working indeed seem to have influenced total WLE of both chronically ill workers who initially have good or poor self-perceived health. Our findings challenge the existing belief that workers with chronic diseases may not be able to prolong their working lives. It should, however, be noted that the study sample was a healthy selection of the total population with chronic diseases, that is, a healthy worker effect.21 The workers in our study sample succeeded in continuing their working careers to the age of 55 years and beyond, whereas more vulnerable workers with a chronic disease may already have left employment before this age.
Remarkably, the unhealthy WLE increased in the first decade (among workers who initially had poor self-perceived health), whereas the healthy WLE increased in the second decade (both among workers who initially had good or poor self-perceived health). This may indicate that the different measures to encourage prolonged working that were taken over time had different implications for healthy and unhealthy WLE. The measures that were taken in 2002 were meant to encourage rapid return to work among workers on sick leave.3 22 Considering our results, these new regulations seem to have facilitated prolonged working among workers with a chronic disease who perceive their health as poor. Subsequently, the stricter qualification criteria to enter disability pension that were adopted in 2006 seem to have stimulated prolonged working among workers with a chronic disease who actually felt healthy.3 4 It might also indicate that in the 1990s, there was still potential for growth in unhealthy WLE, which was no longer present in the second decade. Another explanation may be the increase in educational level throughout the three cohorts. It may be hypothesised that workers with a higher educational level are less likely to continue working while feeling unhealthy than workers with a lower educational level as they are more likely to have the financial possibility to quit working, that is, because of higher earnings. The financial possibility to retire early indeed has been shown to contribute to early retirement.23 A final explanation might be that successive generations of workers with a chronic disease, over time, may attach less importance to the presence of this chronic disease in their assessment of self-perceived health. This is supported by a previous study that showed that between 1992 and 2009 poor self-perceived health is determined less by chronic diseases and more by severe disability.24
Strengths and limitations
In this study, we applied an innovative method among older workers with a chronic disease. The LASA sample is based on a representative sample of the Dutch older population, including a representative sample of the older working population. A limitation of this study is the small sample size. However, attrition rate was low. Because of the small sample size, we were not able to correct for confounders or compare subgroups based on, for example, sex and educational level. This would have resulted in statistical power issues. Furthermore, due to the small sample size, we were not able to assess to what extent WLEs were sensitive to the categories used to define poor self-perceived health. A second limitation is that all data relied on self-reports. With regard to chronic diseases, it is not sure whether employees indeed were diagnosed with these chronic diseases and whether all diagnosed diseases were reported. Another issue is the temporal resolution of assessing self-perceived health that is different from the temporal resolution of assessing exit from work, that is, once in 3 years and monthly, respectively. However, since self-perceived health has been shown to be a relatively stable health measure, at least over a period of 1–3 years,25 26 we do not expect bias because of this. A final limitation is that exit from work was an absorbing state in our model, while in practice people may re-enter the workforce after an initial exit. However, in our study, only 3.6% of the non-workers with a chronic disease at the first measurement cycle had re-entered the workforce at the second measurement cycle. Therefore we do not expect major bias from this.
Implications for workers, employers and society
The overall increase in total WLE of workers with a chronic disease without an increase in unhealthy WLE in the second decade could imply that this group became well able and supported to prolong their working lives. On the other hand, it could also imply that this group feels forced to work longer, with potentially negative consequences for their productivity.10 Now that working (longer) with health problems becomes more common, it becomes increasingly important that employers support these workers to prolong their working lives. They may have specific needs with regards to prolonged working. To illustrate, a study showed that workers with chronic diseases benefited more from psychosocial resources at work, such as social support and autonomy, than workers without chronic diseases.27
Furthermore, healthy and unhealthy WLE may be used as an indicator to monitor the health of the working population. It may be used as an additional criterion for success of policies aiming to prolong people’s working lives, in addition to figures regarding the average age of leaving employment. This would connect policies aiming at prolonged working and ambitions related to successful ageing. After all, successful ageing does not only involve sustained engagement in social and productive activities in society, but also avoidance of disease and disabling conditions.28 29 Governments may commit themselves to promoting health of older workers by introducing the healthy and unhealthy WLE indicator, setting targets, and to collect data needed to monitor these targets. Future research could focus on healthy and unhealthy WLE of vulnerable groups in the labour market, for example, workers with low socioeconomic position and workers in flexible jobs, as well as developments over time. Thus, it can be monitored what the consequences of social policies are for the healthy and unhealthy WLEs of different groups in the labour market.
Conclusion
Total WLE of successive generations of workers with a chronic disease increased by approximately 18 months between 1992 and 2016. Remarkably, in the first decade, unhealthy WLE increased, whereas in the second decade, healthy WLE increased. Now that working longer with health problems becomes more common it becomes increasingly important to enable this group to continue working sustainably. Healthy and unhealthy WLE may be valuable information in the future debate on prolonged working of vulnerable groups in the labour market.
References
Footnotes
Contributors Design of the study: all authors. Analyses: AdW and MvdN. Drafting the manuscript: all authors. Critical revisions: all authors. Final approval: all authors.
Funding Funding for this study has been obtained from Network for Studies on Pensions, Aging and Retirement (Netspar).
Competing interests None declared.
Patient consent Not required.
Ethics approval The VU University Medical Center medical ethical committee approved the LASA study.
Provenance and peer review Not commissioned; externally peer reviewed.
Data sharing statement Data that were used for the present study are available on request (http://lasa-vu.nl/index.htm).