Article Text

Abstract
Objectives To examine exposure–response relationships between surrogates of firefighting exposure and select outcomes among previously studied US career firefighters.
Methods Eight cancer and four non-cancer outcomes were examined using conditional logistic regression. Incidence density sampling was used to match each case to 200 controls on attained age. Days accrued in firefighting assignments (exposed-days), run totals (fire-runs) and run times (fire-hours) were used as exposure surrogates. HRs comparing 75th and 25th centiles of lagged cumulative exposures were calculated using loglinear, linear, log-quadratic, power and restricted cubic spline general relative risk models. Piecewise constant models were used to examine risk differences by time since exposure, age at exposure and calendar period.
Results Among 19 309 male firefighters eligible for the study, there were 1333 cancer deaths and 2609 cancer incidence cases. Significant positive associations between fire-hours and lung cancer mortality and incidence were evident. A similar relation between leukaemia mortality and fire-runs was also found. The lung cancer associations were nearly linear in cumulative exposure, while the association with leukaemia mortality was attenuated at higher exposure levels and greater for recent exposures. Significant negative associations were evident for the exposure surrogates and colorectal and prostate cancers, suggesting a healthy worker survivor effect possibly enhanced by medical screening.
Conclusions Lung cancer and leukaemia mortality risks were modestly increasing with firefighter exposures. These findings add to evidence of a causal association between firefighting and cancer. Nevertheless, small effects merit cautious interpretation. We plan to continue to follow the occurrence of disease and injury in this cohort.
Statistics from Altmetric.com
What this paper adds
The study addresses limitations in previous research regarding exposure–response relationships by conducting internal analyses of disease rates among career firefighters in a large pooled cohort.
Comprised of almost 20 000 career firefighters with over 1300 cancer-related deaths and 2600 cancer incidence cases, this study is among the largest assembled for the purpose of firefighter research and is the first with adequate statistical power for detailed examinations of exposure–response characteristics.
Using department records, we derived three surrogates of exposure based on firefighter assignments and fire-run information. This is the first study to relate the time elapsed during fire-runs to cancer risk.
We found previously unreported modest exposure–responses for lung cancer and leukaemia mortality. These findings add to evidence of a causal association between firefighting exposures and cancer.
Introduction
Firefighting has long been recognised as a high-risk profession relative to other occupations. A wide array of workplace hazards presents a serious threat of acute injury in the line of duty; therefore, much has been done by the fire service to characterise and mitigate this threat. In contrast, far less is known about latent chronic illnesses that may also be a consequence of firefighting. In particular, it is widely accepted that firefighters are potentially exposed to a number of known or suspected human carcinogens; yet the risk of cancer in the fire service is still poorly understood.
In its recent assessment of the literature, a working group of the International Agency for Research on Cancer (IARC) concluded that there was limited evidence for the carcinogenicity of exposures to firefighters.1 Among 42 studies reviewed by IARC, there were 14 municipal firefighter cohort studies that evaluated cancer mortality and five that assessed cancer incidence (some with multiple reports). IARC's determination was based largely on these studies; however, only two2 ,3 included 500 or more cancer cases and eight4–11 reported fewer than 100 cases. Given small numbers of total cancers, analysis of specific cancers was limited. Most studies also lacked information on the relationship between firefighter exposures and cancer risks. Small study size, short length of follow-up, and lack of exposure–response information may have contributed to inconsistent findings and equivocal evidence of firefighting exposure carcinogenicity.1 Yet, despite these limitations, there were reports of modestly increased brain,8 ,12–14 digestive tract,2 ,8 ,13 ,15 genitourinary tract3 ,7 ,13 ,16 ,17 and lymphohematopoietic2 ,6 ,14 cancers among firefighters in these studies, suggesting that additional research may improve our understanding of firefighter cancer risk.
To address previous limitations, recent studies have pooled information from multiple firefighting organisations for improved study power.18 ,19 Daniels et al18 examined mortality and cancer incidence in a pooled cohort of about 30 000 US career firefighters followed from 1950 to 2009 and found modestly increased all-cancer risk compared with the general population. The excess risk was attributed to several cancer sites, including malignancies of the respiratory, digestive and urinary systems. In concert with the US study, Pukkala et al19 reported excess all-cancer incidence in a pooled study with 45 years of follow-up of about 16 000 firefighters from five Nordic countries. Among specific cancers assessed in the Nordic study, modest but statistically significant excess risk was observed for lung adenocarcinoma, melanoma of the skin and prostate cancer. Although both studies contributed additional evidence of increased firefighter cancer risk, neither study integrated exposure information into the epidemiological analyses.20
The current study continues to examine cancer in the previously assembled US multicenter cohort of career firefighters. We present findings from internal comparisons of this cohort that examine the exposure–response relation between select outcomes of interest and three surrogates of exposure. Our purpose is to clarify the relationship between occupational exposures and cancer risk, which would benefit future cancer prevention methods and ultimately reduce cancer among firefighters.
Methods
Study cohort
The details on the cohort and case ascertainment are described elsewhere.18 Briefly, the cohort is comprised of all career firefighters from fire departments in Chicago (CFD), Philadelphia (PFD) and San Francisco (SFFD), who were on active duty at least 1 day between the years 1950 and 2009. To normalise the exposure time scale and limit information bias, eligibility for the current analysis was restricted to males of known race who were first hired on or after 1 January 1950. To account for differences in health status of short-term workers, eligibility was further limited to firefighters who were employed for one or more years. Mortality case status was defined by the underlying cause of death. Incidence cases were defined as the first occurring primary invasive cancer or in situ bladder cancer among firefighters matched to at least 1 of 11 state registries (ie, Arizona, California, Florida, Illinois Indiana, Michigan, Nevada, New Jersey, Oregon, Pennsylvania and Washington). Based on mortality data, these states provided about 95% coverage. For mortality analyses, the at-risk period began on the date of hire +1 year and ended the earliest of the date of death (DOD), the date last observed (DLO), or study end (31 December 2009). The at-risk period for cancer incidence began on the later of hire date +1 year or 1 January of the year in which the cancer registry in the state of the respective fire department achieved statewide ascertainment. (ie, California, 1988; Illinois, 1986; and Pennsylvania, 1985) and ended on the earliest of date of first primary cancer diagnosis, DOD, DLO or study end.
Cancers were selected from the list of outcomes of a priori interest in the previous study that had 50 or more cases in the restricted cohort. Selected outcomes included: all-cancers; bladder, colorectal, oesophageal, lung, and prostate cancers; leukaemia; and non-Hodgkin's lymphoma (NHL). A sufficient number of cases were available to examine mortality and cancer incidence in all outcomes except bladder cancer, in which only incidence was evaluated. Mortality from chronic obstructive pulmonary disease (COPD), ischaemic heart disease (IHD), cerebrovascular disease (CeVD) and alcohol-related cirrhosis were also included to help elucidate effects from lifestyle-related risk factors. A complete description of the outcomes and their associated codes from Revision 10 of the International Classification of Diseases are shown in web appendix table S1.
Exposure
Job exposures matrices were used to derive surrogate variables of exposure based on combinations of job, location and firefighting apparatus assignments. All matrices were constructed by an industrial hygienist blinded to case status and each matrix was vetted by staff at participating fire departments. Data availability varied between departments; therefore, three exposure metrics or ‘scores’ were explored. First, the number of days worked in a job or location that had a potential for occupational exposure (exposed-days) was calculated using combinations of job title and location assignments. For example, days accumulated as a firefighter assigned to a fire station or fire apparatus were ‘exposed’, whereas days worked while assigned to headquarters as administrative support were not exposed. Employment information was sufficient to calculate exposed-days for participating firefighters from all three fire departments. A second exposure score used firefighter apparatus assignments and annual fire-run information to estimate the total number of fire-runs made by each firefighter based on three-shift operations (fire-runs). A ‘run’ is any response to a call that deployed the apparatus. Data were available to calculate fire-runs for PFD and CFD firefighters. CFD apparatus records also included the amount of time the apparatus was deployed into the field. For the third metric, deployment time was assumed equivalent to time at fires. These data, in conjunction with firefighter apparatus assignments, were used to estimate the total time spent at fires (fire-hours) by each CFD firefighter.
Data on apparatus deployment were incomplete for certain combinations of apparatus and years and were unavailable prior to the mid 1950's. Missing values were estimated by interpolation using trends of the two 5-year periods adjacent to the missing value. In the absence of 5 years of adjacent data, the average of the closest 5-year time period was used.
For each firefighter and eligible exposure metric, cumulative exposure scores were calculated by summing interval values from age at first exposure to attained age minus the exposure lag period. A 10-year lag was used for all outcomes except lymphohematopoietic cancers, which used a 5-year lag.
Statistical methods
All statistical analyses were conducted using SAS software.21 For each selected outcome, risk sets were drawn from the study cohort using incidence density matching on attained age of the case.22 General relative risk models were developed using methods analogous to conditional logistic regression based on sampled risk sets comprised of 200 controls per case. These methods are an extension of the Cox proportional hazards model.23 ,24 The general model form is: HR=H(D1)/H(D0) and H(Di)=f(Di)exp(θTZ), where the HR is the ratio of the hazard rate at a specified dose D1 to the rate at the reference dose, D0. The hazard rate H(D) is the product of the dose function, f(D) and the exponentiated product of the p-dimensional covariate vector Z=(Z1,…, Zp) and transposed p-dimensional model covariate parameter, θ=(θ1,…, θp).
The initial approach (Model I, ‘loglinear’) assumed f(D)=exp(βD) where β is the estimated model parameter for the main exposure D. Other model forms were examined, including: 1+βD (Model II ‘linear’), (1+D)β (Model III, ‘power’) and exp(β1D+β2D2)(Model IV, ‘log-quadratic’). The shape of the dose–response was further examined using restricted cubic splines (RCS) with three knots at the 10th, 50th and 90th centiles of the exposure distribution among risk sets (Models V). All models controlled for race (Caucasian, other), fire department and birth cohort. Risk heterogeneity by fire department was examined by likelihood ratio test (LRT). Birth cohort effects were estimated using continuous variables constructed from terms calculated by RCS with three knots at the 10th, 50th, and 90th centiles of birth date.25 Among groups of models, the preferred model was selected based on the minimum Akaike Information Criterion (AIC).26 Model estimates included profile likelihood-based (PL-based) two-sided 95% CIs. In linear models, CI estimates were not calculable (NC) when the estimate was on the boundary of the parameter space.
Modelling was conducted for each outcome and exposure surrogate combination. To normalise scales across exposure scores in main analyses, HR values were reported at the 75th centile of exposure compared with the 25th centile exposure, each rounded to the nearest 100 units (HR75:25). An exposed reference point was chosen because few career firefighters in our study were unexposed. Using an exposed referent also counters extreme changes in the slope of the exposure–response curve at very low doses that is a characteristic of power models.27
Time since exposure (TSE), age at exposure (AE) and exposure period (EP) were examined by piecewise constant loglinear models that divided cumulative exposure into time windows.28 TSE was defined as the time prior to reaching attained age, which was separated into three windows (lag to<lag+20, lag+20 to <lag+30, ≥lag+30 years). Two exposure windows were used for AE (<40, 40+ years) and EP (<1970, 1970+). Temporal effect modification was evaluated by LRT comparing the main analysis with one exposure parameter (base model) to models incorporating multiple exposure windows. Temporal analyses calculated HRs in each exposure-window of 4600 fire-runs using a null exposure referent.
Results
There were 19 309 male firefighters under study (table 1). These firefighters were mostly Caucasian (78%) and had an average age at hire and employment period of about 28 and 21 years, respectively. About 79% of the cohort was still alive at end of follow-up.
Characteristics of the cohort and exposures by fire department and combined (1950–2009)
There were approximately 16 000 combinations of fire department, apparatus and year used to develop fire-runs and fire-hours for each firefighter. Employment histories were complete for exposed-days calculations; however, interpolation was necessary for about 20% of the apparatus data. The average career cumulative exposures were about 5700 exposed-days (all departments), 6000 fire-runs (CFD and PFD only), and 1500 fire-hours (CFD only). These exposure scores were correlated, with highest agreement between fire-runs and fire-hours (Pearson coefficient=0.92, p<0.001), followed by fire-hours and exposed-days (Pearson coefficient=0.85, p<0.001) and fire-runs and exposed-days (Pearson coefficient=0.82, p<0.001). Poorer correlations existed between unadjusted employment duration and fire-hours (Pearson coefficient=0.60, p<0.001), fire-runs (Pearson coefficient=0.67, p<0.001) and exposed-days (Pearson coefficient=0.77, p<0.001). Inspection of histograms revealed similar right-skewed exposure distributions among exposure scores; however, these distributions differed greatly from that for cumulative days worked. Approximately 6% of cohort members (mostly paramedics) were not exposed during the observation period. Excluding these persons from risk analyses did not appreciably change findings (results not shown).
Table 2 shows the results of the main analyses. There were 1333 decedents with cancer as the underlying cause and 2609 cancer incidence cases available for analysis. In general, results between mortality and cancer incidence were reasonably consistent; however, statistical significance was most often achieved in mortality analyses. Similar risk estimates and overlapping CIs were also evident across exposure scores. Risk heterogeneity between fire departments was evident in the relation between fire-runs and lung cancer mortality (LRT p=0.002) and incidence (LRT p=0.026). There was little evidence of an exposure–response for all cancers combined (eg, fire-runs HR75:25=0.95, 95% CI 0.89 to 1.01) or in most separate malignancies, except for cancers of the lung, colorectal sites, prostate and leukaemia.
HRs and 95% CIs by exposure surrogate*
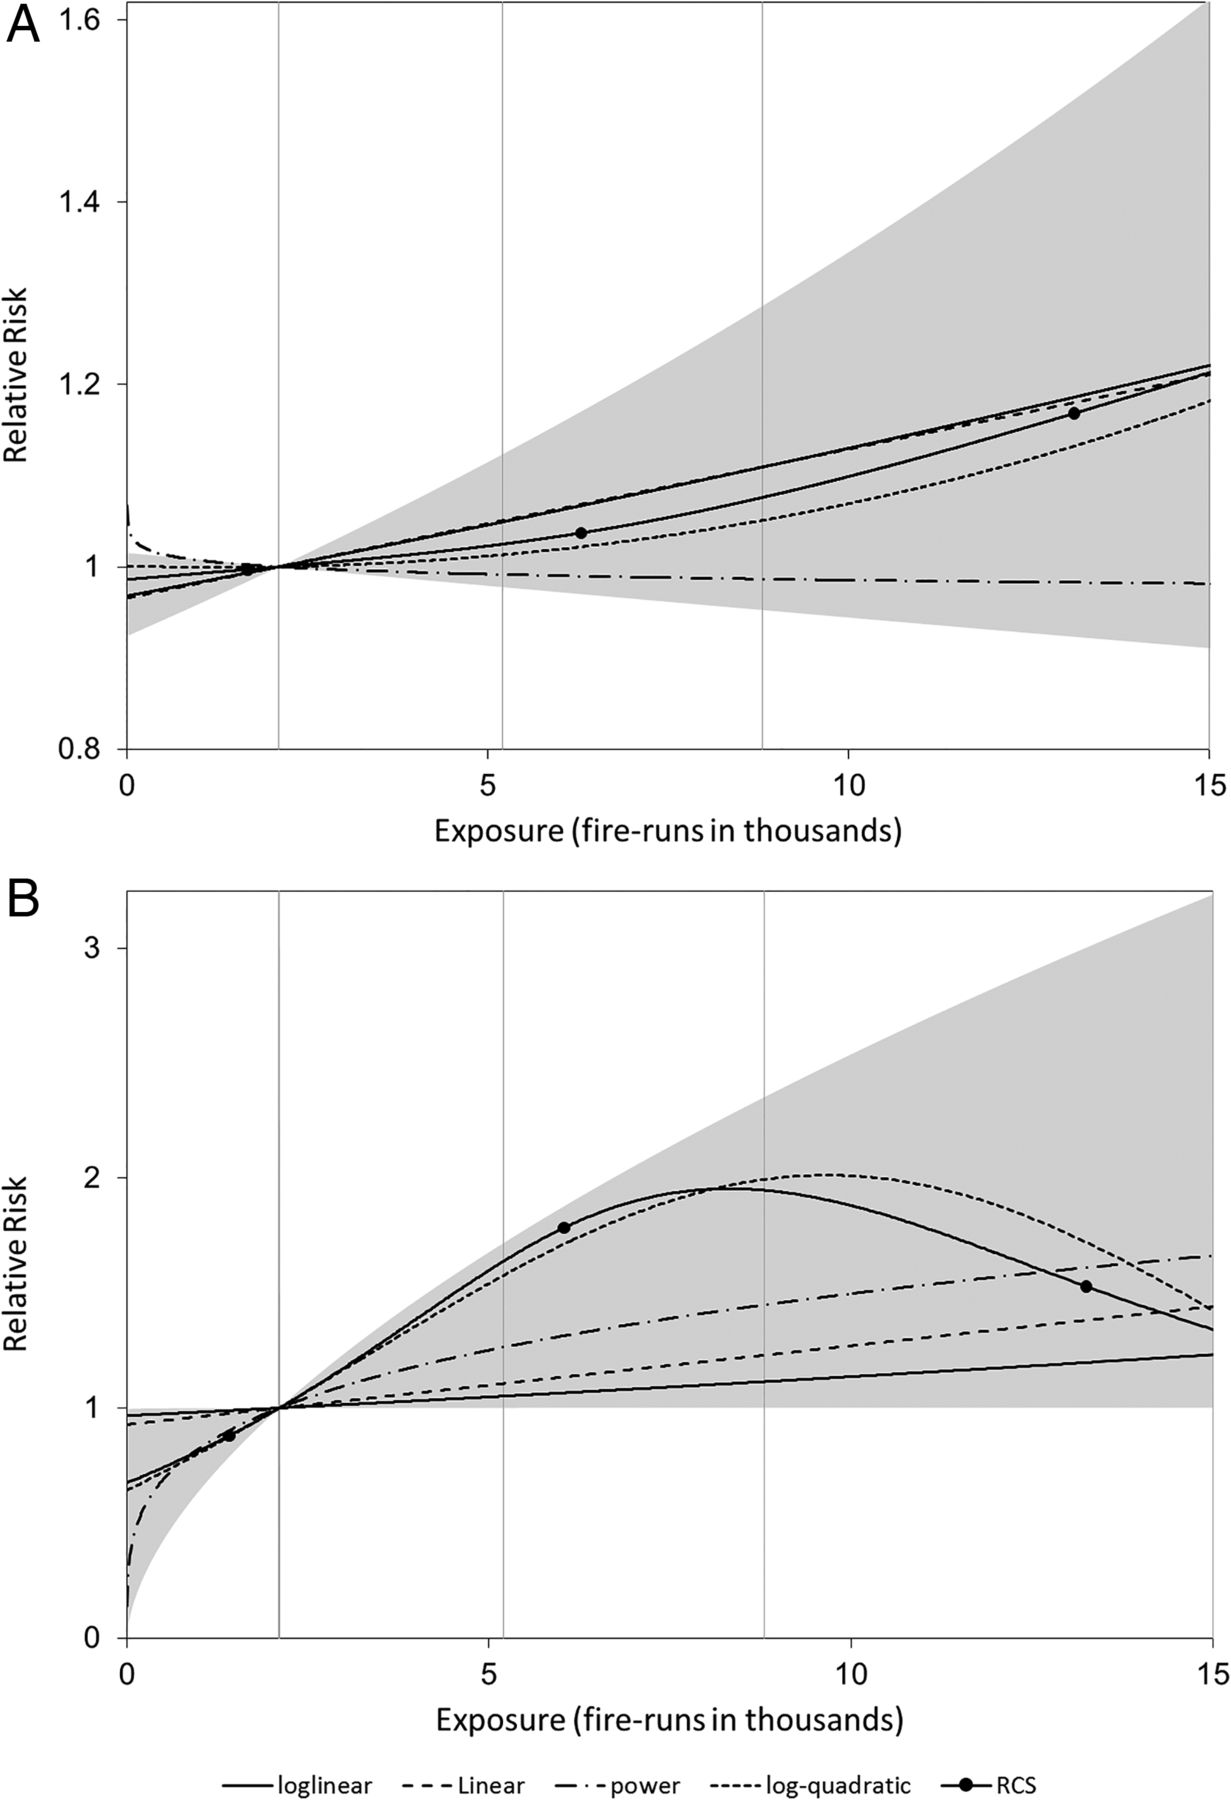
Modestly but monotonically increasing lung cancer and leukaemia mortality risk was apparent. Lung cancer mortality increased with career fire-runs (HR75:25=1.11, 95% CI 0.95 to 1.29) and fire-hours (HR75:25=1.39, 95% CI 1.12 to 1.73), with differences mostly attributed to increased risk among CFD firefighters (eg, CFD fire-runs HR75:25=1.22, 95% CI 1.04 to 1.42) compared with PFD firefighters (eg, PFD fire-runs HR75:25=0.68, 95% CI 0.47 to 0.97). Similar associations were observed in lung cancer incidence analyses (fire-runs HR75:25=1.10, 95% CI 0.94 to 1.28; fire-hours HR75:25=1.39, 95% CI 1.10 to 1.74). The best fitted lung cancer models were consistently loglinear, although there was little difference in AIC values (<1.0) when comparing loglinear and linear forms. The HR for the relation between leukaemia mortality and fire-runs was marginally statistically significant (HR75:25=1.45, 95% CI 1.00 to 2.35). Leukaemia mortality HR estimates were reasonably consistent across all exposure scores; however, results for mortality and incidence end points did not agree. Model III was preferred in most leukaemia analyses, suggesting a nonlinear exposure–response relationship with risk attenuation at higher exposures. The exposure–response relationships between fire-runs and mortality from lung cancer and leukaemia are shown in figure 1.

Relative risk of lung cancer (A) and leukaemia (B) mortality by career fire-runs. Models indicated by: solid line, loglinear; long dashed line, linear; short dashed line, log-quadratic; long dash followed by two dots, power; solid line with filled circles, RCS with knots indicated by filled circles. Vertical lines indicate 25th, 50th and 75th centiles of exposure. Plot truncated at the 95th centile. The shaded area shows the 95% CI for the preferred model (loglinear for lung cancer and power for leukaemia). RCS, restricted cubic splines.
There was evidence of significantly decreasing mortality risk with exposure in colorectal (eg, fire-run HR75:25=0.58, 95% CI 0.42 to 0.80) and prostate cancers (eg, fire-runs HR75:25=0.71, 95% CI NC to 0.90).The negative response was strongest for colorectal cancer, with comparable statistically significant HRs observed across exposure scores (exposed-days HR75:25=0.65, 95% CI 0.46 to 0.95; fire-hours HR75:25=0.63, 95% CI NC to 0.93). The inverse relation for colorectal cancer persisted in incidence analyses but was weakened (eg, fire-runs HR75:25=0.89, 95% CI 0.72 to 1.09). There was no evidence of an exposure–response for prostate cancer incidence (eg, fire-runs HR75:25=1.02, 95% CI 0.91 to 1.14). Among non-malignant diseases, IHD and cirrhosis also appeared inversely related to exposure; each had HRs less than unity across exposure scores.
The results for other non-malignant diseases were inconsistent. For COPD, the HR was elevated for fire-hours (HR75:25=1.47, 95% CI 0.86 to 2.59), which was limited to CFD firefighters, but there was little evidence of a relation between exposed-days (HR75:25=0.83, 95% CI 0.59 to 1.19) or fire-runs (HR75:25=0.93, 95% CI 0.73 to 1.26). The HR for CeVD was also slightly elevated for fire-runs (HR75:25=1.18, 95% CI 0.75 to 1.89) but not in other exposure scores, although CIs overlapped and included unity.
The results of temporal analyses of mortality outcomes are presented in table 3 and in web appendix tables S2 and S3. None of the alternate models differed significantly from the base model. There was some evidence of attenuated leukaemia mortality risk corresponding to exposures 25 or more years prior to attained age (LRT p=0.123). An opposite effect was observed for IHD, in which risk appeared greatest for exposures 30 year prior to attained age (LRT p=0.120) or prior to 1970 (LRT p=0.150). In contrast, NHL mortality risk was greatest for exposures occurring in 1970 or later (LRT p=0.157). Finally, there was evidence that exposures after age 40 were more strongly related to lung cancer mortality than exposures occurring at earlier ages (LRT p=0.194).
HRs at 4600 fire-runs for temporal factors*
Discussion
The major limitation of most previous studies is a lack of integrating firefighter exposures in risk assessment.1 Simple external comparisons have been conducted most of the time for practical reasons due to small cohort sizes and a lack of exposure data. In studies that examined exposure–response relationships,2 ,6–8 ,10–13 ,15 ,17 ,18 most report standardised mortality ratios for categories of employment duration and few examined cancer incidence.8 ,10 ,11 ,17 These studies have failed to provide convincing evidence of a relation between cancer and occupational exposures encountered in firefighting. The current study draws from the largest group assembled for examining cancer mortality and incidence among firefighters and integrates additional information to derive exposure estimates suitable for use in general relative risk regression models. Using three surrogates of exposure, we examined the relation between firefighter exposure and several cancer outcomes and found evidence of monotonically increasing risk of lung cancer and leukaemia with exposure.
Previous studies of firefighters have generally lacked evidence of excess lung cancer or leukaemia. In a recent meta-analysis reviewing 32 studies, increased risk from firefighting was deemed ‘possible’ for leukaemia based on the synthesis of eight studies and ‘unlikely’ for lung cancer based on 19 studies.29 Summary relative risk estimates from random effects models did not statistically differ from unity for either outcome. Nevertheless, a few studies have reported increased lung cancer or leukaemia risks among groups of firefighters. Among cohort studies reviewed by IARC, one reported excess lung cancer risk among firefighters 65 years or older6 and another found significant excess lung cancer mortality among firefighters with 35 or more years of service.7 Recently, Pukkala et al19 reported increased lung adenocarcinoma incidence primarily among firefighters aged 70 or above. Three mortality studies reported significant leukaemia risk in groups of firefighters; two reporting findings among firefighters with 30 or more years of service6 ,14 and another reporting excess risk among Philadelphia firefighters assigned to ladder companies.2 The latter study, which overlaps our study, also reported patterns of increasing leukaemia risk with increasing cumulative number of runs. In all three leukaemia studies, analyses were based on 15 deaths or less. The elusiveness of an association between lung cancer and firefighter exposures is intriguing given that most studies included lung cancer as an outcome of interest, case numbers tended to be sufficient for statistical analyses, and an association is plausible because of the large number of known lung carcinogens (eg, arsenic, asbestos, benzo[a]pyrene and cadmium) in inhaled smoke. Far less information is available on rare diseases such as leukaemia given a lack of studies with adequate sample size, although a causal link between firefighting and leukaemia is also plausible given the potential presence of known leukaemogens such as benzene, 1,3-butadiene and formaldehyde.1
Lung cancer had comparable results in incidence and mortality analyses and among models using fire-runs and fire-hours exposure scores. Best fitted models were loglinear, although there was little difference in model fit or point estimates between loglinear and linear model forms. We observed that CFD firefighters had greater lung cancer risk per unit exposure than others in the study. This pattern of risk was also evident in previous external comparisons.18 The cause of interdepartmental heterogeneity in lung cancer is unclear; but the observation suggests there are differences in exposures or other risk factors (eg, smoking habits) across departments that may be unaccounted for in the current analyses.
Given fewer cases, point estimates for leukaemia mortality were less precise than lung cancer; however, leukaemia mortality often yielded higher estimates of risk per unit exposure and risk estimates were similar across exposure scores. There was little evidence of significant risk differences among fire departments, which is consistent with leukaemia having fewer risk factors that could have confounded results. Interestingly, recent exposures (within 5–25 years of attained age) appeared more strongly related to increased leukaemia risk than distant ones. This finding is consistent with previous studies reporting similar temporal trends in risk for leukaemogens such as ionising radiation30–32 and benzene.33–35 Nonlinear exposure-responses were also preferred in leukaemia analyses, suggesting an increasing slope at low or very low exposures followed by attenuated risk at higher exposures. This phenomenon is common to many occupational studies, with posited causes such as biological saturation, exposure misclassification, the influence of other risk factors, a healthy worker survivor effect (HWSE), and depletion of the susceptible population.36 ,37 The first four causes seem less likely to explain our findings given that protracted and fractionated low-dose exposures are not conducive to biological saturation; inspection of exposure distributions yielded no evidence of low exposure underestimation or high exposure overestimation; leukaemia has few risk factors, and the short latency period would tend to reduce a HWSE. The last cause suggests that positive associations between exposure and certain leukaemia subtypes are restricted to a small subset of persons with a genetic predisposition to exposure-related disease.38 Under this hypothesis, leukaemia may be induced in the susceptible fraction of workers shortly following sufficient exposure while those resistant to the disease continue to work and accrue exposure. This phenomenon, which elegantly explains the observed pattern of risk attenuation with TSE and with increasing exposure, remains unproven. Future analyses that examine risk differences in leukaemia subtypes may help clarify findings.
Some outcomes had negative or attenuated exposure–responses that may have resulted from a HWSE. A HWSE stems from workers leaving employment prematurely due to ill-health. This process can lead to attenuated exposure–response relationships when the measure of interest is conditional on employment status. The effect is stronger in debilitating diseases that present at working ages or are preceded by and related to unhealthy lifestyles or comorbidities that also lessen the ability to work (eg, colorectal cancer, cirrhosis and IHD). Interestingly, attenuated risk patterns were less apparent for some cancers, which is consistent with a reduced HWSE in diseases occurring later in life. Nevertheless, negative exposure–responses were evident in relative risk models of colorectal and prostate cancer mortality. Both cancers have relatively high survival and are more likely to be diagnosed early following routine medical screening.39–41 Early diagnosis, followed by lengthy treatment-induced work restrictions, may have contributed to a HWSE in mortality analyses. Furthermore, risk-factors for colorectal cancers include inflammatory bowel disease, obesity and a sedentary lifestyle, all of which may be related to employment limitations.40 Future examinations of the exposure–response relations between colorectal and prostate cancers and firefighters exposure should include information on other important risk factors that may confound results and include improved methods to counter a potential HWSE.
There was reasonable agreement between mortality and incidence analyses except for leukaemia and cancers with a negative gradient of mortality exposure–response (ie, colorectal and prostate cancers). The latter cases may reflect differences in a HWSE, given that exposures may cease at cancer diagnosis, which can precede death by several years. As a possible explanation for differences in leukaemia mortality and incidence, we observe that mortality ascertainment and exposure began together in 1950, but cancer incidence data were not available until the mid-1980s. A number of exposure-related leukaemias may have been missed in incidence analysis given a long period of employment prior to the observation period and the relatively short latency of some leukaemia subtypes. This can affect the distribution of leukaemia subtypes that comprise leukaemia incidence cases, which differ by age at onset, latency, prognosis, exposure–response and other factors.42 For example, chronic lymphocytic leukaemia comprised 32% of incidence cases but only 17% of deaths. Restricting incidence analyses to more recent hires may counter these effects; however only eight (14%) leukaemia cases were first hired on or after 1980. Continued follow-up and expansion of the cohort would improve incidence analyses.
In the absence of direct information, we assessed the potential of confounding by lifestyle factors by examining patterns of diseases strongly related to smoking and alcohol use. An inverse association between exposure and cirrhosis was observed, suggesting a low potential for positive confounding by alcohol consumption. Likewise, exposure–response results for some smoking-related outcomes (eg, bladder cancer and IHD) contradicted positive confounding of lung cancer results. In contrast, COPD and lung cancer results were similar in CFD-based run-hours analyses but not in other analyses. COPD results are difficult to interpret given that firefighter exposure may also be a risk factor.43 ,44 Although confounding by smoking cannot be ruled out in this study, the inconsistencies in results among smoking-related diseases suggests that a strong bias in either direction is unlikely.
Previous studies have used exposure measures similar to exposed-days6 ,7 ,14 ,17 and fire-runs;2 ,8 however, this is the first to use fire-hours (run-hours) in exposure-response analyses. An investigation of firefighter exposure measures has suggested that fire-hours, followed by fire-runs, are likely to best correlate with actual firefighter exposures, with exposed-days considered the least preferred metric.45 In our study, fire-runs appeared to perform best in most models; however, actual performance is difficult to gauge given that the availability of each measure varied by fire department and direct exposure information was not available for validation. Run-based scores included responses unrelated to exposure (eg, false alarms) and none of our measures accounted for differences in firefighting strategies and personal protective equipment usage that can affect exposures. Thus, our exposure scores are still crude surrogates that may poorly characterise individual firefighter exposures. Furthermore, in the absence of complete employment histories, we cannot rule out the possibility that occupational exposures accrued during employment outside of the fire service may have distorted risk estimates. The integration of additional information to fill gaps and better specify exposure potentials over time may reduce exposure misclassification. Data on department-specific factors, such as employment policies, type of fires, building materials, firefighting tactics, and the use of personal protective equipment would likely improve exposure estimates.
Conclusion
Among eight types of cancers examined, we found slight, but statistically significant positive exposure–responses for lung cancer and leukaemia risk. Near linear and comparable exposure–response curves were evident for lung cancer mortality and incidence; however, the leukaemia findings were limited to mortality analyses and the exposure–response was attenuated at higher exposures. This study is the first to integrate exposure information into general relative risk models examining the relation between cumulative firefighter exposure and several cancers of interest. These findings contribute to the evidence of a causal association between firefighting exposures and cancer. Nevertheless, the relatively small effects observed in this study merit cautious interpretation given increased susceptibility to potential biases that may be present. Future studies that continue to explore these findings in this and other cohorts will improve our understanding of cancer risks in the fire service.
Acknowledgments
This study benefited from the continued cooperation of the men and women serving the Chicago, Philadelphia and San Francisco fire departments. They also acknowledge NIOSH staff and their contractors for contributing to the collection, coding, and management of study data.
References
Supplementary materials
Supplementary Data
This web only file has been produced by the BMJ Publishing Group from an electronic file supplied by the author(s) and has not been edited for content.
Files in this Data Supplement:
- Data supplement 1 - Online tables
Footnotes
Contributors RDD participated in design, data collection, analysis and manuscript development. SB participated in design and analysis. MMD participated in design, data collection and analysis. JHY, TLK, TRH, DB, SHZ, JJB and KMW participated in design and data collection. LEP provided critical appraisal. All authors participated in the interpretation and presentation of results and have read and approved the final manuscript.
Funding Research funding was provided by the National Institute for Occupational Safety and Health (NIOSH) by intramural award under the National Occupational Research Agenda (NORA), and by the US Fire Administration (USFA). This research was also supported in part by the intramural research programme of the National Institutes of Health (NIH), National Cancer Institute (NCI).
Competing interests None.
Ethics approval This research was approved by the Institutional Review Boards of the National Institute for Occupational Safety and Health (NIOSH) and the National Cancer Institute (NCI). Approvals for cancer registry access were granted by 11 states (ie, Arizona, California, Florida, Illinois, Indiana, Michigan, Nevada, New Jersey, Oregon, Pennsylvania and Washington). Approvals were also granted by vital records centres for death certificates maintained in 25 states (Alaska, Arizona, Arkansas, California, Florida, Georgia, Hawaii, Idaho, Illinois, Indiana, Iowa, Massachusetts, Michigan, Minnesota, Mississippi, New Jersey, New York, Ohio, Oklahoma, Oregon, Pennsylvania, Texas, Virginia, Washington and Wisconsin). The state public health entities provided vital status information in accordance with state policies and disclaim responsibility for any analyses, interpretations or conclusions.
Provenance and peer review Not commissioned; externally peer reviewed.
Data sharing statement Data were supplied by the Illinois Department of Public Health and the Bureau of Health Statistics & Research, Pennsylvania Department of Health. These public health entities specifically disclaim responsibility for any analyses, interpretations, or conclusions. The Florida cancer incidence data used in this report were collected by the Florida Cancer Data System (FCDS) under contract with the Florida Department of Health (FDOH). The views expressed herein are solely those of the authors and do not necessarily reflect those of the FCDS or FDOH. The collection of cancer incidence data used in this study was also supported by the California Department of Public Health as part of the statewide cancer reporting program mandated by California Health and Safety Code Section 103885; the National Cancer Institute's Surveillance, Epidemiology and End Results Program under contract N01-PC-35136 awarded to the Northern California Cancer Center, contract N01-PC-35139 awarded to the University of Southern California, and contract N02-PC-15105 awarded to the Public Health Institute; and the Centers for Disease Control and Prevention's National Program of Cancer Registries, under agreement #U55/CCR921930-02 awarded to the Public Health Institute. The ideas and opinions expressed herein are those of the authors and endorsement by the State of California Department of Public Health, the National Cancer Institute, and the Centers for Disease Control and Prevention or their contractors and subcontractors is not intended nor should be inferred.