Article Text

Abstract
Background Acute associations between mortality and ozone are largely accepted, though recent evidence is less conclusive. Evidence on ozone–heat interaction is sparse. We assess effects of ozone, heat, and their interaction, on mortality in Britain.
Methods Acute effects of summer ozone on mortality were estimated using data from 15 conurbations in England and Wales (May–September, 1993–2003). 2-day means of daily maximum 8-h ozone were entered into case series analyses, controlling for particulate matter with aerodynamic diameter of <10 μm, natural cubic splines of temperature, and other factors. Heat effects were estimated, comparing adjusted mortality rates at 97.5th and 75th percentiles of 2-day mean temperature. A separate model employed interaction terms to assess whether ozone effects increased on ‘hot days’ (where 2-day mean temperature exceeded the whole-year 95th percentile). Other heat metrics, and non-linear ozone effects, were also examined.
Results Adverse ozone and heat effects occurred in nearly all conurbations. The mean mortality rate ratio for heat effect across conurbations was 1.071 (1.050–1.093). The mean ozone rate ratio was 1.003 per 10 μg/m3 ozone increase (95% CI 1.001 to 1.005). On ‘hot days’ the mean ozone effect reached 1.006 (1.002–1.009) per 10 μg/m3, though ozone–heat interaction was significant in London only. On substituting maximum for mean temperature, the overall ozone effect reduced to null, though evidence remained of effects on hot days, particularly in London. An estimated ozone effect threshold was below current guidelines in ‘mean temperature’ models.
Conclusion While heat showed robust effects on summer mortality, estimates for ozone depended upon the modelling of temperature. However, there was some evidence that ozone effects were worse on hot days, whichever temperature measure was used.
- Ozone
- mortality
- heat
- interaction
- time series
- epidemiology
- climate
- mortality studies
- time series study
- air pollution
Statistics from Altmetric.com
- Ozone
- mortality
- heat
- interaction
- time series
- epidemiology
- climate
- mortality studies
- time series study
- air pollution
What this paper adds
Acute associations between mortality and ozone have been largely accepted, though recent reports are not wholly conclusive.
Results concerning interactions between ozone and heat effects are very sparse, and with sometimes questionable methods.
We report significant, independent pooled effects of heat and of ozone on mortality across 15 British conurbations, in models using mean temperature. When using maximum temperature, evidence of ozone effects on mortality significantly decreased.
Ozone effects were, on average, stronger on hot days and, though overall evidence was not strong, ozone–heat interactions reached statistical significance for most models in London, and sometimes elsewhere.
London was the most populous of the conurbations and experienced the highest temperatures, so this suggestive result may have important implications for cities in hotter regions.
Introduction
While relatively few studies have researched long-term effects of ozone on mortality (life expectancy), and with inconsistent results, evidence of harmful effects from relatively short-term exposures has accumulated from time-series studies. A multi-region time-series analysis of European (APHEA) data in 2004 found that mortality increased, on average, by 0.33% per 10 μg/m3 (about 0.67% per 10 ppb) increase in summer ozone.1 In 2005, three meta-analyses covering the international literature also reported significant average ozone-mortality associations, around 0.8% mortality increase per 10 ppb increase in daily average ambient ozone.2–4 Two US multi-city analyses, reported simultaneously with the meta-analyses, also found significant, though smaller, ozone effects.2 4
Subsequent reports concerning acute effects of ozone on mortality have not added conclusive evidence. While ozone effects on mortality were found in the US and in France using single pollutants models, other researchers in Shanghai, the US, and Chile found that initial evidence was substantially reduced in two-pollutant models.5–9 Researchers in Vienna, perhaps because using whole-year data, found no ozone effect on mortality.10 No effect was found on infant mortality in England, either overall or in the summer, and a Hong Kong study produced limited evidence of ozone effects.11 12
Because of its photochemical origins, ozone concentrations in polluted urban areas peak on summer days. Associations between mortality and extreme heat are well known, and it has been suggested that apparent ozone effects could be due to heat, if temperature effects are not adequately modelled, with the independence of ozone effects (heat effects, likewise) being debated.13 14 Some researchers have further suggested an interaction between heat and ozone. Such interactions are plausible, if only because individuals weakened by extreme heat may be more vulnerable to simultaneously occurring ozone, and vice versa, but evidence from the literature is sparse.15–17 Ren et al, analysing the NMMAPS data, found a strong interaction in the north-eastern US (though not in the south-east), with increasing ozone effects seen in bands of increasing temperature.16 However, within these temperature bands, temperature itself was not controlled for, and results may be subject to residual confounding by heat. A study conducted in Wuhan, China, found the highest ozone effects on mortality to occur on the hottest days, with the next highest occurring on the coldest, and the lowest ozone effects on ‘normal’ days.17 Analyses after the French heatwave of 2003 showed no evidence of ozone–temperature interactions.6
This paper describes a pooled analysis of ozone-mortality associations in 15 conurbations in England and Wales. We estimate independent effects of ozone, and also ask whether ozone has a stronger effect on hot days, controlling in each case for non-linear temperature effects. The independent effect of heat itself is also estimated. We present results for all-cause, cardiovascular and respiratory mortality, by age group, and for a range of sensitivity analyses, including different ways of modelling heat. Bell et al, re-analysing the NMMAPS data, explored linearity of ozone effects and observed the ozone–mortality curve to be flat until about 10 ppb (about 20 μg/m3), and linear thereafter.18 19 We therefore include an examination of non-linear ozone effects.
Methods
Data
Our primary data were mortality, ozone and temperature records. Other meteorological and air pollution data were included as potential confounders. Mortality, meteorological and air pollution data were assembled for those 14 largest conurbations in England and Wales having O3 and particulate matter with aerodynamic diameter of <10 μm (PM10) measurements available for at least 50% of days in the study period (1993–2003), and also for the largest conurbation in an otherwise unrepresented region (Norwich in the East of England), making 15 conurbations with a total population of just under 18 million (table 1). Ozone in urban areas is predominantly a ‘summer’ pollutant, while in winter (because of reduced photochemical ozone generation, stagnant conditions and elevated levels of NOx) it may be inversely correlated with particulate matter, and this can hamper assessment of true ozone effects. Our interest, besides, extends to the interaction between ozone and heat. For these reasons we restricted our analyses to the months of May to September.
Means and standard deviations of (May–September) daily deaths, temperature and particulate matter with aerodynamic diameter of <10 μm (PM10) in the 15 conurbations, plus 95th percentile of 0–1-day mean temperatures for the whole period
Individual death records were obtained from the Office for National Statistics and matched by postcode to conurbation. Deaths from external causes (ICD9 or ICD10 prescripts ‘E’ or ‘Y’, respectively) were dropped. Subgroups were constructed by cause and by age: cardiovascular (CVD, ICD9 3900–4599, ICD10 prefix ‘I’), respiratory (ICD9 4600–5199, ICD10 ‘J’) and other causes; ages 0–64, 65–74, 75–84 and 85+. When referring below to ‘all-cause’ mortality, we do not mean the inclusion of deaths from external causes.
For each conurbation, data from corresponding urban background air quality monitoring stations (obtained from the UK Air Quality Archive) and meteorological stations (from the British Atmospheric Data Centre), were used to construct daily exposure variables as described below. For conurbations with two or more meteorological or pollution monitoring stations having at least 75% non-missing values over the study period (50% non-missing for pollution), average series were calculated using the AIRGENE algorithm to avoid spurious fluctuations on days on which a station did not report values.20 Rural, remote, urban industrial, roadside, kerbside and airport monitoring sites were excluded as being unrepresentative of average exposures.
Temperature data were unavailable for nine per cent of days during the 11-year period. For missing days, data were imputed from regional series, which were excellent predictors (r>0.98 on training data). No such imputations were done for pollutants or for humidity, for which there are consequently missing values.
The average of the current and the previous day's maximum 8-h running mean ozone concentration was calculated, and set to missing if either day's value was missing. The same was done for daily mean PM10 measures, relative humidity, and mean temperature. These 2-day means were chosen a priori, with reference to the literature, but other heat and ozone exposure metrics were also considered in sensitivity analyses (see below).
Statistical analysis
Associations between exposures and mortality counts were analysed in STATA V.9 using Poisson regression (GLM), allowing for overdispersion, following a case series paradigm.21 Associations were assessed separately for each conurbation, and numerical results (eg, rate ratios per 10 μg/m3 ozone) were then combined using random effects meta-analyses to give mean rate ratios.22 Heterogeneity between conurbation-specific results was assessed using Cochran χ2 tests. To represent non-linear effects of temperature and humidity, natural cubic splines of their 2-day averages were calculated, with three degrees of freedom (d.f.).8 12 14 23 24
We used two main models (1 and 2, described below), each of which allowed for seasonal and long-term time trends using an indicator variable for month-year (1–55; five for each summer).21 Other explanatory variables in these models were the 2-day average of daily maximum 8-h mean ozone and, as potential confounders, the 2-day average of daily mean PM10, and indicators for day of week, and bank holiday.25 Humidity data were unavailable for Leicester, and there was no period with simultaneous humidity and PM10 data for The Potteries. Humidity was therefore not included in the main model (its potential to confound was tested in a sensitivity analysis). To allow for temporal auto-correlation, it was decided a priori to include deviance residuals from previous days.26 Residuals from the previous 3 days were included, lag three being significant in most conurbations. Each model was therefore run twice: first to obtain residuals, second (including residuals) to obtain reported results. The models 1 and 2 are now described, with further detail given in an online appendix.
In Model 1 we estimated the main ozone and heat effects on mortality. The model included, in addition to variables described in the paragraph above, the cubic spline of the 2-day average of daily mean temperature. Two-day average temperature has been previously found to capture most adverse heat effects.27 28 From this model we obtained rate ratios for the summer effect of ozone on mortality, adjusted for non-linear effects of temperature and for the other variables. Simultaneously, we obtained a quantification of the heat effect adjusted for ozone and other variables. This estimated heat effect was a rate ratio comparing the adjusted mortality rate at the 97.5th percentile of summer temperatures, compared with that at the 75th percentile.29 This comparison was chosen to approximate the year-round 99th versus 90th percentile quantification presented in a previous prominent publication.30 To achieve this, temperature spline terms were scaled to take the value zero at the 75th temperature percentile. After running the model, the predicted value and its CI, at the 97.5th percentile of temperature, thus represents the adjusted mortality rate ratio. Graphs were produced of the adjusted temperature–mortality curve.
In Model 2 we assessed ozone–heat interactions. The aim was to see whether ozone effects were stronger on hot days. ‘Hot days’ were defined (separately for each conurbation) as days on which the 2-day average temperature exceeded the 95th percentile of all 2-day averages for that conurbation in the entire 11-year period. Although this choice of definition of ‘hot day’ is to some extent arbitrary, it was motivated by the finding in concurrent companion work that in English regions empirical cut-points in linear-threshold model for temperature were approximated by the 95th percentile. Choosing such a percentile from all days in the year also makes the measure independent of the definition of ‘summer’, and the use of percentiles rather than absolute cut-points has been shown elsewhere to produce greater consistency in observed effects across communities, due perhaps to acclimatisation.30 This second model contained all the variables from the first, including the temperature spline and the 2-day ozone average, plus two extra variables: (a) an indicator for ‘hot day’, and (b) an interaction term between this hot day indicator and ozone.
These two models were run for all-cause mortality, and for mortality by cause group (cardiovascular, respiratory, and other) and age group. They were also modified in a number of sensitivity analyses: (A) using maximum rather than mean temperature, (B) using six d.f. for the temperature spline,19 (C) extending the control of temporal variation by adding a cubic spline, with 4 d.f. per year, of a term indicating ‘day of year’, (D) in model 2, using a ‘hot day’ threshold of the 97.5th rather than 95th percentile of 2-day average temperatures, (E) instead of a single hot-day, considering extended periods of hot weather by using an indicator taking the value 1 if the current day and at least 3 previous days were all above the 95th temperature percentile. For brevity, we refer to this hot period as a heatwave, although studies focusing on heatwave effects often employ more complex definitions.31 32 (F) extending the ‘heatwave’ to days with at least four consecutive previous hot days, (G) using a 3-day mean (lags 0–2) of ozone, (H) using current day measures for both ozone and temperature, (I) testing the inclusion of humidity, in a dataset restricted to days/conurbations with no missing data, and (J) excluding the three conurbations with high proportions of missing data: Tyneside (29.8%), The Potteries (23.7%) and Southampton (18.4%).
A further sensitivity analysis (K) used a ‘hockey-stick’ model for ozone, with ozone assumed to have zero effect up to some threshold, and a linear effect thereafter. We used maximum log likelihood to select the threshold empirically from the 210 candidate thresholds across the range of the ozone 2-day averages (9–218 μg/m3). To do this, new ozone exposure variables were created, taking the value 0 if the original was below each tested threshold, otherwise taking the exceedance of the original above the threshold. The threshold was selected using our primary main effects model, Model 1. The shape of the ozone–mortality curve, adjusted for covariates, was also plotted, using a natural cubic spline for ozone with 3 d.f. The selection of the ozone threshold, and plotting the ozone–mortality curve, were performed for simplicity on the pooled dataset, with ‘conurbation’ included as a dummy variable. However, analyses of ozone effects above the selected threshold were conducted separately for each conurbation, as in the other analyses.
Where there is evidence of heterogeneity in effects between conurbations, we use meta-regressions to examine some potential sources of heterogeneity: means of temperature, ozone, PM10 and humidity; mean daily deaths, and proportion of observations missing.
Effect estimates for ozone are per 10 μg/m3 of the 2-day average of daily maximum 8-h ozone, except where stated otherwise in sensitivity analyses. Similarly, those for heat are comparing adjusted mortality rates at the 97.5th versus 75th percentiles of summer 2-day mean temperatures, except where stated. All effect estimates presented are adjusted for covariates as described above.
Results
Across the 15 conurbations, mean daily deaths in the summer months ranged from five in Norwich to 154 in Greater London (table 1). Means of daily maximum 8-h summer ozone values ranged from 52 μg/m3 (about 26 ppb) in West Yorkshire and Nottingham to 73 μg/m3 in Norwich. Average daily mean temperatures in summer ranged from 14.0°C in The Potteries to 16.4°C in Southampton. Using all days in the year (and over the entire period), Greater London had the highest 95th percentile of 0–1-day mean temperatures, at 19.9°C, and The Potteries and Liverpool, at 17.6°C, the lowest.
Ozone and PM10 measures were missing, overall, for 5.7% and 6.4% of days. The number of missing days increased slightly for 2-day means, and 11.7% of days had at least one of the ozone or PM10 2-day means missing. In the pooled dataset the overall correlation coefficient between daily maximum 8-h ozone and daily mean temperature was 0.27, and correlations ranged from 0.03 in Liverpool to 0.43 in Greater London. The overall correlation coefficient between ozone and mean PM10 was 0.31, with correlations ranging from 0.11 in Liverpool to 0.52 in Greater London. For further details, see online appendix.
Primary results on associations between ozone, heat and all-cause mortality
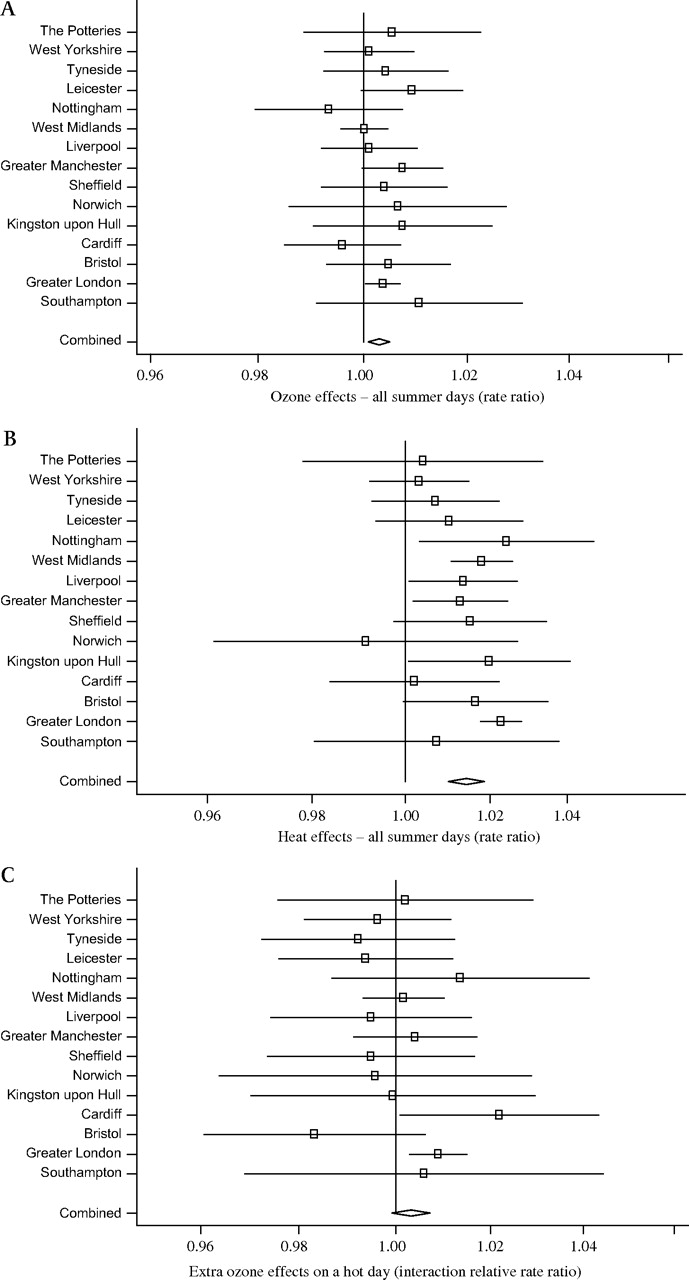
Adverse effects of ozone on all-cause mortality were seen in 13 of the 15 conurbations, after controlling for the mortality-temperature association and other potential confounders, though the association was statistically significant only in Greater London (figure 1A). There was no evidence of between-conurbation heterogeneity in ozone effect, and the mean rate ratio was 1.003 per 10 μg/m3 8-h ozone (95% CI 1.001 to 1.005, table 2).

Adjusted* rate ratios for effects of ozone and of heat on all-cause mortality, and ozone–heat interaction rate ratio, by conurbation and overall. *(A): rate ratios from Model 1 for ozone effect (0–1-day average of daily maximum 8 h) on mortality, adjusted for particulate matter with aerodynamic diameter of <10 μm (PM10), spline of mean temperature (lags 0–1), residuals from previous 3 days, day of week, bank holiday and month. (B): *rate ratios from Model 1 for heat effect: mortality rate ratio at the 97.5th percentile of 2-day mean temperature, relative to that at the 75th percentile, adjusted for ozone, PM10, residuals from previous 3 days, day of week, bank holiday and month. (C): extra ozone effect on hot day (interaction relative rate ratio) from Model 2, adjusted for main effect.
Mean rate ratios and 95% CIs
Heat was independently associated with mortality after controlling for ozone and the other variables. Temperature–mortality curves (presented in the online appendix) showed clear heat effects in several conurbations, particularly the larger conurbations such as Greater London and West Midlands. The estimated heat effect, adjusted for ozone and the other variables, was adverse in all conurbations except Norwich, for which estimates were imprecise (figure 1B). Rate ratios for heat effect were statistically significant in six conurbations (including the three most populous conurbations), and there was no evidence of statistical heterogeneity. The mean rate ratio (deaths on a day at the 97.5th percentile of 2-day summer mean temperatures versus deaths at the 75th percentile) was 1.071 (95% CI 1.050 to 1.093), table 2.
There was some evidence of an interaction between ozone and heat, although this was not strong. In London there was a significantly higher ozone effect on hot days than on other days, with an interaction rate ratio of 1.009 (95% CI 1.003 to 1.015, p<0.01, figure 1C). Ozone–heat interaction was also significant in Cardiff, but estimates of interaction for the other conurbations were scattered either side of the null (figure 1c). There was little heterogeneity of effect between conurbations (p=0.41), with CIs generally wide, and the mean of the 15 interaction terms was 1.003 (95% CI 0.999 to 1.007, p=0.12). Table 3 shows the mean ozone effect on an ‘ordinary’ day (when 2-day mean temperatures are below the 95th percentile), on a hot day, and the mean interaction term: the extra (multiplicative) ozone effect on a ‘hot day’. When restricted to hot days, the mean rate ratio across conurbations for the ozone effect was 1.006 (95% CI 1.002 to 1.009, p<0.01) per 10 μg/m3 8-h ozone, compared with 1.002 (1.000 to 1.004, p=0.08) on cooler days.
Mean rate ratios and 95% CIs for ozone effects on ‘ordinary’ days, when the 2-day mean (/maximum) temperature is below the 95th percentile, on hot days, and for the interaction between ozone and heat (the extra ozone effect on hot days)
Associations by cause and by age
Mean effect estimates for ozone for all three causal subgroups were similar to those for all-cause mortality (table 2), though reduced in statistical significance. Heat remained independently associated with deaths in all three causal subgroups, with the mean rate ratio for respiratory mortality reaching 1.139 (1.079–1.202, table 2).
Estimates of interaction between heat and ozone were also highest, overall, for respiratory mortality (table 3), with a mean interaction rate ratio of 1.008 (0.992–1.023), and significant interactions seen in Leicester and Cardiff. However, the differences between results for respiratory and cardiovascular mortality were not statistically significant, nor did ozone–heat interactions reach overall statistical significance in any cause group. Conurbation-specific estimates of heat–ozone interaction were heterogeneous for CVD, with estimated ozone effects significantly greater in London on hot days, and significantly lower on hot days in Leicester and Bristol.
Ozone effect estimates did not appear to follow any consistent age-related pattern (table 2), nor did any of the mean estimates reach statistical significance. By contrast, heat effects increased markedly with age, with mortality in those aged 85+ raised by over 12% at the 97.5th percentile of summer compared with the 75th (table 2).
Ozone effects on hot days, on average, reached or approached statistical significance in all but the 75–84 years age group (table 3), though mean estimates of ozone–heat interaction — higher in the younger age groups — did not.
Sensitivity analyses (A) to (J)
On substituting maximum for mean temperature, main ozone effects were reduced overall to null (table 2), and were not significant even in London. We therefore repeated all analyses using maximum temperature (see below).
Otherwise, estimates of ozone effect proved generally robust to changes in the model. Mean rate ratios for the effect of ozone on all-cause mortality remained between 1.002 and 1.004 (table 2), and were statistically significant with the exception of the model using current day ozone and temperature (lag 0) rather than 2-day means. Over all of these sensitivity analyses, conurbation-specific ozone rate ratios were predominantly above 1, as in the main model. They were all statistically significant for Greater London, except in the lag 0 model.
Mean estimates of heat effects remained extremely robust in all sensitivity analyses (table 2). Effect estimates increased in the lag 0 model, and when controlling further for season.
Evidence of interaction between heat and ozone increased slightly when using 3-day rather than 2-day mean ozone, and when using maximum rather than mean temperature, but in other sensitivity analyses was reduced. Significant ozone–heat interactions were seen in London and Cardiff in nearly all models, though some results were heterogeneous, with significantly less harmful effects during heatwaves in Sheffield and Norwich.
Excluding conurbations with most missing data effected results little, apart from a slight widening of some CIs.
Sensitivity analysis (K) — non-linear associations between mortality and ozone
The empirically selected threshold of effect was 65 μg/m3 (95% CI 52 to 81 μg/m3). The mean rate ratio for the ozone effect above this threshold was, as expected, higher than that across the entire ozone range (table 2). The heat effect and ozone–heat interaction changed less (tables 2 and 3), though the latter was reduced in statistical significance. The ozone–mortality curve (figure 2) appeared consistent with a hockey-stick model, showing a short and very shallow downward slope at the low end of the ozone range, consistent with a flat line, followed by an approximately linear, upward slope.

The ozone–mortality curve, all conurbations combined. Adjusted for PM10, residuals from previous 3 days, day of week, bank holiday, month, and natural cubic spline of mean temperature (lags 0–1).
On substituting maximum temperature for mean temperature
When temperature variables were constructed using daily maxima rather than daily means, observed overall ozone effects in the basic model were reduced. The mean estimate was 1.000 (0.998–1.002, p>0.20, table 2), and no conurbation-specific estimates were statistically significant. Heat effects remained robust and followed the same patterns as described above. There remained some evidence of ozone–heat interaction: mean interaction terms reached significance for the 65–74 age group and in the model with extra seasonal adjustment. Estimates of interaction were significant for London in the main model and over half of the sensitivity analyses.
In the hockey-stick model, the empirically determined ozone threshold was now much higher, at 130 μg/m3, than when using mean temperature. The mean rate ratio for ozone effects above this threshold was 1.011 (0.999–1.025, p=0.08, table 2), and in London reached 1.021 (1.005–1.039, p=0.01). The mean ozone–heat interaction rate ratio was also considerably raised in this model, though of only borderline statistical significance (table 3). Excluding conurbations with most missing data slightly increased effect estimates for heat, and for ozone–heat interaction.
Heterogeneous effect estimates
As noted in tables 2 and 3, there were several instances of significant heterogeneity between conurbations in effect estimates, and all seven examined potential sources of heterogeneity were found to be significant determinants in several meta-regression analyses. Ozone effect estimates were most strongly related to the proportion of missing pollution measures, with higher estimates in conurbations with fewer missing values. Estimates of heat effect were most strongly related to lower mean humidity, higher temperatures and higher ozone. Estimates of ozone–heat interaction were most strongly related to higher PM10 and lower humidity. Those of ozone on hot days were most strongly related to lower humidity. All these associations tend to ‘overlap’, for example, London and/or Cardiff were among the ‘top’ three conurbations for all of the seven factors considered. Without invalidating these results on heterogeneity, this makes it hard to pinpoint particular sources.
Discussion
We set out to see whether, in British conurbations, summer ozone had an effect on mortality independent of heat, and whether there was any evidence of ozone–heat interaction. An adverse association between ozone and mortality was found in nearly all conurbations, and the mean rate ratio was 1.003 (95% CI 1.001 to 1.005) per 10 μg/m3 ozone increase. However, on substituting maximum for mean temperature, this ozone effect seemed to evaporate, with a mean rate ratio of 1.00 and no significant effect even in London. Both abandoning a priori plans, and neglecting a significantly different result, seemed wrong. Akaike's Information Criterion (AIC) added little clarity: AICs summed across conurbations showed maximum temperature, on average, a slightly better fit than mean temperature, though this varied across conurbations, with mean temperature fitting substantially better in London, and maximum substantially better in West Midlands. We therefore repeated all analyses using maximum temperature.
This difference in observed ozone effect, dependent upon the temperature variable, changed little across the sensitivity analyses. In the maximum temperature analyses, only in the hockey-stick model, measuring the effect of ozone above 130 μg/m3, did the mean rate ratio approach statistical significance. It may be that either due to better measurement or more complete modelling, a true ozone effect was transferred to the maximum temperature effect, but this is speculation.
Heat effects based on both temperature measures were highly significant. Using mean temperature, the mean rate ratio, comparing adjusted mortality at the 97.5th versus 75th temperature percentile, was 1.071 (1.050–1.093). That using maximum temperature was slightly higher. Both sets of results were robust to all sensitivity analyses.
Overall evidence that ozone effects were worse on hot days was suggestive. In our primary model the mean ozone–mortality rate ratio on ‘hot days’ was 1.006 (95% CI 1.002 to 1.009), with a mean ozone/hot-day interaction rate ratio of 1.003 (0.999 to 1.007, p=0.12). With maximum temperature, despite no overall ozone effect, there remained some evidence of ozone effects on hot days, and of ozone–heat interactions. Across most of our analyses ozone effects were significantly higher on hot days in London — the most populous of our conurbations, and also the one experiencing the highest temperatures. This result may, therefore, have implications for cities in hotter regions of the world.
Mean effects of heat were higher for respiratory mortality, and heat effects, non-significant in those aged under 65, rose considerably with age. Overall ozone effects showed no age-related pattern, but ozone effects on hot days and ozone–heat interactions were greatest in those aged <75.
Of the ozone studies quoted here, most employed mean temperature.1 7 10–14 17 18 23 24 33 Two used, or included, maxima.6 16 Others failed to specify. Our ozone results from ‘mean temperature’ models are broadly in line with the meta-analyses and multi-city analyses of Bell et al, Ito et al and Levy et al.2–4 Numerically, our 0.3% raised risk per 10 μg/m3 ozone is closer to the results of the multi-city studies, and somewhat smaller than those from the meta-analyses (after taking account of the different ozone metrics).2 4 That the estimates from the meta-analyses were higher than those from the previous multi-city studies has been attributed to publication bias, though an adjustment for funnel plot asymmetry by Ito et al, while resulting in a somewhat reduced estimate, did not account for the difference.2 4 34
Some studies have reported heterogeneous results.1–3 6 33 A few of our results showed between-city heterogeneity and though several factors seemed possible sources of heterogeneity, concrete conclusions proved difficult. Ito et al, exploring heterogeneity in their meta-analysis, found ozone effects inversely related to average temperature, ozone or PM, contrary to our findings.2 Levy et al, as we did, associated higher estimates with higher total deaths.3 Ito et al noted the influence of model specification, and recommended ‘analysis of multiple cities using several alternative model specifications’.2 Our results show sensitivity to model specification, with notable differences in ozone effect estimates when replacing mean temperatures with maximum — a factor ignored in the three US 2005 meta-analyses.2–4 That this matters, we point to our two ozone-threshold models. When controlling for maximum temperature, we see little overall evidence of ozone effect, with a possible threshold at 130 μg/m3 (though imprecisely estimated). On controlling for mean temperature, we see significant ozone effects — stronger still on hot days — which start at 65 μg/m3, a value below the Air Quality Strategy objective for 2005 and also below the EU target level for 2010.35 Further work to understand these complex temperature-ozone effects on health is clearly needed.
Conclusion
Heat showed significant, independent effects on summer mortality, particularly among the elderly and for respiratory mortality. Evidence for ozone effects varied according to the temperature variable used in the model. There was some evidence that ozone effects were worse on hot days, particularly for those aged <75. Adverse effects of ozone may start at levels below current guidelines.
Acknowledgments
We wish to thank also Bridget Fenn, Krishnan Bhasharan and other colleagues at LSHTM who helped us to assemble the data.
References
Footnotes
All authors contributed to the paper.
Funding This work was primarily funded through grant NE/E008593/1 in the Environment and Human Health programme of the Natural Environment Research Council.
Competing interests None.
Provenance and peer review Not commissioned; externally peer reviewed.
Linked Articles
- Correction