Article Text

Abstract
Objectives: The ability to measure temporal trends in disease incidence is important, but valid methods are needed. This study investigates UK trends during 1996–2005 in work-related skin and respiratory diseases including non-malignant pleural disease, asthma, mesothelioma and pneumoconiosis and the potential for bias when using surveillance systems for this purpose.
Methods: The volunteer reporters in three surveillance schemes were specialist physicians for skin diseases, specialist physicians for respiratory diseases and occupational physicians, respectively, who provided monthly reports of new cases of disease which they considered work related. Poisson regression models were used to investigate variation by calendar year (trend), season and reporter characteristics. Separately, temporal patterns in the probabilities of non-response and zero reports were investigated. Annual changes in disease incidences were compared between reporter groups.
Results: There was little evidence of change in incidences of non-malignant pleural disease, mesothelioma, skin neoplasia and urticaria, but falls were seen for contact dermatitis and pneumoconiosis. Although the directions of change were similar across reporter groups, the magnitude of annual change in incidence was often inconsistent: for occupational asthma, it was −1.9% (95% CI −5.2 to 1.4) and −12.1% (95% CI−19.5 to −4.1) using respiratory and occupational physician reports, respectively. Response rates were high (∼85%), but non-response increased slightly with membership time, as did the probability of a zero return in some groups. Adjustment of results for presumed reporting fatigue led to an upward correction in some calendar trends.
Conclusions: As some estimated changes in incidence based on volunteer reporting may be biased by reporting fatigue, apparent downward trends need to be interpreted cautiously. Differences in the population bases of the surveillance schemes and UK health service capacity constraints may also explain the differences in trends found here.
Statistics from Altmetric.com
For epidemiologists and policy-makers alike, the ability to measure temporal trends in disease incidence is important, especially when there is considerable potential for prevention. Workplace risk factors for disease, although often modifiable, remain an important cause of disease and ill-health worldwide. Attributable fractions for asthma and chronic obstructive pulmonary disease for example, estimated by the World Health Organization in 2004,1 varied across the world from 0.07 to 0.14 for morbidity and from 0.09 to 0.20 for associated mortality. In the absence of dedicated longitudinal studies for measuring trends, suitable data sources are needed; however, routine health records are not generally useful since they lack information on causation.
There are many types of surveillance activity for investigating work-related disease, including systems for measuring exposure prevalence and incidence systems based on expert opinion on causation. A world-wide review2 in 2004 was critical of surveillance methods for work-related disease. Underestimation of incidence has been a focus of concern particularly in the USA.3–6 However, underestimation of absolute rates does not necessarily compromise the estimation of temporal trends, which is concerned with the measurement of change in risk rather than in absolute risk.
In the UK, expert opinion surveillance schemes for work-related diseases, based on voluntary reporting by specialist occupational and other consultant physicians, have been in operation since 1989.7 The three longest running schemes are SWORD8 (Surveillance of Work-Related and Occupational Respiratory Disease; in operation since 1989), EPIDERM9 (Occupational Skin Surveillance; in operation since 1993) and OPRA10 (Occupational Physicians Reporting Activity; in operation since 1996). Physicians diagnosing work-related disease are periodically asked to report any new cases of disease they diagnose in the following month, which, in their opinion, are work related (ie, caused or made worse by work). The schemes are designed to minimise the effort of reporting so as to encourage a high response rate.
We wished to establish whether the incidences of specialist-diagnosed, work-related respiratory diseases and work-related skin diseases rates are falling in the UK as part of a wider interest in trends for all work-related disease. However, as the limitations of expert system monitoring methods for judging trends had not previously been described, our objectives were twofold: (i) to estimate the true rates of change per year for 1996–2005 in the incidence of specialist-diagnosed skin and respiratory diseases (including contact dermatitis, asthma, non-malignant pleural disease, mesothelioma and pneumoconiosis) and (ii) to identify, and eliminate where possible, sources of bias in using surveillance schemes of this type.
METHODS
New cases of skin disease during 1996–2005 were reported by consultant dermatologists belonging to EPIDERM and occupational physicians belonging to OPRA. New cases of respiratory disease were reported by respiratory physicians in SWORD (1999–2005) and OPRA physicians (1996–2005); data from SWORD prior to 1999 were not available to us. The consultant specialists in SWORD and EPIDERM were based in UK National Health Service (NHS) hospitals. Physician registers were routinely inspected and new potential reporters approached so as to include as many eligible consultants as possible. Some reporters were employed in hospital clinics with specialist diagnostic facilities, their patients being tertiary referrals. The occupational physicians in OPRA were employed in private and public enterprises (including the NHS and local councils) or worked as independent consultants. The schemes were administered from a UK university, initially under the umbrella of the Occupational Disease Intelligence Network and, from 2002 onwards, under The Health and Occupation Reporting Network (THOR) from whom further information is available online.11
There were two types of reporter in EPIDERM and SWORD: those asked to report every month, referred to as core reporters, and those asked to report in one randomly chosen month each year (sample reporters). Core reporters tended to be particularly interested in occupational disease. All reporters in OPRA were sample reporters until 2003; however, 30 acted as core reporters in 2004 and another 30 in 2005. For the present analysis, data from the core reporters in 2004 and 2005 for only one randomly chosen month were used so that the whole dataset had a “sample” structure. In the month when a physician in any scheme was due to report, they received, by post, a card on which they were to record new cases of work-related disease seen in the following month. If no cases were seen, the card was to be returned, marked “I have no new cases to report”. Reports included information on diagnosis, age, gender, occupation, industry and suspected agent. Staff from THOR contacted non-responders a maximum of twice. Some physicians, especially those employed in tertiary centres, reported cases on behalf of themselves and their colleagues.
The absolute incidence of specialist-diagnosed diseases among the UK workforce was not estimated as this would have required information on the completeness of the reporter base, for example, the percentage of eligible reporters included. Instead, we estimated change in incidence per year using a two-level (hierarchical) Poisson regression model, with gamma distributed random effects, implemented using the STATA v.9 xtpoisson procedure. The dependent variable was number of cases, including zeros, per reporter per month. The main predictor of interest, calendar time, was represented either as a categorical variable with 1999 as the (arbitrary) base year for comparison or as a continuous variable with a scale of years. The latter analyses estimated annual percentage change in incidence over the time span of the study, based on the assumption that the change was constant from year to year. Even if this assumption is not true, this estimate can be viewed as an approximate measure of average change or trend.
Other time-varying predictors were: season, referring to the month of the year, indicator variables representing the first month as a new reporter and as a new core reporter (to allow for a possible excess of cases initially due to inclusion of prevalent cases) and membership time, defined as calendar date minus date of becoming a reporter. This last variable was not included in the main analyses; its role in investigating bias is described later. Type of reporter (core, sample) was included as a two-category predictor in EPIDERM and as a three-category predictor (large centre core reporters, other core reporters, sample) in SWORD. The finer categorisation in SWORD was introduced for statistical reasons only (ie, model convergence) and was not of direct interest. All calendar trend estimates refer to results from models with these variables unless otherwise stated; unadjusted results are given only for total incidence in each scheme.
If rate denominators are constant over time, then the ratio of case counts in one calendar year to another can be interpreted as an incidence rate ratio (IRR). Data from the Great Britain Labour Force Survey for 1996–200412 showed a regular increase in the size of the working population of the order of 1% a year, suggesting that an increase in cases over time of this order might be seen even if true incidence rates remained constant. We made no allowance for this increase; estimates of calendar year effects from the Poisson analyses were treated as IRRs and results expressed as a percentage change in incidence using the formulae (IRR−1)*100. If considered appropriate, an approximate correction for the population increase could be made by subtracting one point from the reported percentage changes, for example 6% would become 5%.
Investigation of bias
The main analyses addressed potential bias due to short-term new reporter behaviour and accounted for changes in the reporter bases over time (see Discussion). Other factors were addressed separately. Potential data was “missing at random”13 for sample reporters in 11 randomly chosen months per year and, as such, was not a source of bias in our analyses. Other data were missing because of unplanned non-response by both types of reporter. We used marginal (also called GEE) logistic regression models to investigate if the probability of non-response increased with membership time, as might be expected if reporters became tired. (Marginal models were used in preference to random effects logistic models because estimation of the latter can be unreliable.14) Tired reporters might also, or instead, increasingly return cards with the option “I have no cases to report”. Therefore, using marginal logistic models, we also looked for evidence that the probability of zero cases in returned cards increased with membership time, while controlling for any trend in calendar time. Finally, for each scheme, we re-estimated trends in total incidence of work-related disease using two different methods to adjust for possible reporter fatigue: firstly, we added membership time to the original Poisson models, and secondly, we reran the original model with membership restricted to a maximum of 5 years.
We estimated that approximately 250 cases of a disease over 10 years would be needed to give 80% power to detect an average annual change in incidence of 10% a year, using a two-tailed test. Only diseases with at least this number of cases were considered separately. Two-sided p values were used to help assess differences in trend estimates across reporter groups.
RESULTS
Reporters
It has been estimated that OPRA reporters covered around 12% of the UK working population in 2002,15 although coverage varies across occupations (see Discussion). While there have been 930 members in total (table 1), the mean number in any one year was 495; on average, 41 members were asked to report each month. The response rate across 1996–2005 (defined as total cards returned divided by the total requested) was 84%.
EPIDERM began with sample reporters only, but in 1996 many agreed to be core reporters. We have estimated (unpublished data) that 60–80% of eligible consultants in the UK were included in 2005. During 1996–2005, the mean numbers of core and sample members in any single month were 27 and 143, respectively. The response rate was higher among core reporters (93%) than sample reporters (81%). For SWORD, we estimated (unpublished) that 60–75% of eligible consultants were included in 2005. During 1999–2005, the mean numbers in any single month were 30 core and 330 sample members. The response rate was similar to the other schemes.
All work-related disease, OPRA 1996–2005
Occupational physicians reported other conditions besides skin and respiratory diseases, for example musculo-skeletal and mental problems. Although these are not of direct interest here, the trend in total incidence of work-related disease is relevant. There was seasonal variation in total reported cases with dips in August and December and case counts were 24% higher on average in the first month as a reporter. After adjustment for these factors, there was evidence of an increase over time: the change was estimated as +2.6% (95% CI 1.6 to 3.6) per calendar year in a model with continuous calendar time. The unadjusted value was +0.9% (95% CI 0.1 to 1.7).
Trends in total skin disease incidence, EPIDERM and OPRA, 1996–2005
Core reporters contributed the majority (90%) of skin cases in EPIDERM (table 2), not only because of more frequent reporting but also because they reported more cases per returned card with 4.1 cases on average compared to 0.9 for sample reporters. The mean age of cases was 41 years and 55% were men. There was evidence of seasonal variation in reported incidence with higher numbers in winter compared to summer, although December was an exception with the lowest rate. More cases, 44% higher on average, tended to be reported in the first month as a core reporter compared to later. The adjusted and unadjusted average changes in incidence per calendar year were −2.7% (95% CI −3.4 to −2.0) and −3.2% (95% CI −3.9 to −2.5), respectively. Similar trends were seen for core and sample data (table 2).
In OPRA, 14% of all work-related cases concerned skin disease; 62% of these patients were men and mean age was 38 years. The (adjusted) average change per calendar year in incidence of all skin disease, estimated from OPRA, was −10.0% (95% CI −12.0 to −7.1).
Contact dermatitis accounted for 81% of cases in EPIDERM and 82% of skin diseases in OPRA. Other disease groups with sufficient cases for analysis (EPIDERM only) were neoplasias (n = 1468, 12%) and urticaria (n = 634, 5%).
Contact dermatitis
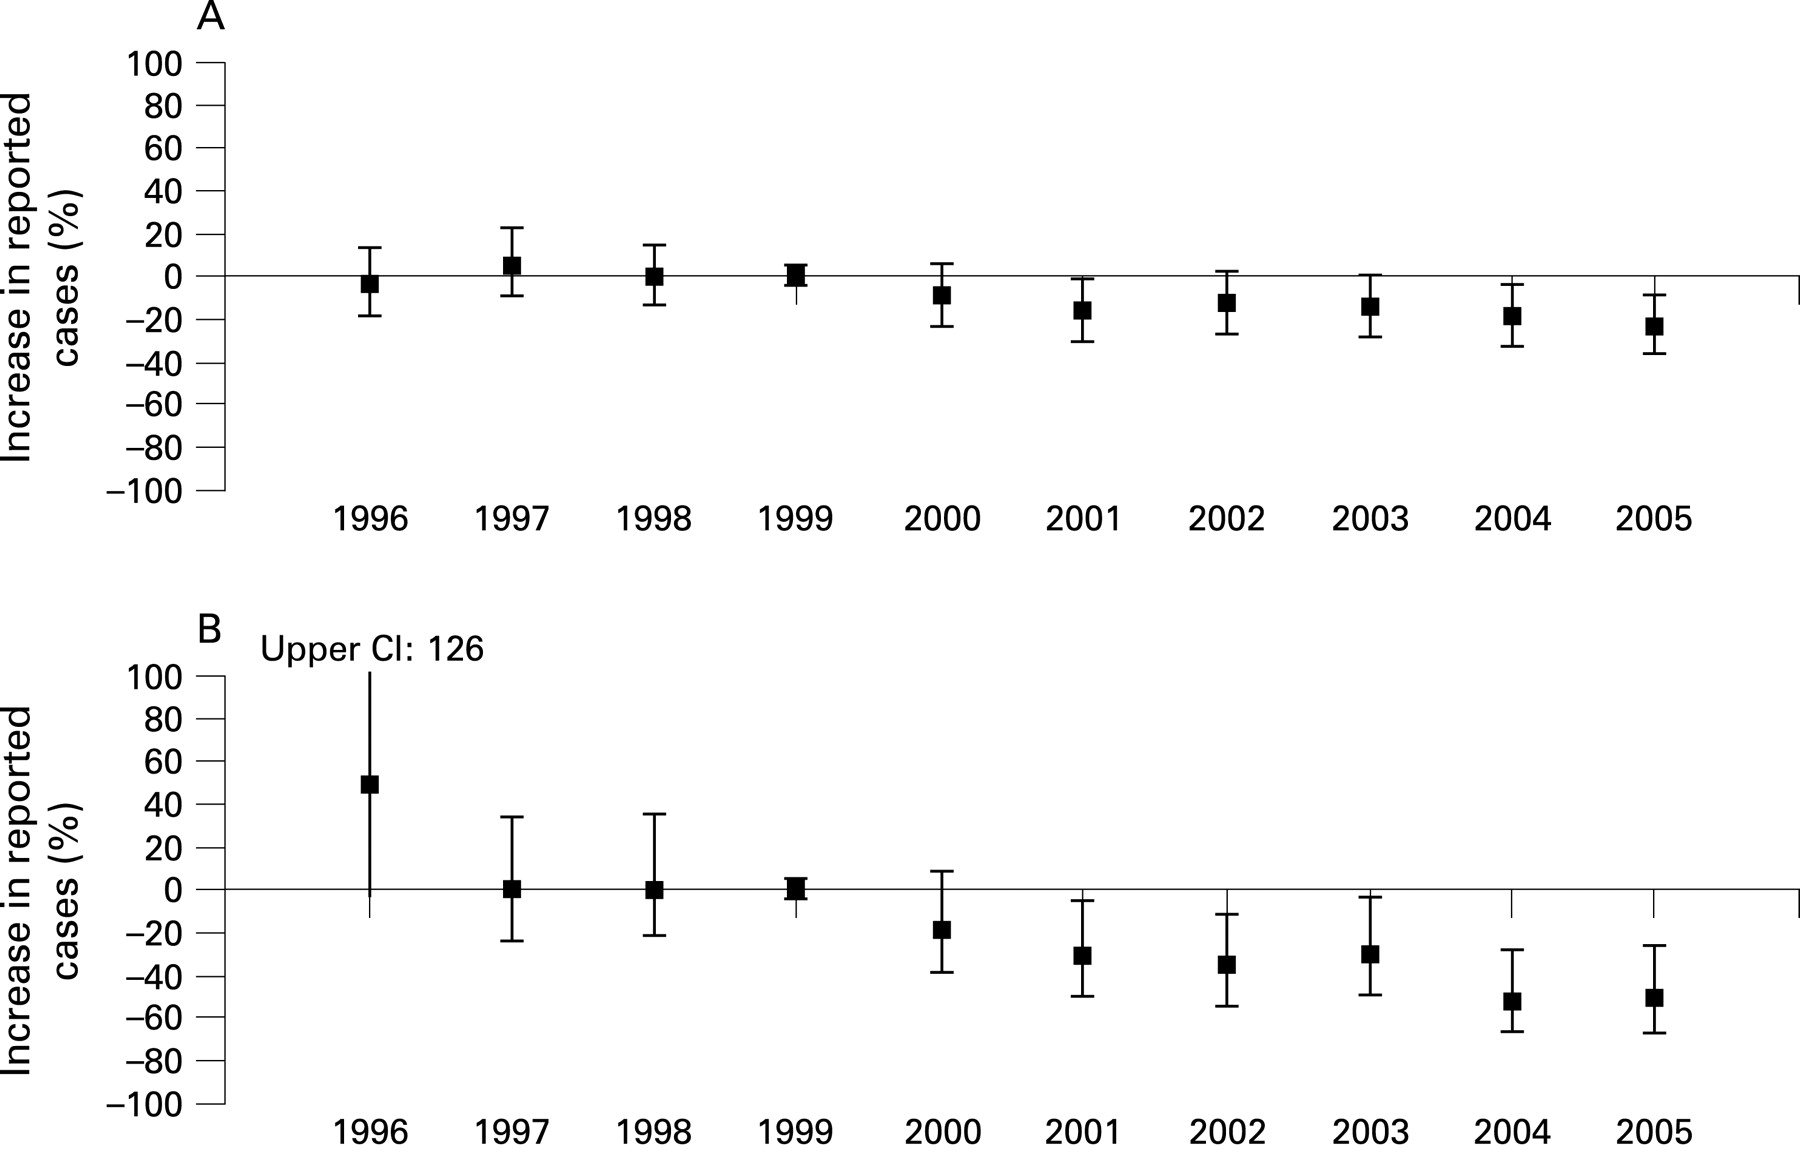
There was a fairly consistent downward trend in the incidence of contact dermatitis reported by dermatologists (fig 1A). The average annual change was estimated as −2.9% (95% CI −3.7 to −2.1), with similar figures for core and sample reporters (table 2). In OPRA, however there was a much greater downward trend (fig 1B), equivalent to an average change of −10.3% per year (95% CI −13.5 to −6.9). The probability of this difference arising through chance factors alone is less than 0.001.

Skin neoplasia and urticaria
Overall, there was little change in neoplasia incidence over time (table 2). However trends among core and sample reporters differed (p = 0.007), the estimated average annual changes being −2.7 (95% CI −4.9% to 0.5%) and +7.0% (95% CI 1.1 to 13.3), respectively. There was little change overall in urticaria incidence (table 2).
Trends in total respiratory disease, SWORD, 1999–2005 and OPRA, 1996–2005
The mean age of the 7439 cases of work-related respiratory disease reported to SWORD was 64 years and 90% were men. Core members reported more cases per returned card (mean 3.8) than sample reporters (0.5). On average, reported incidence was higher in the cooler months, but there was a dip in December and also in August. New members reported on average 31% more cases in their first month compared to later activity. The adjusted and unadjusted estimates of average change per calendar year were both 0.3%. However, there were different trends for core and sample reported data (p = 0.005) with sample data showing a downward trend of −4.3% (95% CI −7.2 to −1.3) per year compared to +1.1% for core data (table 3).
Of the OPRA cases 6% had a respiratory disease and of these 72% were men. Over the 10 years from 1996 to 2005 there was an average annual change of −7.0% (95% CI −11.6 to −2.2), with a similar figure for 1999–2005 alone (table 3).
OPRA cases were younger (mean 42 years) and the distribution of diseases by diagnosis differed substantially from SWORD. In the latter scheme, the main conditions were non-malignant pleural disease (44%), mesothelioma (21%), occupational asthma (19%), pneumoconiosis (7.3%), rhinitis (2.3%), bronchitis (1.8%), lung cancer (1.8%) and inhalation accidents (1.4%). In OPRA, occupational asthma was the largest category with 253 cases (48% of the total).
Occupational asthma
The average annual change in occupational asthma estimated from SWORD was −1.9% (95% CI −5.2 to 1.4), but the pattern was erratic (fig 2A). The relatively high rate in 2004 was due in part to a single, large outbreak in one workplace over a few months. The different trends for core and sample reporters are notable (table 3): there was almost no change over time (−0.4%) using core data, while sample data suggested a large annual fall of −13.0% per year (95% CI −20.2 to −5.3). Judged also by reports from occupational physicians, there was a downward trend (fig 2B): the annual change over the 10 years 1996–2005 was −8.1% (95% CI −13.1 to −2.9), while from 1999 to 2005 it was −12.1% (95% CI −19.5 to −4.1). p Values for the contrast between SWORD core data with SWORD sample data and with OPRA data are 0.002 and 0.003, respectively.

Non-malignant pleural disease, mesothelioma and pneumoconiosis, SWORD 1999–2005
The estimated average annual changes in the incidence of non-malignant pleural disease, mesothelioma (fig 3) and pneumoconiosis (fig 4) were +2.2% (95% CI −0.4 to 4.8), −2.6% (95% CI −5.7 to 0.7) and −5.7% (95% CI −10.5 to −0.5), respectively. Trends in pneumoconiosis for core and sample reporters separately were markedly different, being −1.9% (95% CI −7.1 to 3.7) and −15.8% (95% CI −24.7 to −5.9), respectively; the p value for this difference is 0.04. For mesothelioma also, there was a more downward trend among sample reporters (table 3), but the difference is compatible with a chance explanation (p = 0.18).


Trends in non-response
In all three schemes there was evidence that non-response increased with membership time. Although the relationships over time were not smooth, they were investigated using (log) linear models as interest was mainly in the existence of an increase rather than its precise form. After adjusting for seasonal variation and new reporter variables, the odds of non-response were estimated to increase by between 4% and 9% per year depending on the reporter group (table 4, column 2). There was some evidence of seasonal variation and December was generally the month with the lowest response rate.
Trends in returns with zero cases
Of cards returned in OPRA, 52% were reports of zero cases, with corresponding figures in EPIDERM and SWORD of 32% and 55%, respectively. Zero case reports decreased over time in OPRA but increased slightly in EPIDERM and in SWORD sample data (table 4, column 2 of results). In further models, an attempt was made to separate trends by calendar time and trends by membership length by including both time variables in models (table 4, columns 3 and 5 of results). In OPRA, there was evidence of an independent increase in the odds of a zero return with membership time (OR = 1.06 per year, 95% CI 1.01 to 1.11), while the downward calendar time trend remained (OR = 0.90 per year, 95% CI 0.86 to 0.94). In EPIDERM, there was also a suggestion that zero reports increased with membership time, independently of calendar time among sample reporters (OR = 1.05 per year). In SWORD, trends with membership time were in the same direction but weaker. The 95% CIs for results from models with both time variables were greatly increased compared to models with only one time variable because of the strong correlation between them.
Calendar time trends in incidence adjusted for membership time
If length of time in a scheme leads to lower case reporting or increased zero reports, then previously estimated calendar time trends in incidence, which do not account for this phenomenon, would be biased downwards. We therefore re-estimated calendar time trends in total incidence, corrected for fatigue bias, firstly by including both calendar time and membership time in the Poisson models, and secondly by restricting membership time to a maximum of 5 years. In OPRA, the estimate of change per calendar year increased from 2.6% to 4.4% (95% CI 0.5 to 8.5) after correction by the first method and to 2.8% (95% CI 0.7 to 4.9) after the second. In EPIDERM, the changes was from −2.7% previously to +2.7% (95% CI −0.9 to 6.4) and +3.0% (95% CI 0.2 to 5.8), respectively, after the two adjustments. In SWORD, the previous value of 0.3% changed to 1.5% (95% CI −1.3 to 4.4) and −1.1% (95% CI −5.7 to 3.7) under the two methods. The analyses restricted to 5 years’ membership utilised 67%, 33% and 13% of all cases in OPRA, EPIDERM and SWORD, respectively, the difference being explained by differences in the age of the schemes.
CONCLUSIONS
Sources of bias
Although a number of potential biases have been addressed in this work, some are not amenable to statistical control. Consistency of diagnostic criteria across time is an important criterion for valid estimation of temporal trends of any disease or event16 which can be compromised by increased ability to recognise disease or shifts in classification.17 When interest is in work-related disease, validity is also vulnerable to systematic changes in, or awareness of, the epidemiological evidence of causal links and in government policy (eg, on compensation). We cannot rule out bias for such reasons. Brief guidance on attribution was available to the reporters in the three schemes, but imposition of strict criteria for disease or its attribution was deliberately avoided so as to maintain participation. Such compromises are typical of surveillance systems (characterised by “practicality, uniformity and rapidity, rather than by accuracy or completeness”18) but may also be inevitable in any long-term voluntary data collection system.
While participation in a scheme may be associated with higher rates of recognition and diagnosis of work-related disease, which could bias absolute incidence estimation, this need not bias trend estimates. A greater potential concern was that systematic changes over time in the membership of the schemes might produce false trends. For example, earlier scheme entrants might have more interest in occupational disease and tend to diagnose more cases compared to later entrants, which could produce a false downward trend in simple analyses. We avoided this problem by use of a multi-level model, which links cases to their reporter and thus facilitates within-reporter estimates of temporal trends which are not biased by temporal variability in reporter characteristics. In addition, our analyses allowed for the possibility that new members might initially report prevalent as well as incident cases, by inclusion of new reporter variables in the models.
We also considered the possibility that within-reporter estimates of change could be undermined by long-term reporter fatigue, such as increasing non-response and/or an increasing tendency to under-report cases over time. While response rates were high overall, there was evidence in all schemes that reporters were less likely to return cards as membership time lengthened. However, rates of non-response increasing over time need not cause bias if the non-response is, in other respects, random.14 Whether random or not, we do not consider that non-response was a major source of bias in this study: in simulations of longitudinal studies with missing data which increased to 25% over time for non-random reasons, the bias was found to be slight14 when using multi-level models.
On the other hand, an increasing tendency over time to erroneously report zero cases, or fewer cases than were actually seen, would certainly lead to a spurious fall in incidence. We found evidence (table 4) that that zero reports increased independently with membership time among OPRA and EPIDERM sample reporters with less evidence in SWORD. We therefore attempted to re-estimate trends in total incidence in each scheme, corrected for fatigue using two methods. However, we do not consider either of the methods to be wholly reliable. In the first, with regression-based adjustment for membership time, the very wide confidence intervals for the new trend estimates attest to the inherent problem of trying to separate the effects of two strongly correlated factors, calendar time and membership time. The second method, which restricted membership to a somewhat arbitrary maximum of 5 years, is unsatisfactory because it does not use all the data and certain types of reporter (eg founding members) may have been excluded. Thus we have not found a satisfactory solution to correction for reporter fatigue. Nevertheless, these additional analyses show that we cannot ignore the possibility that negative trends in the main analyses might be partly due to behavioural factors rather than true changes in incidence. This was especially true of EPIDERM data where a negative trend was reversed by each of the corrective methods. As an aside, it is interesting to consider whether schemes which encourage and achieve good response rates might inadvertently also achieve an increase in returns of false zeros.
Main messages
It is important to clarify the limitations of surveillance methods for judging trends.
Different methods may give rise to different trends.
Reporting fatigue may be a confounding factor in systems based on expert opinion.
The falls seen here, for contact dermatitis, pneumoconiosis and in some cases occupational asthma, need to be interpreted cautiously.
Policy implications
Estimated time trends in the incidence of work-related disease based on surveillance data need to be interpreted cautiously.
Potential biases in surveillance schemes based on physician reporting have been described; in the future other surveillance methods need to be equally scrutinised.
Fatigue aside, a notable feature of the results is that they were not always consistent across schemes, which was marked in the case of occupational asthma. In general, disease-specific trends based on OPRA data were in a more downward direction and, with one exception, trends based on sample reporters tended to be more downward compared to core reporter data. These differences, although perhaps not their extent, are consistent with differential reporting behaviour (see above), but there are other possible explanations.
The population bases for EPIDERM and SWORD reporters would likely have included all work sectors but not so OPRA as UK occupational physicians tend to be based with larger employers. It has been estimated that 43% of health and social service employees are covered by OPRA but only 1% of those in agriculture, forestry and fishing.10 Thus, work-related disease in small enterprises such as construction or hairdressing would tend not be reported within OPRA: trends may genuinely vary across different work sectors. Furthermore, the more downward trends in OPRA compared to EPIDERM or SWORD might reflect more preventive interventions in workplaces covered by the former group compared to generally. The difference between OPRA and the other schemes is therefore informative even if OPRA results are not as representative.
On the other hand, trends in disease diagnosed by hospital specialists may not reflect trends in all work-related disease. In the UK, access to the specialist physicians in EPIDERM and SWORD would have been dependent on referral by a general practitioner, whereas occupational health services are more akin to primary health care provision. If intervention measures had more impact on less serious disease, this could produce different trends in incidence. Furthermore, we suggest that capacity constraints within the UK NHS, where there are often waiting lists for specialist referral, may mean that a steady flow of patients to NHS specialists is maintained regardless of true changes, and therefore blunting true trends; this may be even more marked for tertiary referrals which are probably more common in our core reporter data. These differences between schemes suggest that true changes in work-related disease in the UK might lie somewhere between workplace and hospital-based figures.
Other UK data collection systems are probably less valid for judging UK trends in these work-related diseases. Incidence data from the Self-reported Work-related Illness surveys,19 in which members of a representative sample of households report illnesses in the last 12 months which, in their opinion were “caused or made worse by work”, can only be compared for 2001 and 2004 due to methodological changes over time and lack diagnostic specificity; over the 3 years, the incidence of skin problems fell from 13 (95% CI 8 to 18) to 10 (95% CI 6 to 15) per 1000 ever employed,19 while breathing or lung problems fell from 35 (95% CI 27 to 43) to 19 (95% CI 13 to 26) per 1000 ever employed.19 Data on compensated cases of occupational asthma, pneumoconiosis and mesothelioma are collected under the Industrial Injuries Schemes (IIS). A government publicity campaign was said20 to have determined a doubling in the number of compensated cases of pneumoconiosis after 2000, but there was little evidence of effect on SWORD trends. Compensated cases of occupational asthma in the IIS were only one third the number of SWORD cases: they increased by +4% (95% CI 1 to 7) a year during 1999–2005.21 Mesothelioma deaths increased by 4% a year (95% CI 3 to 5) during 1999–200422 compared to 1.2% (95% CI −0.3 to 2.8) for SWORD in the same period but reflect past incidence.
In this paper we have addressed only one of the many objectives of surveillance23 and one particular approach to it. We hope that our work stimulates further investigation into the advantages and limitations24 of other methods for judging trends in work-related disease.
REFERENCES
Footnotes
Funding: Partially funded by the UK Health and Safety Executive (grant no. 4307/R56.096).
Competing interests: None.
Ethics approval: Ethics approval was given by the UK MREC 02/8/72.