Article Text

Abstract
Objectives: To estimate excess mortality during heat waves and cold spells, and to identify vulnerable population groups by age and cause of death.
Methods: Daily mortality in Moscow, Russia from all non-accidental, cardiovascular and respiratory causes between January 2000 and February 2006 was analysed. Mortality and displaced mortality during cold spells and heat waves were estimated using independent samples t tests.
Results: Cumulative excess non-accidental mortality during the 2001 heat wave was 33% (95% CI 20% to 46%), or approximately 1200 additional deaths, with short-term displaced mortality contributing about 10% of these. Mortality from coronary heart disease increased by 32% (95% CI 16% to 48%), cerebrovascular mortality by 51% (95% CI 29% to 73%) and respiratory mortality by 80% (95% CI 57% to 101%). In the 75+ age group, corresponding mortality increments were consistently higher except respiratory deaths. An estimated 560 extra deaths were observed during the three heat waves of 2002, when non-accidental mortality increased by 8.5%, 7.8% and 6.1%, respectively. About 40% of these deaths were brought forward by only a few days, bringing net mortality change down to 3.2% (95% CI 0.8% to 5.5%). The cumulative effects of the two cold spells in 2006 on mortality were significant only in the 75+ age group, for which average daily mortality from all non-accidental causes increased by 9.9% (95% CI 8.0% to 12%) and 8.9% (95% CI 6.7% to 11%), resulting in 370 extra deaths; there were also significant increases in coronary disease mortality and cerebrovascular mortality.
Conclusions: This study confirms that daily mortality in Moscow increases during heat waves and cold spells. A considerable proportion of excess deaths during heat waves occur a short time earlier than they would otherwise have done. Harvesting, or short-term mortality displacement, may be less significant for longer periods of sustained heat stress.
Statistics from Altmetric.com
It has been suggested that climate change, which has already affected some indicators of human health,1 is responsible for the growing frequency and extent of weather extremes. Therefore, this paper begins first with a description of climate warming in Moscow to establish the increasing trend of more days with extreme temperatures.
Studies of temperature/mortality relationships may be subdivided into time-series analyses of large arrays of consecutive daily data and analyses of discrete events. A time-series analysis establishes the range of linear increase in mortality that occurs with each fall of 1°C in outdoor temperature below the point of maximum comfort (the minimum of the mortality/temperature curve) or with each 1°C increase as the temperature rises above this point.2 3 However, there is evidence that excess mortality during temperature extremes is greater than predicted by linear models of mortality increase.4 For this reason, discrete weather events, such as heat waves and cold spells, must be excluded from time-series analysis and examined separately.
Heat waves
One formal definition of heat wave from the Netherlands5 proposes that the maximum temperature should be at least 25°C for 5 consecutive days, and on 3 or more of those days the maximum temperature should reach at least 30°C. Numerous studies of heat waves began with the famous 5-day Chicago heat episode in 1995, during which the number of daily deaths increased by 85%.6 The unusually extreme heat wave in August 2003 in Europe was associated with a 60% increase in cumulative daily mortality between 4 August and 20 August in France.7 In London, the same heat wave brought about 17% excess deaths for all ages, and 59% excess deaths in the 75+ age group.8 However, all these percentage increases should be viewed in light of a possible mortality displacement effect. Loss of life during and soon after a heat wave is often followed by a period of reduced mortality, which suggests that people who succumb to heat stress would have nevertheless died within a very short time in normal weather conditions. For example, a study in the Czech Republic concluded that harvesting, or short-term mortality displacement, accounted for about half of the total number of excess deaths during the 1994 heat waves.9 A temporary morality deficit can continue over the following few weeks after an extreme temperature event.10 By analysing both the time series of daily mortality and discrete weather events, we estimated the magnitude and duration of the harvesting effect in Moscow.
Cold spells
Cold spells, being quite rare events, have been given less attention by researchers than heat waves. A study in Sofia11 defined extremely cold temperatures as those below the 10th percentile of the distribution of daily average temperatures (−0.5°C in Sofia); mortality in Sofia increased by 1.83% for each degree the temperature dropped below the 10th percentile. Another study in the Netherlands5 defined a cold spell as a period of at least 9 days with a minimum temperature of −5°C or lower, of which at least 6 days have minimum temperatures of −10°C or lower. In such cold spells the authors reported a 12.8% average excess mortality among the Dutch population, which was largely attributable to an increase in cardiovascular disease mortality and mortality among the elderly. The unusually cold winter of 2006 gave us a unique possibility to investigate the impact of cold spells on mortality in Moscow.
The aim of this study was to identify heat waves and cold spells and analyse their impacts in terms of excess mortality and mortality displacement.
METHODS
Data
The study period consisted of 2251 consecutive days from 1 January 2000 to 27 February 2006. Maximum and average daily temperatures were obtained from the Moscow State University weather station. Death certificates were obtained from the Center of Demography and Human Ecology of the Institute of Economic Forecasting of the Russian Academy of Sciences. The causes of death were reported in ICD-10 format (Tenth Revision of the International Classification of Diseases). Daily mortality counts for the study period were constructed for deaths from all non-accidental causes (total mortality minus external causes), ischaemic (coronary) heart disease and stenocardia (angina pectoris), cerebrovascular diseases and chronic lower respiratory diseases. Mortality data were available for all ages, as well as for the age groups 60–74 and 75+. Although it is common in public health literature to study the 65+ age group (which corresponds to retirement age in most Western countries), we could not stratify data for this age group. Therefore, we carried out analyses for all ages and the 75+ age group. The input of the 75+ age group in all-age mortality is significant: this group represents 42.7% of mortality from all non-accidental causes, 54.2% of ischaemic heart disease mortality, 59.8% of cerebrovascular disease mortality and 40.9% of respiratory disease mortality.
Temperature anomalies
For each summer month, we calculated the 95th percentile of the historical distribution of daily average temperatures, using data for 1961–1990. The days with average temperatures above this threshold were described as extremely hot, as their probability was less than 5%. Then we constructed the sample of the number of days with temperatures above this threshold during each summer month of the study period (2000–2005) and used a one-sample t test to prove that the mean of this sample is significantly greater than 1.5 (the expected number of extremely hot days per month). The same approach was used to assess the number of extremely cold days in winter, which were defined as those with temperatures below the 5% centile of the historical distribution of daily average temperatures during each winter month.
Definition of discrete events: heat waves and cold spells
We required that during a heat wave the average daily temperature be above the 97th percentile of the long-term distribution of daily average temperatures during 5 consecutive days, of which at least 3 days have average daily temperatures above the 99th percentile. Similarly, we defined a cold spell as a period of at least 9 consecutive days with daily average temperatures below the 3% centile, of which at least 6 days have daily average temperatures below the 1% centile. During the study period January 2000–February 2006, the 1% centile in Moscow was −19.3°C, the 3% centile was −14.4°C, the 97% centile was +22.7°C, and the 99% centile was +25.0°C. The two definitions differ in exposure times in that a cold spell is a somewhat longer event than a heat wave. Both definitions are based on locally collected statistics on long-term distributions of average daily temperatures, which seems quite reasonable because these definitions are used in site-specific studies and are applied to local populations.
Independent samples t tests
To identify the period of excess mortality during and shortly after each heat wave or cold spell, we plotted the difference between the daily mortality rate (smoothened with a 3-day moving window) and the expected background value. Then we constructed a case sample of daily mortality rates during this period. For example, when we estimated excess mortality during a heat wave, the case sample consisted of daily mortality counts during the heat wave, plus 1 or 2 days after the heat wave, while the control sample consisted of daily mortality counts on the same calendar dates during the remaining years of the study period. Thus, the control sample always represented a proxy for the expected seasonal background mortality. Having applied Levene’s test of equality of variances of the two samples, we tested the following null hypothesis: the means of the two samples are equal. If we were able to reject the null hypothesis at the 95% level of statistical significance, then cumulative excess mortality was calculated as the ratio of actual to expected cumulative mortality during these periods and expressed as a percentage. This measure was used to describe the relative severity of heath effects during each episode of extreme weather.
Harvesting
Harvesting occurs during the heat wave or cold spell and causes the death rate to be lower than expected for a few days after the period of extreme weather has ended. These few days provide evidence of harvesting. We studied this effect in two steps. First, we estimated the length of the time period during which the mortality deficit might be expected after the event. Then, constructing the case sample of mortality counts (smoothened with a 3-day moving window) over this period, we used independent samples t tests to prove that there was indeed a statistically significant reduction in mortality.
To estimate the likely period of reduced mortality after the heat waves, we studied the history of heat-related deaths from all non-accidental causes, using the Poisson unconstrained distributed lag model:
Ln(Mi) = const+β0Ti +β1Ti-1+β2Ti-2+… + (1),
where Ti denotes mean daily temperature on day i, and log-transformed daily deaths Mi were used to produce a normally distributed error . It should be emphasised that the time-series analysis under model (1) included all days during the study period with daily mean temperatures above 18°C, not just the periods of extreme heat. As was shown in previous studies, this threshold temperature was the minimum point of the mortality/temperature curve in Moscow, after which a J-shaped increase in daily mortality with temperature has been observed.12
To study the history of cold-related deaths, all days with daily mean temperatures lower than −10°C were fitted in model (1).
RESULTS
Extreme temperatures in Moscow
Table 1 shows the numbers of extremely hot and extremely cold days during the study period.
In general, the last six summers (2000–2005) in Moscow were hotter than the long-term norm. During the study period, the average number of summer days with extremely high temperatures was 4 days per month. A one-sample t test showed that the difference between the observed and the expected number of extremely hot days was not significant at the 95% level (p = 0.07). However, this difference becomes significant if the test sample is constructed only for July and August of 2000–2005 (6 extremely hot days per month, p = 0.032), or if we exclude the summer of 2000 from the original test sample. Thus, we may conclude that weather warming in Moscow is associated with a growing frequency of summer temperature anomalies. At the same time, the average number of days with extremely low winter temperatures between 2000 and 2005 was within the norm, and only the winter of 2006 brought two cold spells.
Heat waves
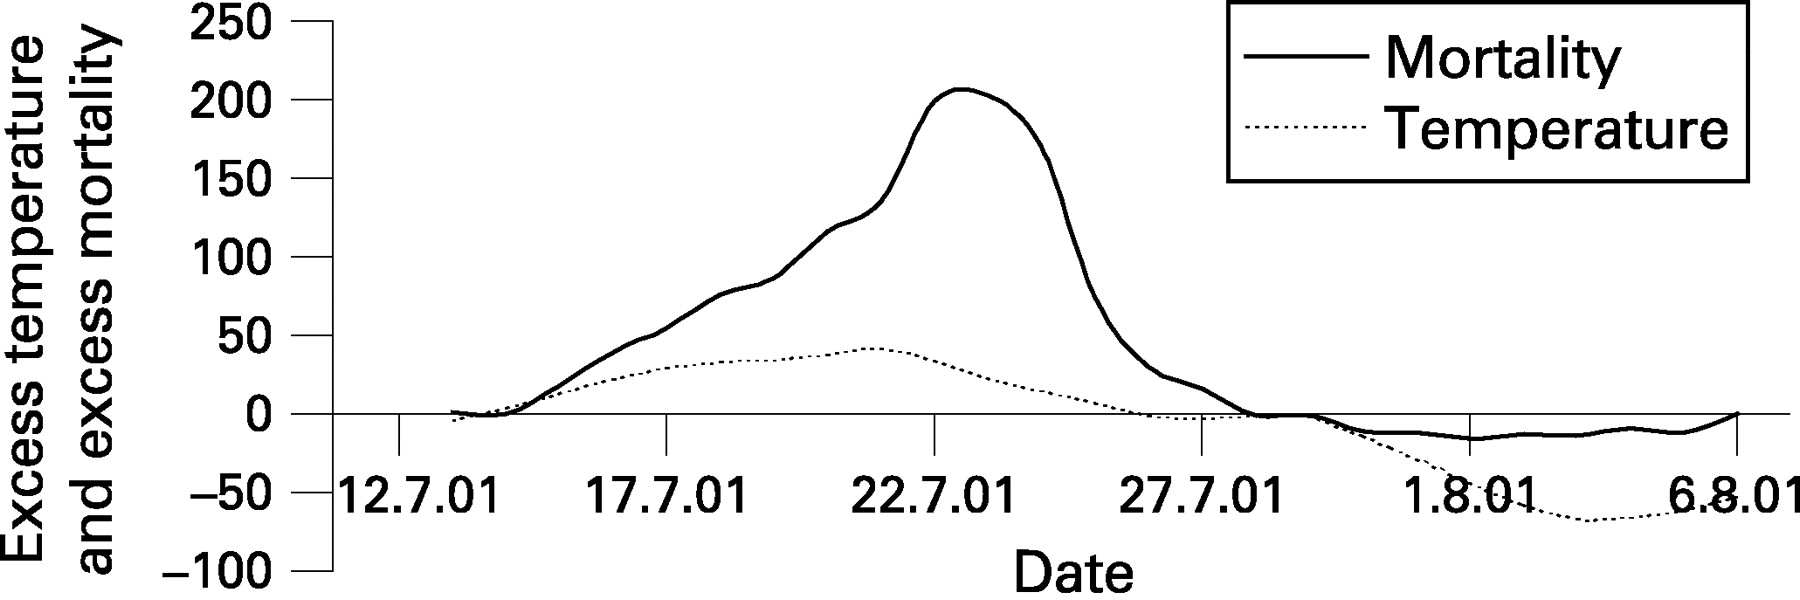
During the study period we identified four heat waves, one in 2001 and three in 2002. In July 2001, daily average temperatures exceeded 25°C for 9 consecutive days (the norm is only 3 days per year). Maximum daily temperatures on these days always exceeded 30°C. The heat wave of July 2001 was truly exceptional both in temperatures and length. Daily excess non-accidental mortality at its peak (on July 23) was 93%. Cumulative excess daily mortality from non-accidental causes among all ages from 15 July to 27 July was 33%, or about 1200 deaths.
In July and early August of 2002, we observed three closely adjacent heat waves, separated by 4-day and 2-day periods of relief. Cause- and age-specific cumulative excess mortality rates for the July 2001 heat wave are summarised in table 2, and the 2002 heat waves in table 3.
Harvesting after heat waves
A time-series analysis in the framework of model (1) showed that the excess in all-cause mortality persisted for 2 days after each day with a mean temperature greater than 18°C, and was followed by mortality deficits. Summed up over the course of 20 days, the risk of death was 2.1% per degree greater than 18°C, and 90% of the mortality deficit occurred on days 3–12 after the heat stress. This result defined the time frame for observation of mortality displacement after the heat waves. According to linear model (1), short-term displaced deaths should constitute about 40% of total heat-related mortality.
Figure 1 shows the harvesting effect after the 2001 heat wave. The deficit of non-accidental mortality below the expected value was observed for 9 days in a row, on days 3–11 after the heat wave, which agrees with the previously cited analytical result. However, the size of this deficit was quite modest. The cumulative deficit of mortality was 105 deaths (p<0.001), so the estimated contribution of short-term mortality displacement to the total heat wave death toll was only 9% (95% CI 4.8% to 13%).

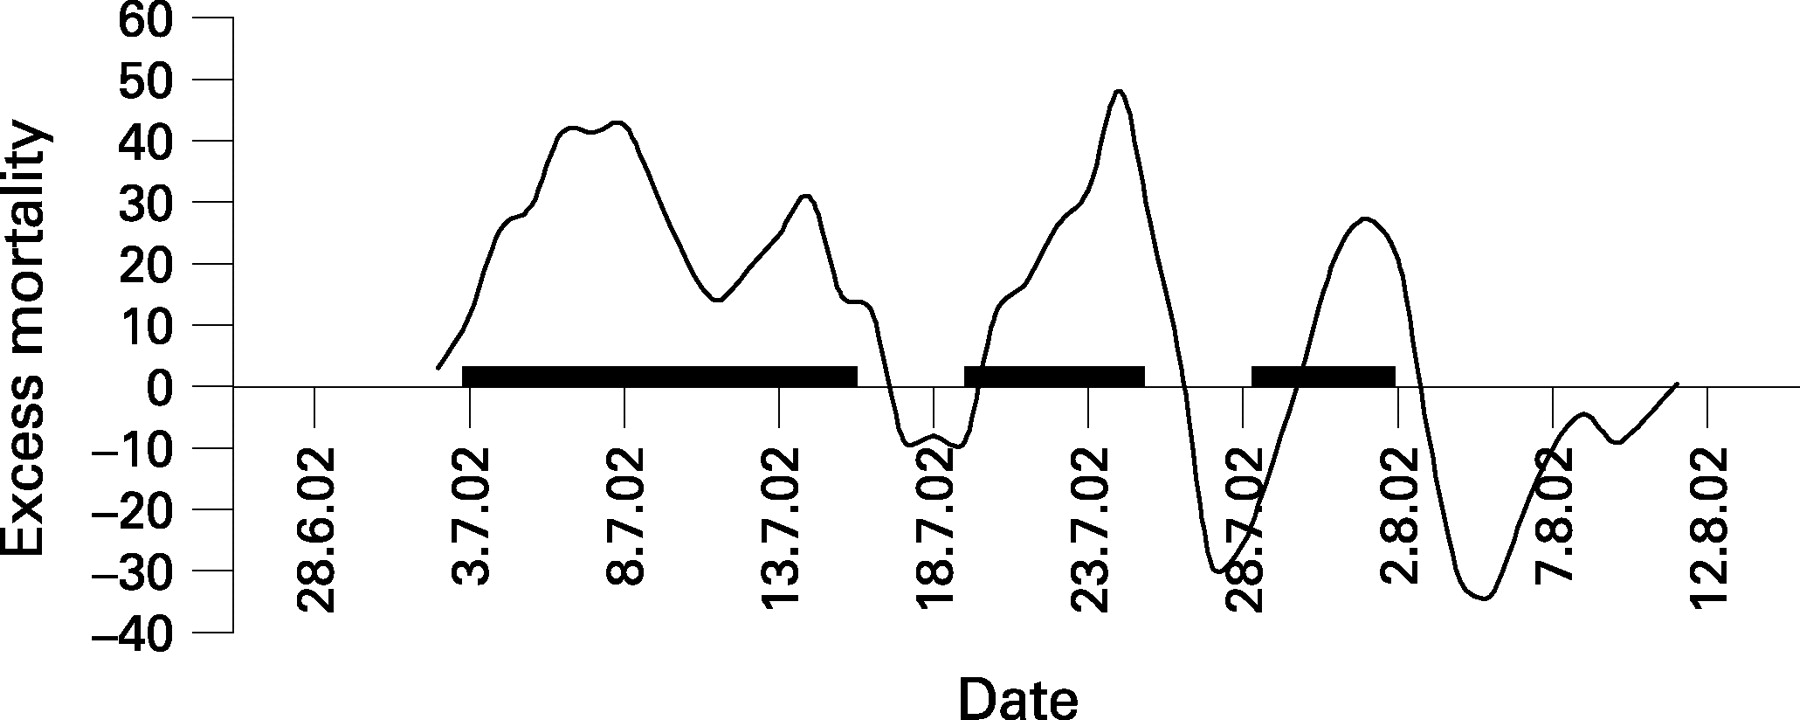
In contrast, the harvesting effect during the heat waves of July 2002 seems to be quite significant. Figure 2 shows the three waves of excess mortality, each followed by periods of mortality deficit. The periods of mortality deficit following a heat wave overlap with periods of mortality increase during the next heat wave. This overlapping explains why the crests of excess mortality become lower with each subsequent heat wave, while the dips after each wave, or periods of reduced mortality, become ever more pronounced (fig 2). Due to short-term mortality displacement, the overall effect of the 2002 heat waves was modest but still statistically significant: cumulative excess non-accidental mortality among all ages between 3 July (the beginning of the first heat wave) and 11 August (the end of the period of reduced mortality after the third heat wave) was only 3.2% (95% CI 0.8% to 5.5%). Many estimated extra deaths (216 out of 558) were brought forward only by a brief period of time, as fig 2 suggests. Thus, about 39% of deaths were accounted for by short-term displaced mortality, which is in good agreement with the linear model. In retrospect, the heat waves of 2001 and 2002 look quite different in terms of their health outcomes. The heat wave of 2001 was very long and truly exceptional in that it lasted for 12 days, and this determined its high death toll. However, the heat wave of 2002 consisted of three episodes, divided by short periods of relief, which actually saved a great many lives.

Cold spells
In line with our definition, we identified only two cold spells during the study period. These were observed in 2006 and were divided by a short break (6 days). From 16 January to 25 January, there were 10 days with temperatures below −14.4°C, of which 6 consecutive days had temperatures below −19.3°C, and the 3 coldest days had mean temperatures of −28.0°C, −27.7°C and −26.4°C. This first wave of cold was quickly followed by another, which was even longer but less severe (the 3 coldest days had mean temperatures of −25.2°C, −21.8°C and −24.6°C). From 1 February to 16 February, there were 16 days with daily average temperatures below −14.4°C, of which 8 consecutive days had temperatures below −19.3°C. The health effects of these two cold waves markedly lagged behind them by 5–6 days. Response mortality waves were registered correspondingly from 21 January to 31 January, and from 6 February to 20 February, respectively. Table 4 shows cumulative excess mortality above the background (expected) value, which in this case is defined as the long-term (2000–2005) averages of daily mortality from 21 January to 20 February. The effects were statistically significant at the 95% level only for the elderly. Respiratory deaths did not show a significant increase during the cold spell.
As Table 4 shows, excess mortality from all non-accidental causes, ischaemic heart disease and cerebrovascular diseases was registered for both cold waves, and the first wave, being more severe, was also more harmful. We established that people with cardiac and vascular diseases are the most vulnerable to very cold weather. In general, about 370 excess deaths among the elderly were directly attributable to extremely cold temperatures in the winter of 2006. The effects of cold waves on mortality among all ages were not statistically significant, but one may expect that total excess deaths in all ages will be approximately twice as much as we established for the 75+ age group.
Harvesting after cold spells
The distributed lag model (1) showed that the excess in mortality persisted for 16 days after each day with a mean temperature lower than −10°C and was followed by a period of reduced mortality on days 17–21. Summed up over the course of 28 days, the risk of death was 1.6% for each 1°C drop in daily average temperature below −10°C, which agrees with the previously mentioned result from Sofia11 (1.83%). However, the size of the harvesting effect after cold stress (ie, the proportion of short-term displaced deaths) predicted by the linear model was quite small at less than 5%. We found no forward displacement of deaths after the cold spells of 2006.
DISCUSSION
A principal finding of this study was the established increases in mortality rates during extreme weather events above their respective background values. Our task may appear fairly simple at first glance, but the natural variability of daily mortality rates presents a major obstacle and often conceals the small increments that we are looking for. However, the unprecedented magnitude and duration of the observed weather extremes in Moscow helped us to establish some important patterns and uniformity of health outcomes.
A strong point of this study was the comparison of observed mortality with mortality predicted by linear models. The mortality displacement effect, predicted by the linear model with distributed lags in Moscow, was similar to that previously observed in London, where, after each day with a temperature greater than 20°C, “excess of deaths prevailed for only 2 days and were followed by deficits”.13 It should be emphasised that the effect of the 2001 heat wave was highly non-linear. Indeed, only about one third of excess deaths between 15 July (the beginning of the heat wave) and 6 August (the end of the mortality deficit period after the wave) may be explained in terms of linear regression equation (1). Such non-linearity has been previously observed in London.4 In contrast, the overall effect of the three heat waves of 2002 in Moscow, including periods of reduced mortality after each heat wave, was slightly smaller than predicted by linear model (1).
We did not attempt to estimate the percentage of excess mortality during the heat waves that was attributable to the observed concurrent increases in daily atmospheric concentrations of airborne fine particulates and especially ozone in Moscow. While some might consider this a weakness of the study, our objective was to measure the excess mortality during heat waves without artificially dividing it into effects of pollution and effects of heat.
The unusually severe heat wave of July 2001 provided some important insights into the nature of the risks of climate warming. We proved that people with respiratory diseases are at greatest risk, while the second-greatest risk is associated with cerebrovascular disease. The results of tables 2 and 3 also show that the elderly suffer more during heat waves. Our estimates of excess mortality during the heat wave of 2001 (33% for all non-accidental causes and 51% for cerebrovascular disease mortality) are quite close to those obtained in an Italian study of the 1983 Rome heat wave14 (35% and 59%, respectively). We conducted a sensitivity analysis of excess non-accidental mortality during this heat wave, assuming that the background expected mortality rates could be estimated using longer time windows than previously described in the Methods section. Specifically, we took average daily mortality in July of 2000, 2003, 2004 and 2005 as the background mortality rate (excluding 2001 and 2002 because of the heat waves) and found that excess mortality fell only by 1%, from 33.4% to 32.5%. Therefore, the health effect of this heat wave was rather insensitive to the definition of baseline mortality.
The heat waves of July–August of 2002 in Moscow were not that devastating: their cumulative mortality effect was rather typical in the context of international studies. Because each subsequent heat wave was shorter than the previous one, the level of significance of its health effects diminished. The reader may notice that the confidence intervals gradually get wider as we glance from the top to the bottom of table 3. Nevertheless, the increase in all non-accidental deaths remains statistically significant for all three heat waves in 2002, and may be compared to the results of foreign studies. For example, daily deaths in England and Wales during the 1995 heat wave rose 11.2% above the long-term average,15 while a study in the Netherlands reported that average total excess mortality during the heat waves between 1979 and 1997 was 12.1%.5 Our results also agree with those of a Belgian study16 which concluded that excess mortality during the 1994 heat wave in Belgium was 9.4% in the 0–64 age group and 13.2% in the 65+ age group, of which about 15% was attributed to short-term mortality displacement. Overlap between periods of reduced mortality following the heat wave and periods of elevated mortality during the subsequent heat wave is a likely explanation for the fact that the observed number of deaths during and after the heat waves of 2002 was even less than predicted by linear regression model (1). In fact, our conclusion of an approximately 3.2% net increase in the number of deaths after the heat waves of 2002 closely matched the estimate in the Czech study (1%).17
However, our definition of heat waves, being more restrictive, would have ruled out most of the 17 heat waves observed in the Czech Republic during the period 1982–2000, which averaged one wave per year. In light of this finding, we conducted a sensitivity analysis with respect to the definition of heat wave that we used in this paper. We relaxed our definition, and required that daily average temperatures be above the 95th percentile (22.0°C) for 5 consecutive days, of which at least 3 days should have temperatures above the 97th percentile (instead of the 97th and 99th percentiles). Having applied the relaxed definition, we identified only one new heat wave, which lasted for 5 days between August 19 and August 23 in 2004. Cumulative excess mortality during this wave was 8.5% (95% CI 5.3% to 11.7%), which was quite close to the estimates reported in table 3. Therefore, the relaxation of our definition did not significantly change the results. Please note that our definition of a heat wave uses the threshold temperature 22.7°C, which matches the 95th percentile of the historical distribution of daily average temperatures in July between 1961 and 1990. Therefore, our definition requires that the temperatures during a heat wave should be extremely high for the local population, adapted to historically observed weather patterns.
Main messages
-
During five recent summers (2001–2005) in Moscow, the number of extremely hot days per month was four times greater than the long-term average.
-
This study provides quantitative information relevant to the prediction of the health effects of extreme weather events.
-
Daily deaths in Moscow during the 2001 heat wave rose 33% above the seasonal average; the effect was greater for respiratory disease (80%), cerebrovascular disease (51%) and the elderly (45%).
-
During the 2006 cold spell, mortality among the elderly increased by 9% with respect to the seasonal long-term expected value.
Policy implications
-
There is a need to issue timely weather alerts when heat waves and cold spells are expected to provide better protection for the elderly and for patients with cerebrovascular and respiratory diseases.
-
The implementation of heat emergency plans in Moscow may save several dozens of lives per day during a severe heat wave.
Our definition of heat wave basically follows the Dutch study5 but it is based on daily average temperatures instead of daily maximum temperatures, because we believe that average temperatures better reflect the overall heat stress burden than either daily maximum or minimum temperatures. However, this may be considered a limitation of our study. For example, other authors have emphasised the importance of the harmful effects of high night-time temperatures during heat waves.14 In another work, we consider the relative importance of daily maximum and minimum temperatures as the explanatory variables.18
Our definition of a cold wave requires that temperatures are below the 1% centile at least for 6 days. This is a highly restrictive requirement, which implies that cold waves are quite rare events as by definition they cannot be observed every year, because the 1% centile “cuts off” only the 3 coldest days per year. We conducted a sensitivity analysis with respect to relaxation of this definition, both in terms of temperature thresholds and duration of a cold spell. First, we replaced the 1% and 3% centiles with 3% and 5% centiles, but no new cold spells were identified under the new definition. Then we relaxed the duration requirement and required that a cold wave lasts for 5 days (or more) with temperatures below the 3% centile, of which at least 3 days have temperatures below the 1% centile. However, no new cold spells were identified under this definition either. Therefore, we concluded that our results (the number of cold spells identified) were insensitive to the definition of a cold spell.
Concerning the scale of health effects, our estimates of excess mortality among the elderly during cold waves (9.9% and 8.9%) are quite close but somewhat lower than that obtained for average excess mortality during cold waves among the Dutch population (12.8%).5 In line with the geographical trends of mortality established in the Eurowinter study, this may be explained by the fact that the Russian population is more accustomed to extreme cold weather. Our results for Moscow also confirmed the conclusion of the Dutch study that excess mortality during cold spells was mostly attributable to an increase in cerebrovascular disease mortality and mortality among the elderly.
The delayed effects of extremely cold weather on mortality make it difficult to observe reductions in mortality after cold waves. In the particular case of the two 2006 cold waves, the expected mortality deficit after the first wave should have taken place during the second wave. Comparison of tables 3 and 4 showed that the health effect of each subsequent heat wave/cold spell was smaller than the effect of the previous spell, provided these spells were divided by short periods of relief. This seems to be a general rule, previously described in the literature.19
Compared to Western countries (including USA and Canada), Russia is colder with a more continental climate. Thus, the population of Moscow is likely to be better adapted to the impacts of temperature extremes. Despite such adaptation, there is a need to minimise the established health risks of climate warming and temperature extremes. Henceforth, Russia needs to develop heat and cold emergency plans, like that recently implemented in France or similar to the heat-watch-warning system adopted in US cities.20 Temperature stress conditions are predictable, and heat and cold stress mortality is preventable.
Acknowledgments
Research for this article was supported by Environmental Defense. The authors thank Dr A Golub and Dr E Strukova at Environmental Defense for guidance, advice and comments. Mortality data were obtained from Dr T Khorkova from the Center of Demography and Human Ecology of the Institute of Economic Forecasting of the Russian Academy of Sciences. Meteorology data were provided by Professor A Isaev and his colleagues from the weather station at Moscow State University.
REFERENCES
Footnotes
-
Competing interests: None.