Article Text

Abstract
Objectives: NO2 is a major urban air pollutant. Previously reported associations between ambient NO2 and children’s respiratory health have been inconsistent, and independent effects of correlated pollutants hard to assess. The authors examined effects of NO2 on a spectrum of 11 respiratory symptoms, controlling for PM10 and SO2, using a large pooled dataset.
Methods: Cross sectional studies were conducted in Russia, Austria, Italy, Switzerland, and the Netherlands, during 1993–99, contributing in total 23 955 children. Study-specific odds ratios for associations with ambient NO2 are estimated using logistic regressions with area-level random effects. Heterogeneity between study-specific results, and mean estimates (allowing for heterogeneity) are calculated.
Results: Long term average NO2 concentrations were unrelated to prevalences of bronchitis or asthma. Associations were found for sensitivity to inhaled allergens and allergy to pets, with mean odds ratios around 1.14 per 10 μg/m3 NO2. SO2 had little confounding effect, but an initial association between NO2 and morning cough was reduced after controlling for PM10. Associations with reported allergy were not reduced by adjustment for the other pollutants. Odds ratios for allergic symptoms tended to be higher for the 9–12 year old children compared with the 6–8 year old children.
Conclusions: Evidence for associations between NO2 and respiratory symptoms was robust only for inhalation allergies. NO2 most likely is acting as an indicator of traffic related air pollutants, though its direct effect cannot be ruled out. This remains important, as policies to reduce traffic related air pollution will not result in rapid reductions.
Statistics from Altmetric.com
Links between pollution and health are hardly doubted since the disastrous great London Smog and similar incidents, yet uncertainties remain about risks at lower concentrations.1 There is also considerable debate about the pollutants responsible for observed health effects. In the recent decade much attention has been given to ambient particles, often characterised by the concentration of PM10 or PM2.5. NO2 is one of the major gaseous air pollutants, which continues to raise concern, and it is one of the two pollutants regulated by the European Union (PM10 being the other).1 Though NO2 is related to combustion processes in general, in outdoor urban environments, NO2 is considered a marker for the complex of traffic related pollutants. NO2 characterises the spatial variation of traffic related air pollution better than PM10 or PM2.5, and observed health effects of urban air pollution characterised by NO2 have extended from impairment of lung function growth up to premature respiratory death.2,3
Most research on NO2 and children’s health investigates acute effects. Several studies of asthmatic children found NO2 related increases in attacks.4–7 Some found associations with other symptoms, but no asthma exacerbation.8,9 The large PEACE study found no consistent NO2 effects on respiratory symptoms or lung function.10 Several studies found effects of other pollutants, but not NO2.11–13
Within the literature from cross sectional studies, NO2 is most clearly linked to cough, with consistent reports of positive (if sometimes weak) associations.14–16 Slightly less evidence is found overall for an association with bronchitis, with Peters reporting a weak negative association, while others show evidence (mostly weak) of a positive association.14–17 Estimates of associations with asthma and wheeze have been small and therefore, although varying in direction, not inconsistent with each other.14–20 Gauderman reports associations between asthma and measured NO2, and between asthma and residence close to freeways, where traffic levels are extremely high, but no association with residence close to ordinary roads.21
In the atmosphere, NO2 is correlated with other pollutants including PM10 and PM2.5, because of similar sources. Pollutants’ independent effects are infrequently reported, because of their intercorrelations. Fusco found some independent NO2 effect on acute respiratory infections.22 Braga found independent PM10 effects only.23 Some reported NO2 effects may be due to associations with other pollutants such as ultrafine particles or diesel soot.
The Pollution and the Young (PATY) project assembled health and exposure data for 58 561 children, from comparable cross sectional studies conducted in 12 countries. Pooling original data allows harmonisation of analysis, pursuit of research questions not addressed originally, and inclusion of unpublished studies. Here we examine associations between NO2 and symptoms, in those PATY studies with NO2 exposure data: 23 955 children aged 6–12, from five countries. We present results from single- and multipollutant models, exploiting the opportunity this pooled study gives to attempt to assess effects of NO2, adjusted for other major pollutants (SO2 and PM10). We further make use of the large dataset to assess effect modification with more precision than single studies.
METHODS
Study subjects and study design
Cross sectional studies were sought which: assessed respiratory symptoms and individual risk factors by questionnaire, included cough and wheeze as outcomes, and allowed calculation of annual mean particulate matter measures by study area. Table 1 describes the studies contributing to this paper, detailed in individual reports.2,24–27
Details of component studies included in analyses
Eleven comparable outcomes were identified: wheeze in last year, asthma ever, bronchitis in last year, phlegm, nocturnal dry cough in last year, morning cough in last year, “sensitivity to inhaled allergens”, hay fever ever, itchy rash ever, “woken by wheeze in last year” and “allergic to pets”. Full wordings have been reported previously.28
The exposure of interest for each child was the annual mean level of NO2 in the corresponding study area.
Exposure assessment methods
NO2 exposure was assessed by measurements at fixed ambient monitoring sites. In Austria, NO2 concentration data from eight monitoring stations across the city of Linz were obtained from the routine network operated by the State of Oberoestereich (OOE Luftmessnetz). NO2 is measured with continuous chemiluminescence monitors. In Switzerland, averages were taken of existing passive sampler measurements from each community.24 Measurements were made within the other studies themselves, using passive samplers. Italian and Dutch measurements were school based.26 Russian measurements were performed at a central site per area. Arithmetic annual means were calculated. Using standard questionnaires, monitoring sites and sampling/analysis methods were assessed.
Analysis
A two-stage approach was used. First, study-specific NO2 effects were estimated using logistic regression, with area-level random intercept. In stage two, these estimates and standard errors were entered into a meta-analysis, obtaining a mean estimate, and a measure and Cochran χ2 test of heterogeneity. Study-specific effects are assumed to follow a random distribution about a mean. Estimation of this mean (and confidence interval) takes into account both between-study variation in effects and uncertainty (due to sampling variability) of study-specific estimates.29 Analyses were done in STATA v8 (Stata Corp, College Station, TX, USA). Odds ratios are reported per 10 μg/m3 increase in NO2.
We controlled for age, sex, maternal education, paternal education, household crowding, current parental smoking, mother smoking during pregnancy, gas cooking, unvented gas/oil/kerosene heater, mould, nationality, birth order, and “ever had a pet”. Additional models adjusted for PM10 and (separately) SO2. Parental illnesses may be a confounder, but over adjustment can occur, since the exposure of interest could affect both children and parents. We tested robustness of results to controlling for season of questionnaire, parental illness, and differences in response rates per study area. We also tested for effect modification by sex, age, and (since these illnesses may have a strong genetic component) by parental asthma or allergy.30
Meta-regressions assessed associations between study-specific estimates and study characteristics. These potential sources of heterogeneity between estimates were: study period; between-city, within-city, or mixed design; location of monitoring station; proportion of younger children (6–8); questionnaire date variability across study areas; high response rate (80+%); response rate variability across study areas.
Individual PATY studies measured different combinations of pollutants, which meant dropping some studies in multipollutant analyses. We present single pollutant results from the full set of five studies, and consider these the “best estimates” of unadjusted effects (that is, unadjusted for other pollutants). Within the smaller subset of studies with data available on a second pollutant, we compare results from one- and two-pollutant models, to show the degree of uncontrolled confounding in the single-pollutant model. We do not attempt a three-pollutant model, since a maximum of three studies (only two or one for some outcomes) would be included. We maintain our focus here on associations with NO2. However, we include mean odds ratios for PM10 and SO2 to aid the interpretation of results from two-pollutant models.
RESULTS
Study areas in the Netherlands, Austria, and Russia had the least variability in NO2 levels (and also in PM10 levels). Russian study areas had the lowest recorded NO2, Italy the highest and the most variable (fig 1). Russian study areas had the highest, and most variable, levels of SO2 (table 1). Of the three pollutants, mean PM10 levels varied the least across the studies. Symptom prevalence was highest in Switzerland and the Netherlands (and correspondingly more variable) (table 2). Response rates varied between study areas (table 1). All area level response rates were above 90% in Austria, Russia, and Italy, and more variable in the Swiss and Dutch studies.
Prevalences of the 11 outcomes

NO2 measures (μg/m3) per study area, within each country (averaged across three years, for Austria).
Single-pollutant models
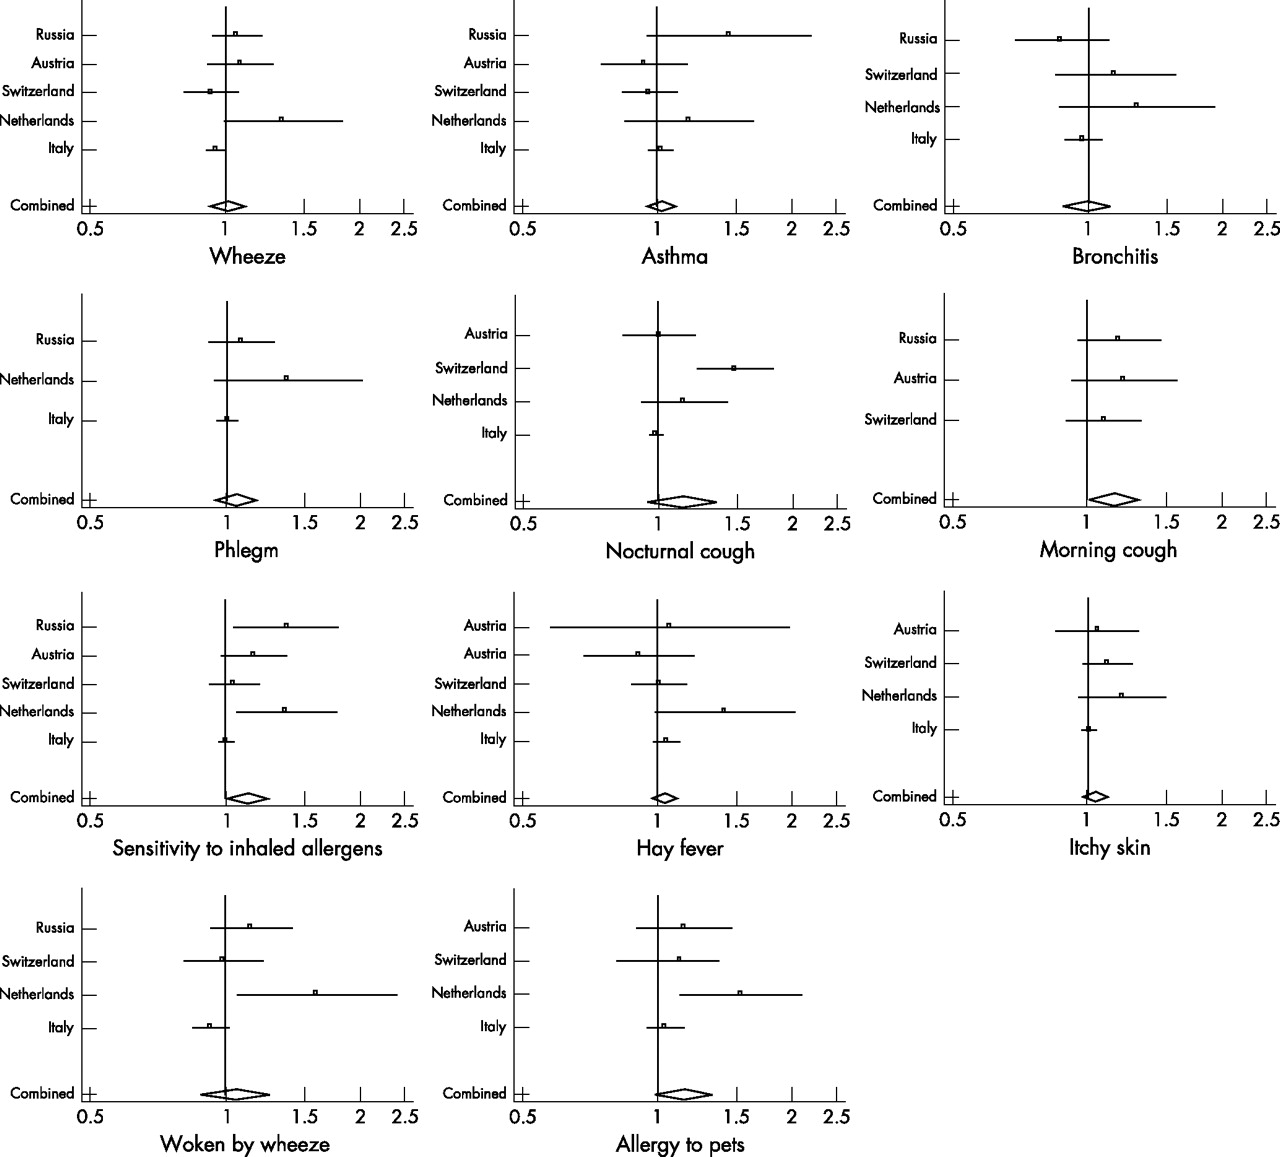
Figure 2 shows study-specific and mean odds ratios. Dutch estimates were often the largest, those from Italy the smallest.
Forest plots of study-specific odds ratios, and mean odds ratios, for effects of NO2 on respiratory symptoms. Odds ratios (per 10 μg/m3 increase in NO2) are from single-pollutant models, but adjusted for individual risk factors. Vertical line indicates null (odds ratio of 1). Horizontal lines represent 95% confidence intervals of estimates. Diamond shape at bottom indicates position, and confidence interval, of the mean of the estimates.
No strong patterns of association were seen between NO2 and asthma or bronchitis. Study-specific odds ratios were on average small (with exceptions), spread above and below 1, mean estimates essentially null (fig 2, table 3). Similar pictures were seen for wheeze and “woken by wheeze”, though here study-specific results were larger, and heterogeneous. Nocturnal cough estimates were also heterogeneous.
Mean odds ratios (per 10 μg/m3 increase in NO2) from single-pollutant model, all available studies
For phlegm, hay fever, and “itchy rash”, estimates were predominantly above one, though some very small.
Stronger consistent associations were seen with morning cough, allergy to pets, and “sensitivity to inhaled allergens”, all with mean odds ratios around 1.14. For the latter, there was evidence of heterogeneity within this (entirely positive) set of results.
The Dutch, Swiss, and Russian studies analysed their data originally.22,25,26 The PATY results agreed closely with the original Dutch and Russian results, though original Swiss results for bronchitis (controlling for fog) were stronger.
Two-pollutant models
Correlation coefficients between NO2 and PM10 ranged from 0.48 in the Netherlands to 0.95 in Switzerland, with a mean of 0.74. For NO2 and SO2 they ranged from −0.07 in Russia to 0.84 in Switzerland, 0.47 overall.
Controlling for SO2 changed NO2 effect estimates little (table 4). Confounding, inconsistent in direction, was confined largely to Swiss results. The largest change was for bronchitis, the Swiss NO2 estimate reducing on adjustment from 1.14 (0.84–1.55) to 0.68 (0.46–1.01). Morning cough and “sensitivity to inhaled allergens” results were unaffected. For “allergy to pets”, while the confidence interval widened, the mean estimate was unchanged. Heterogeneity between results tended not to decrease after adjusting for SO2. A link was seen between SO2 and “itchy rash”, with an adjusted mean odds ratio of 1.11 (1.01–1.23). Other associations with SO2 (apart from the mean NO2 adjusted estimate for bronchitis, driven by a large effect in the Swiss study) appeared generally weak, or reduced by controlling for NO2.
Mean odds ratios (per 10 μg/m3 increase in pollutant) within subset of studies having both pollutant measures
PM10 proved a greater confounder, though direction was not consistent across studies. Swiss NO2 effect estimates (generally small) increased on adjustment. In the other studies they were mainly reduced. On adjusting for PM10, some mean estimates were robust or increased, particularly for itchy rash, “woken by wheeze”, allergy to pets and “sensitivity to inhaled allergens”. However, adjusting for PM10 reduced other estimates, notably for morning cough. Heterogeneity tended to decrease (though not always) on controlling for PM10. For example, among studies with PM10 data, I2, an estimate of that percentage of between study difference related to heterogeneity (and not chance), reduced from 54% to 0% for woken by wheeze, and 64% to 0% for sensitivity to inhaled allergens.31 For phlegm and itchy rash however, heterogeneity increased on adjustment for PM10. For PM10, a link (based on only two studies) was seen with phlegm, and raised risks—though not statistically significant—with bronchitis and morning cough.
Study period appeared related to between-study heterogeneity. For nine outcomes, mean estimates from pre-1995 studies (Italy, Switzerland) were lower than for later studies. The mean odds ratio for “sensitivity to inhaled allergens” was 1.01 (0.99–1.05) among earlier studies, 1.26 (1.11–1.43) among later studies. Higher mean estimates tended to relate to lower response rates (the Netherlands, Switzerland), to between-area variability in response rates (primarily the Netherlands, Switzerland), and to studies with monitoring sites close to traffic (the Netherlands only). All these differences are perhaps driven by high Dutch estimates and/or low Italian estimates, potential causes thus remaining indistinguishable.
Sensitivity analyses
Inclusion of response rate as a potential confounder did not affect effect estimates. Mean effect estimates for sensitivity to inhaled allergens changed from 1.13 (1.01–1.26) to 1.12 (1.00–1.25) after including response rate. Season of questionnaire was not related to reported illness, and did not confound associations between NO2 and symptoms (data not shown). Removing two traffic sites from the Austrian and Swiss data sets (which probably provide exposure estimates that are less comparable to the other sites in these studies), made small, non-significant changes to the estimates for some outcomes (others remained unchanged) in those countries: mean estimates for sensitivity to inhaled allergens, morning cough, and allergy to pets were slightly reduced, to 1.11 (0.99–1.24), 1.13 (0.99–1.29), and 1.11 (0.97–1.28) respectively.
Effect modification
Table 5 shows odds ratios for associations between NO2 and sensitivity to inhaled allergens (the variable with a significant main effect), for children categorised by potential effect modifiers. Effect estimates were consistently higher in the older children, though the difference with the younger children was of borderline significance only (p = 0.08). Similar non-significant differences were found for hay fever and pet allergy (table 6). Effect estimates were higher in boys than in girls, but the difference between boys and girls was highly non-significant (p = 0.43) and not supported consistently by other allergy outcomes (table 6). Parental health was related to the child’s health, but neither greatly confounded nor modified associations between child’s illness and NO2 (table 6).
Sensitivity to inhaled allergens: country specific and mean odds ratios (per 10 μg/m3 increase in NO2, from single-pollutant model), categorised by potential effect modifiers
Mean odds ratios (per 10 μg/m3 increase in NO2, from single-pollutant model), categorised by potential effect modifiers for selected outcomes
DISCUSSION
We found no overall evidence of associations between ambient NO2 and doctor diagnosis of bronchitis or asthma, nor of key symptoms of asthma such as wheeze being related to NO2. A weak but consistent positive association was found for reported allergic symptoms, especially “allergy to pets” and “sensitivity to inhaled allergens”. These two allergy results are not independent, as the latter may include allergy to animal dander.
Our findings match reports (from single pollutant models) of positive associations between NO2 and cough.14–16 Our asthma results—small, statistically consistent, showing no overall association—also reflect previous findings.14–19 Our results do not support the overall (weak) positive association with bronchitis14–17 Nor do they support negative associations with hay fever.14,18 Our most robust associations were with the allergy symptoms, where the literature is sparser. Kramer reports associations between children’s sensitisation to allergens and playing in traffic dense areas, while two other studies find no associations between NO2 and allergic sensitisation.15,32,33 We have analysed parent-reported allergy only, an imperfect marker of actual allergic status. Braun found weaker associations between traffic exposure and questionnaire allergy responses than between traffic and tested atopy, and found questionnaire rhinitis responses highly specific but not highly sensitive.34,35 Within PATY’s Dutch study, a similar comparison showed closer agreement.26 Results for sensitivity to inhaled allergens and allergy to pets were very similar. Odds ratios for hay fever were also predominantly positive, albeit smaller. This consistency across related questions and across studies supports that this association is not a chance finding among the many evaluated outcome variables. It seems unlikely that information bias explains the findings for allergy, because parents would probably report asthma/asthma symptoms more than allergy symptoms, if awareness of exposure played a role.
Pooling of studies has both advantages and disadvantages and these may have contributed to the lack of associations for key respiratory outcomes and to the heterogeneity of results across studies. Advantages include the large number of children in the study and the range in exposure. Confidence intervals were generally small. A major concern with meta-analyses in general is comparability of studies and this applies to our study as well. Because the same statistical model and the same confounder model was used for all studies, the current analyses will be more comparable than a traditional meta-analysis where only published effect estimate are compared across studies. As these studies were initiated independently, they sometimes differed in design, wording of symptoms, and exposure assessment methods. We assessed symptom and confounder questionnaires to extract the symptoms thought to be most comparable across studies. We also assessed differences in exposure assessment. All studies used well accepted methods for measurement of NO2 and were able to assess average concentrations with good precision. Much of the (systematic) differences in study methodologies were taken care of by the design of the analysis, specifically the analysis of associations per country, followed by a formal meta-analysis, and the impact on results of differences between studies was tested for. As the same exposure variables are used for all symptoms, errors in exposure assessment are an unlikely source of the pattern of association seen in our study.
As the studies differed in geographical scale of the study area, it is likely that contrasts in NO2 reflect different pollution mixtures. In the Dutch and Austrian studies, contrasts in NO2 are primarily due to local (traffic) sources. In these studies, other primary pollutants such as diesel soot or ultrafine particles probably have the same exposure contrast as NO2. In the other studies, contrasts in NO2 are largely due to differences in large scale background concentrations and urban/rural differences. In these studies, contrasts in NO2 will be associated with contrasts in both primary and secondary fine particles.
Confounding by unmeasured area related factors cannot be discounted. Such a confounder should be strongly related both to NO2 and the respiratory symptom, and so credibility of observed associations is enhanced by being measured across more areas, and by consistency across more studies. Differing response rates between study areas could give rise to bias but we found no confounding by response rate. If parents with illness more frequently report their child’s illness, and if this difference were more acute in more polluted areas, this could give rise to a bias. Examining this in the four available countries showed no evidence of greater observed association between NO2 and sensitivity to inhaled allergens among children with asthmatic parents.
We have reported all mean estimates, for completeness. Where study specific results vary considerably (inverse and positive), a mean estimate is not necessarily useful. Otherwise, where heterogeneity is within a pattern of predominantly or entirely positive estimates, the mean odds ratio serves as a “best estimate” (the calculation of its confidence interval taking account of heterogeneity between estimates, as well as their individual uncertainties). The distribution about this mean remains important.
NO2 concentrations were correlated with the concentration of PM10 and SO2. Thus, some of the association with NO2 could actually be due to these pollutants or other unmeasured pollutants. We therefore performed two-pollutant analyses. Both PM10 and NO2 showed initial associations with morning cough. After mutual adjustment neither estimate was statistically significant, though the PM10 estimate was considerably less reduced than that for NO2, suggesting a stronger association. Associations between NO2 and the two allergy outcomes were unaffected by controlling for PM10. Controlling for SO2 affected conclusions little. A limitation of two-pollutant models was that correlations between pollutants within countries were high, particularly in the Swiss study. Studies with a higher correlation between pollutants will have less weight in meta-analyses, because of higher standard errors of the effect estimates. Indeed, we observed that while individual study results sometimes changed appreciably, the overall association was only mildly affected by inclusion of other pollutants. A more fundamental limitation is that two pollutants may actually be an indicator for the same source, such that mutual adjustment results in over-adjustment. This applies to the models including PM10 and NO2, for which traffic is an important source.
NO2 may be directly responsible for the observed associations or it may act as an indicator of traffic related air pollutants for example diesel soot or ultrafine particles. The available data do not allow us to distinguish between these two options. While associations with NO2 remained after adjusting for PM10, we did not have information available about more specific indicators of particles from traffic—for example, diesel soot, which has also been linked to increased sensitisation to common allergens. Within PATY we did not have consistent information about soot concentrations. Several studies using controlled exposure to NO2 found it could increase effects of allergens.36–38 A WHO working group reported: “The mechanistic basis for these interactions has not been elucidated. The studies might suggest that NO2 can exhibit a ‘priming’ effect, by, for example, affecting epithelial function.”39 The group suggested that associations in epidemiological studies are not primarily due to NO2 but to other unmeasured traffic related pollutants or to secondary pollutants.39
Main messages
-
Increased levels of NO2 are related to increased risk of allergy to pets and sensitivity to inhaled allergens.
-
A link was seen between morning cough and NO2, which may be related to underlying associations with particulate matter.
-
There is little evidence for associations between NO2 and asthma or bronchitis.
Policy implications
-
Long term exposure to NO2, a pollutant often considered a marker for the complex of traffic related pollutants, has been shown to be associated with childhood allergy, across a disparate group of European countries. Continuing efforts are important to protect children from the harmful effects of NO2 and traffic pollution.
Effect modification
We found no consistent differences between effects in boys and girls. Several previous studies reported greater NO2 effects in girls, though few of these reported on allergy.18,40–42 Peters found NO2 effects only in boys, not girls, while Shima found no effect modification by sex, either for allergy or other outcomes.16,17 Stratifiying by age, we found NO2 associations with allergy to be stronger in older than younger children, though evidence for effect modification was not strong. Hirsch reports no effect modification by age, while Shima shows increasing NO2 effects with age in boys, and decreasing effects in girls, so that NO2 effects are greater in young girls than boys, and greater in old boys than girls.15,17 In the PATY data, effects increased with age for both sexes (data not shown).
In summary, evidence for associations between NO2 and respiratory symptoms was robust only for inhalation allergies. The importance of this finding remains, as policies to reduce traffic related air pollution will not result in rapid reductions.
Acknowledgments
The PATY study was funded by the European Union. We also wish to thank all participants of the original studies, including children, parents, teachers, and the researchers and technicians involved.
REFERENCES
Footnotes
-
Published Online First 17 July 2006
-
Competing interests: none.
-
All the original studies included in these pooled analyses gained appropriate ethical approval when they were conducted. See original reports for details. No further approval was necessary for these pooled analyses.
Linked Articles
- Correction