Article Text

Abstract
Aims: To investigate the lagged effects of cold temperature on cardiorespiratory mortality and to determine whether “wind chill” is a better predictor of these effects than “dry bulb” temperature.
Methods: Generalised linear Poisson regression models were used to investigate the relation between mortality and “dry bulb” and “wind chill” temperatures in the three largest Scottish cities (Glasgow, Edinburgh, and Aberdeen) between January 1981 and December 2001. Effects of temperature on mortality (lags up to one month) were quantified. Analyses were conducted for the whole year and by season (cool and warm seasons).
Main results: Temperature was a significant predictor of mortality with the strongest association observed between temperature and respiratory mortality. There was a non-linear association between mortality and temperature. Mortality increased as temperatures fell throughout the range, but the rate of increase was steeper at temperatures below 11°C. The association between temperature and mortality persisted at lag periods beyond two weeks but the effect size generally decreased with increasing lag. For temperatures below 11°C, a 1°C drop in the daytime mean temperature on any one day was associated with an increase in mortality of 2.9% (95% CI 2.5 to 3.4), 3.4% (95% CI 2.6 to 4.1), 4.8% (95% CI 3.5 to 6.2) and 1.7% (95% CI 1.0 to 2.4) over the following month for all cause, cardiovascular, respiratory, and “other” cause mortality respectively. The effect of temperature on mortality was not observed to be significantly modified by season. There was little indication that “wind chill” temperature was a better predictor of mortality than “dry bulb” temperature.
Conclusions: Exposure to cold temperature is an important public health problem in Scotland, particularly for those dying from respiratory disease.
- temperature
- wind chill
- cardiorespiratory mortality
- particulate air pollution
Statistics from Altmetric.com
Mortality rates for cardiovascular and respiratory disease typically exhibit distinct seasonal variation with the highest rates occurring in the winter months.1 For Scotland, the percentage summer to winter difference in weekly all cause mortality rates is estimated to be in the order of 30%.2 The main factor considered to be influencing the observed seasonal pattern is the relation between mortality and temperature. The association between low temperature and increased morbidity and mortality is well recognised.3,4 What is less clear is the exact nature of the relation. Research has shown that the effect of temperature on mortality can exhibit significant variation from region to region.5,6 For example, some studies have reported a U or V-shaped relation between temperature and mortality with the maximum number of deaths occurring at each end of the temperature scale7,8 whereas others have reported a more linear or reverse J-shaped relation, with mortality typically increasing as temperature drops.5
A further issue is the length of the lag period (delay) between exposure to temperature and its effect on mortality from cardiovascular or respiratory disease. In addition to being of interest in its own right, it has recently been recognised as an important consideration in time series studies of the effects of short term exposure to ambient air pollutants on cardiorespiratory mortality and morbidity,9 where temperature may be important. To adjust for the influence of temperature in these studies the typical approach has been to include in the model temperature measured on the same day as the health outcome and/or temperature measured up to a few days previously. However, a number of studies have indicated that temperature effects on mortality may persist for much longer periods than those typically adjusted for in air pollutant studies.2,8 In particular, a London study9 found evidence that cold weather was associated with excess deaths up to 3–4 weeks following a 1°C decrease in temperature. Furthermore, after adjustment for these lagged temperature effects, SO2 and CO were no longer significantly associated with excess mortality, thus suggesting that some reported pollutant effects may have been artefacts due to residual confounding by temperature.
In addition, almost all population studies to date have used “dry bulb” temperature as the meteorological parameter. However, it is possible that wind chill (the degree of cold as perceived by the human body, which is markedly worsened by high wind speed) may be a better predictor of mortality than temperature alone. Wind chill has been studied in simulated environments, and even mild surface cooling in moving air over a few hours can produce important physiological changes such as an increase of 21% in whole blood viscosity.10 A study in the Netherlands11 showed that while temperature alone explained approximately 30% of the daily variation in mortality, the addition of wind chill explained approximately a further 4%. As the meteorological variables determining wind chill are temperature and wind speed, values in the UK generally increase northwards but also increase towards the coast and increase with ground height.
The aim of this study was to investigate the effect of cold temperature on cardiorespiratory mortality in a Northern European climate which experiences winter temperatures as low as −20°C and to determine whether the effect is modified by season. The study also aimed to investigate whether wind chill is a better predictor of cardiorespiratory mortality than “dry bulb” temperature alone.
METHODS
Health data
The Information and Statistics Division (ISD) of the Common Services Agency (CSA) of the Scottish Health Service supplied mortality data for the period January 1981 to December 2001 for the three largest Scottish cities of Glasgow, Edinburgh, and Aberdeen. The codes considered in this study were deaths from all non-accidental causes (referred to hereafter as all cause), from cardiovascular causes (ICD-9 codes 410–414, 426–429, 434–440) and from respiratory causes (ICD-9 codes 480–487 and 490–496), essentially including cardiac and cerebral ischaemia (but excluding cerebral haemorrhage), chronic obstructive pulmonary disease, asthma, and pneumonia. The group “other” causes (all non-accidental causes minus cardiorespiratory codes specified above) were also considered.
Meteorological and air pollutant data
The Meteorological Office supplied hourly meteorological data for each of the three cities. The variables considered in this study were (dry bulb) temperature and wind chill temperature, as measured by the Steadman formula for shade apparent temperature,12 calculated as follows:
ET = −2.7+1.04 (temperature, °C)+2.0 (vapour pressure, Kpa) −0.65 (wind speed, m/sec)
This formula expresses temperature (°C) in terms of the lower value required to produce the same rate of heat loss at that combination of wind speed and temperature as for a person walking in calm conditions.
Initially two measures of dry bulb temperature and two of the Steadman wind chill corrected temperature were considered. A daytime mean (the average of the 7am to 11pm hourly values) of each measure was calculated and also a minimum index—the 24 hour minimum in the case of temperature and the minimum of the 7am to 11pm hourly values in the case of Steadman. Preliminary likelihood ratio tests (not reported here) indicated that the effects of the 24 hour minimum temperature and daytime minimum Steadman on mortality were insignificant when models included the mean temperature and mean wind chill parameters whereas the reverse was not the case (the Pearson’s correlation coefficients between the candidate temperature and wind chill parameters were typically >0.7). The two parameters based on minimums were thus dropped from subsequent analyses.
Associations were examined between the mortality outcomes and mean temperature variables lagged by 0 days (that is, same day temperature), 1–6 days (that is, average of temperatures on the previous 1–6 days), 7–12 days, 13–18 days, 19–24 days, and 25–30 days. The six temperature lag periods were included in the regression models simultaneously. Days were grouped in this way to minimise the number of variables in the regression models and thus reduce the problem of multicollinearity. Lag periods of beyond one month were not examined, as it would be difficult to separate these effects from the longer term seasonal effects.
Daily mean black smoke measurements (obtained using the reflectance method) were obtained from a centrally located site within each of the three cities. There was no imputation for missing data.
Statistical analysis
All analyses were carried out in Splus (version 2000, Insightful Corporation, Seattle, WA, USA) using generalised linear (Poisson) models (GLMs) with natural cubic splines to capture seasonal and other long term time trends. The convergence tolerance of the GLM function was set to a low value of 10−9 with a limit of 1000 iterations.7 Data for the three cities were analysed in a combined model which included terms for city (indicator variables), day of week (indicator variables), black smoke (mean of previous three days), and season and other long term trends (a smoothed function of time with seven degrees of freedom per year fitted using cubic splines) as well as temperature. The decision to use 7 degrees freedom per year to capture season and other long term trends was based on the findings of the NMMAPS mortality re-analysis study.13 However, we also recognise that there is a degree of uncertainty regarding this issue and as such the sensitivity of the temperature estimates to the degree of smoothing used to adjust for season and other long term time trends was examined. The overdispersion parameter (estimated from the GLM models) was close to 1, suggesting little additional variation beyond Poisson variation and as such simple Poisson variation was assumed. The Durbin-Watson test was used to test for first order serial correlation in the residuals.14 For all models, the Durbin-Watson statistic was not significantly different from 2.0 (a value of 2.0 for the Durbin-Watson statistic indicates that there is no first order serial correlation).
Temperature versus wind chill as predictor of mortality
To investigate whether wind chill temperature is a better predictor of mortality than “dry bulb” temperature, likelihood ratio tests from two different models—one including linear terms for daytime mean temperature and the other linear terms for daytime mean wind chill—were compared.
The shape of the mortality-temperature relation
To avoid unwarranted assumptions—such as linearity—the shape of the relation between mortality and daytime mean temperature at each lag period (0, 1–6, 7–12, 13–18, 19–24, and 25–30 days) was initially examined by fitting cubic spline models with 7 degrees of freedom.
The mortality/temperature spline plots suggested that the slope of the mortality/temperature relation was steeper at the lower end of the temperature scale. To allow for this in a manner that would allow simple interpretations of model coefficients, a double linear relation was assumed. This consisted of two separate linear relations over different parts of the temperature range which were however constrained to join at a “knot”. The position of the knot was decided by comparing the log likelihoods of models with different choices of knot as suggested by the initial plots and choosing the one that fitted the data best—that is, at 11°C. The double linear model included two modified temperature variables referred to here as “high” and “low”. These variables were defined in terms of usual daytime mean temperature, t, as follows:
High = t−11 if t⩾11°C, 0 otherwise
Low = t−11 if t<11°C, 0 otherwise
The daily “high” and “low” temperature values were then averaged over the appropriate lag periods (0, 1–6, 7–12, 13–18, 19–24, and 25–30 days) to provide the lagged “high” and “low” temperature variables.
Interpretation of coefficients from models using temperature lags averaged over six days
The effect of a decrease in temperature of 1°C on day X on mortality on days X+1, X+2, … etc would be expected to vary smoothly as the lag period increased (as assumed in so-called distributed lag models). For simplicity of interpretation, this smooth relation is approximated here by a stepped relation changing every six days (with the exception of lag 0), with an implicit assumption that the true effect is reasonably constant within each block.
Use of mean temperatures within each block affects the interpretation of the corresponding coefficients in the model. For example, the coefficient for mean temperature lagged 1–6 days can be interpreted as the increase in (log) deaths on day X if there had been a decrease of 1°C on each of the six days previously. A decrease on only one of these days would reduce the effect to a sixth of this. To enable a direct comparison between the lag 0 coefficient and the other (six day average) coefficients, results are presented as relating to a decrease of 1°C on only one day within each lag period. The coefficient can also be interpreted as the total increase, across days X+1 to X+6 combined, associated with a decrease of 1°C on day X, compared with no decrease on that day. The sum of the coefficients for the six lag periods represents the total increase across day X to X+30 combined, of a decrease of 1°C on day X compared with no increase.
For presentation of results, relative risks, found from exp(β) where β is the related model coefficient, were first calculated. Then the percentage increase in mortality is found from (RR-1)*100%.
Effect variation by season
To investigate whether the effects of temperature on mortality varied by season, the double linear model for temperature and mortality was first replaced by a model with five linear components, which allowed for different gradients for each of the five temperature ranges <1, 1–6, 6–11, 11–16, and 16+ °C. Although the double linear model was considered adequate to examine the effect of temperature on mortality in the main analyses, the assumption of a constant gradient within each (of the two) temperature range could introduce bias when comparing seasonal temperature effects if the true relation between mortality and temperature tends to be steeper at lower temperatures. Interaction terms were used to investigate whether the gradients for the middle three temperature ranges varied by season. Seasonal differences were not investigated for the other two ranges because the number of days in the summer months with a daytime mean temperature of less than 1°C and the number of days in the winter months with a daytime mean temperature of more than 16°C were very small (0.1% and 0.2% of days respectively).
Effect variation between cities
To determine whether the effects of temperature on mortality varied significantly between cities, terms representing the “interactions between temperature variables and city” were included in the models.
Analyses were conducted separately for each of the four health outcomes (all cause, cardiovascular, respiratory, and “other” cause mortality) and each of the three age groups (all ages, 65 years and older, and under 65 years of age).
RESULTS
Table 1 shows the mean, standard deviation, minimum, and maximum of the health, meteorological, and pollutant variables for each of the three cities. The mean daily temperature in the three cities was fairly similar ranging from 9.6 in Glasgow in the West to 8.8 in Aberdeen in the North.
Daily number of death, temperature, and black smoke: descriptive statistics
The shape of the mortality-temperature relation
Figure 1 shows deaths (all cause) plotted against the daytime mean temperature at each of the six lag periods and the fitted cubic spline relations. The data presented are for the Glasgow conurbation although similar patterns were seen for the other two cities. The plots indicate an overall increase in mortality as temperature decreases but this increase appears to be steeper at lower temperatures than at warmer temperatures. This pattern is strongest at the earlier lags and tends to weaken with increasing lag. There is little evidence of an increase in mortality at the hot end of the temperature range.
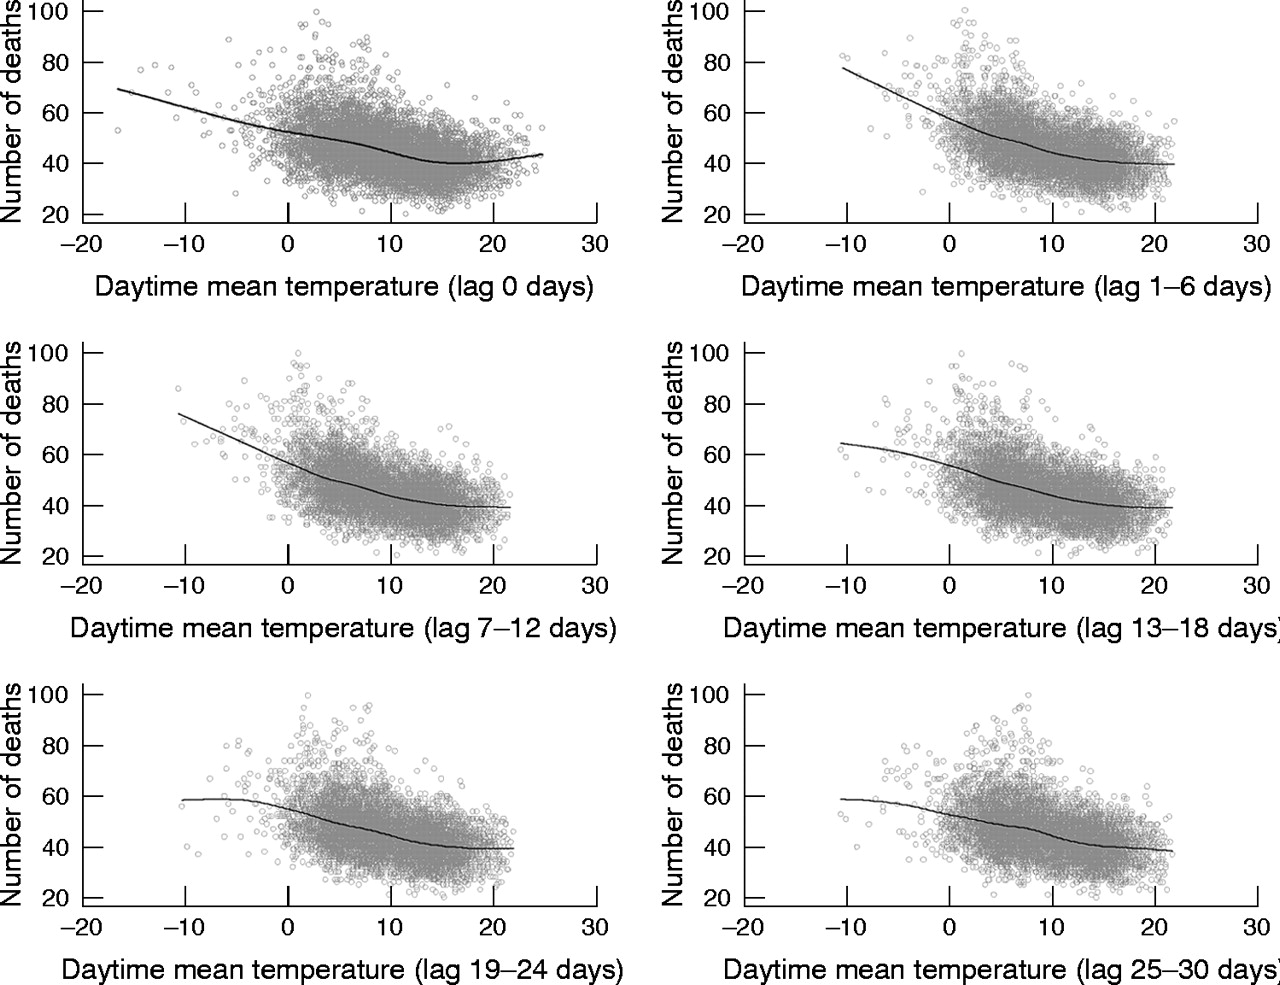
Daily deaths (all cause) plotted against daytime mean temperature, Glasgow.
Temperature versus wind chill as a predictor of mortality
Table 2 shows the percentage change in all cause mortality associated with a 1°C fall in the average daytime mean temperature (dry bulb) or average daytime mean wind chill temperature in each lag period, assuming a (single) linear relation with log deaths, across the whole of the temperature range in each case. For brevity, the results are presented for all cause and cardiorespiratory mortality, but a similar pattern of results was also observed for the other diseases and age groups studied. Neither estimates nor the results of the likelihood ratio tests indicate that there is evidence to suggest that wind chill is a better predictor of mortality than dry bulb temperature alone. Therefore the remaining analyses are based on dry bulb temperatures.
Percentage change (and 95% confidence intervals) in mortality associated with a 1°C fall in the daytime mean temperature (dry bulb) or daytime mean wind chill temperature by cause of death
Lagged effects of temperature
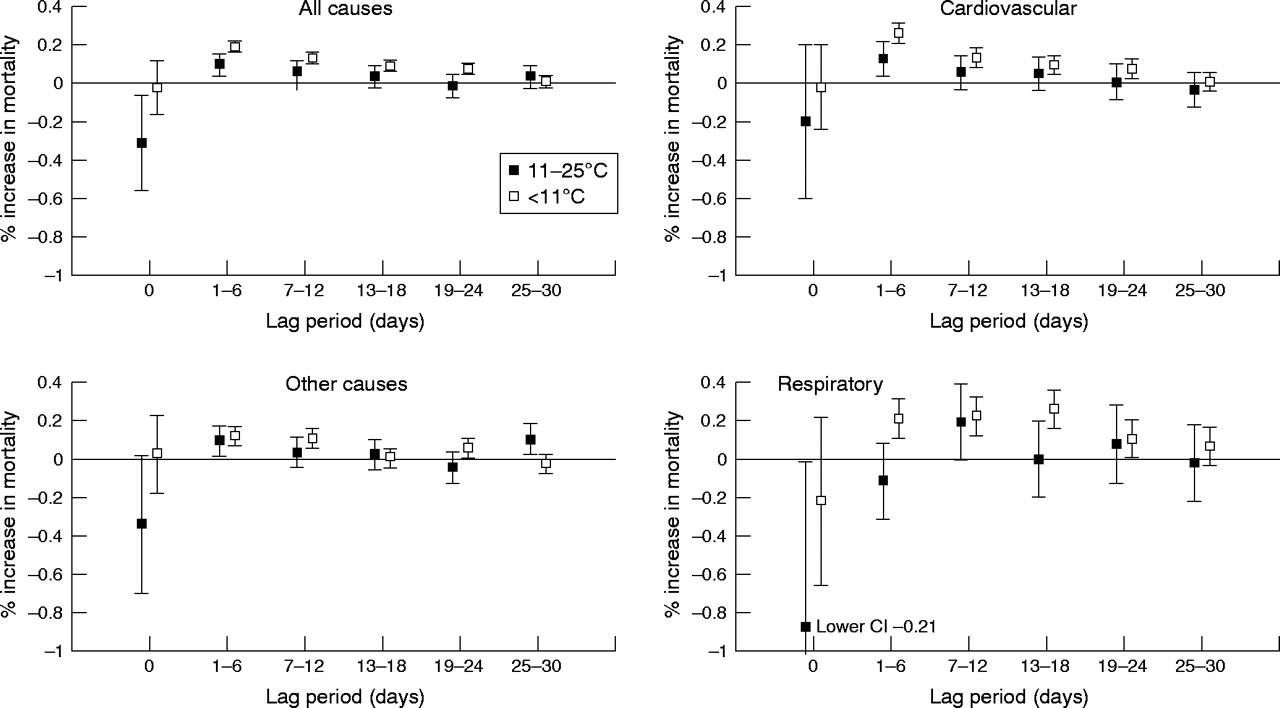
Figure 2 shows the percentage change in all cause, cardiovascular, respiratory, and “other” cause mortality, associated with a 1°C fall in daytime mean temperature in the range 11°C–25°C and a 1°C fall in the range <11°C. For all four disease groups, a 1°C fall in the daytime mean temperature below 11°C was significantly associated with increased mortality. For all cause, cardiovascular, and “other” cause mortality, the strongest associations in this temperature range were observed between mortality and daytime mean temperature lagged by 1–6 days with effects generally diminishing, but tending to remain significant at lag periods greater than two weeks. A 1°C fall in the daytime mean temperature (below 11°C) on any one of the six days previously was associated with a 0.19% (95% CI 0.15 to 0.23), a 0.26% (95% CI 0.20 to 0.32) and a 0.12% (95% CI 0.07 to 0.18) increase in all cause, cardiovascular, and “other” cause mortality, respectively.
Percentage change in mortality (and associated 95% confidence intervals) associated with a 1°C fall in the daytime mean temperature at increasing lag (all six lag periods included in model simultaneously). To enable a direct comparison of the lag 0 estimates with the 6 day lag estimates, the estimates refer to a 1°C decrease in the daytime mean temperature on any one day within each lag period.
The magnitude of the effect of temperature (<11°C) on respiratory mortality was generally larger than the effect of temperature on all cause or cardiovascular mortality. For respiratory mortality, the strongest association was observed between mortality and temperature lagged by 13–18 days. A 1°C fall in the daytime mean temperature (below 11°C) on any one day from lag 13 to lag 18 days was associated with a 0.26% (95% CI 0.16 to 0.36) increase in respiratory mortality. There was no evidence of a significant association between same day cold temperature (lag 0) and any of the mortality outcomes.
In contrast, significant associations were observed between same day (lag 0) temperature and mortality, with mortality increasing as temperature increased within the observed temperature range (11–25°C). An increase in the same day daytime mean temperature of 1°C was associated with an increase of 0.31 (95% CI 0.05 to 0.56), 0.20 (95% CI −0.20 to 0.60), 0.88 (95% CI 0.03 to 1.74), and 0.34 (95% CI −0.03 to 0.70) in all cause, cardiovascular, respiratory, and “other” cause mortality, respectively.
For all other lags, the observed association between mortality and a fall of 1°C in the daytime mean temperature within the range 11°C–25°C tended to be weaker than a fall of 1°C within the range <11°C. Likelihood ratio tests indicated that coefficients for the range 11°C–25°C were significantly different (p<0.05) from those in the range below 11°C.
Table 3 shows the percentage change in cardiovascular and respiratory mortality associated with a 1°C fall in the daytime mean temperature for older (65 and over) and younger (<65 years) people separately. As this study was primarily interested in the effect of cold temperature on mortality results are presented for the <11°C temperature range only. For cardiovascular mortality, the association with temperature is generally stronger in the elderly subgroup than in the younger age group. For respiratory mortality, there is little indication that the effect of temperature is stronger in one age group compared to the other although there does appear to be a difference in the distribution of the effect of lags with temperature effects for the younger age group seen up to 18 days but not thereafter, whereas for the older group temperature effects can still be observed up to 30 days.
Percentage increase (and 95% confidence intervals) in mortality associated with a 1°C drop in the daytime mean temperature (at temperatures <11°C) by cause of death and age group
In table 4 the total effect of a 1°C fall on a given day on deaths in the following 30 days is estimated. A 1°C fall in temperature (below 11°C) on any given day is associated with a 2.93% (95% CI 2.46 to 3.39), a 3.35% (95% CI 2.64 to 4.06) a 4.81% (95% CI 3.45 to 6.16), and a 1.71% (95% CI 0.99 to 2.41) increase in all cause, cardiovascular, respiratory, and “other” cause mortality, respectively, over the ensuing one month period.
Estimated % increase (and 95% confidence intervals) in mortality over the ensuing one month period associated with a 1°C drop in the daytime mean temperature (when temperature <11°C) on any given day
Effect variation by season
Table 5 presents the percentage increase in mortality associated with a 1°C decrease in the daytime mean temperature at the different temperature ranges for both the cool (October to March) and warm (April to September) seasons. For brevity, results are presented for all cause mortality (all ages) only, but a similar pattern of results was also observed for the other disease and age groups studied. Overall, there is some suggestion that the effect of temperature on mortality is modified by season, with a larger temperature effect observed during the cool season. Likelihood ratio tests were used to assess the statistical significance of the interactions between temperature (all six lag periods and all temperature ranges assessed together) and season. The results provided little evidence that the association between mortality and temperature is modified by season (all cause mortality p = 0.05, cardiovascular mortality p = 0.65, respiratory mortality p = 0.18, and “other” cause mortality p = 0.05).
Estimated % increase (and 95% confidence intervals) in mortality over the ensuing one month period associated with a 1°C drop in the daytime mean temperature (when temperature <11°C) on any given day in cool (October to March) and warm (April to September) seasons
Effect variation between cities
The results from this exercise suggested that there was little evidence of any significant variation in the effect of temperature on mortality between the three cities (of the 240 possible temperature/city interactions analysed only 20 were significant at the 5% level, a number that could be explained as type I error—that is, falsely significant results. There was no particular pattern among those that were significant).
Sensitivity analysis
Table 6 illustrates the sensitivity of the temperature estimates to the number of degrees of freedom used to adjust for seasonal and other long term time trends. The results suggest that increasing the degrees of freedom for seasonal and long term trends leads to a small decrease in the size of the temperature coefficients.
Percentage increase in mortality (all cause) associated with a 1°C decrease in the daytime mean temperature (when temperature is <11°C)—sensitivity of estimate to the number of degrees of freedom (df) used to adjust for seasonal and other long term effects
DISCUSSION
Cold temperature was a strong predictor of mortality in the Scottish population studied. The overall shape of the observed association between mortality and temperature was non-linear. Although mortality tended to increase as temperatures fell, this increase was steeper at lower temperatures than at warmer temperatures. For convenience, our models allowed a change in gradient at approximately 11°C but in reality the change is probably gradual.
We also found some evidence of a same day hot temperature effect on mortality. This finding is consistent with other studies that have shown the effect of hot temperature on mortality to be immediate.7,8 It should be noted that this study was primarily interested in investigating the effect of cold temperature on mortality. Previous UK studies have shown a hot effect to occur at temperatures above approximately 18°C.7,15 In our study, only about 3% of the days were above this temperature and as such it was anticipated that the study would not have the statistical power to observe an effect of hot temperature on mortality (if one was present). In addition, the temperature/mortality spline plots provided little suggestion that mortality was increasing at high temperatures. In view of this, the (double linear) modelling strategy adopted in this study was primarily aimed at investigating cold temperature effects and we accept that to draw any firm conclusions regarding the effect of hot temperature on mortality in our population, further and more detailed modelling would be required.
Stronger associations were observed between cold temperature and cardiovascular and respiratory mortality than with all cause mortality. A number of hypotheses have been put forward to explain the mechanism by which exposure to low temperatures could lead to increased cardiovascular mortality. Low temperatures have been associated with a number of parameters considered to be risk factors for cardiovascular disease including increases in heart rate, blood pressure, peripheral vasoconstriction, plasma fibrinogen concentrations, blood cholesterol levels, and platelet viscosity.16,3,17 Cold related increases in respiratory mortality are generally attributed to cross infection from increased indoor crowding during colder months and to the detrimental effect of exposure to cold temperatures on the immune system’s resistance to respiratory infections.6 The observed relation between cold temperature and mortality was typically stronger among the elderly. This is probably due to the comparably lower tolerance of variations in temperature found in this group.18
This study also observed a significant (but smaller, compared to cardiorespiratory mortality) association between cold temperature and “other causes” mortality. The reason for the observed association is unclear. This group contained all subjects that did not have a specified cardiac or respiratory code recorded as the primary (underlying) cause of death. However, the “mode” of death in many diseases—regardless of the primary underlying pathology—is often cardiac, vascular, or respiratory and it is possible that cold temperature contributes to this final “mode” of death. A second explanation is that a true association exists between cold temperature and causes of death other than cardiorespiratory causes. It is also possible that the observed results are an artifact of the methodology. However, this is considered unlikely as the association between cold temperature and mortality has been demonstrated in a wide range of studies using a number of different methodologies.
One of the important findings of our study was that cold temperature effects on mortality persist with lag periods of beyond two weeks. Furthermore, there was some evidence that the association between temperature and respiratory mortality at lag periods of more than one week was stronger than the associations between mortality and the same day temperature or temperature lagged by a few days. These findings are consistent with a study by Gemmell et al,2 which investigated the relation between temperature and mortality for Scotland as a whole. The results of the study indicated that for both respiratory and cardiovascular mortality, the strongest observed associations were between mortality and temperature lagged by 7–14 days. Other studies8,19 have also found that, for respiratory mortality, the strongest associations were between mortality and temperature lagged by more than one week. This suggests that adjusting for temperature in air pollutant time series studies by including the same day temperature and/or that recorded a few days previously, may be insufficient and could lead to bias in estimating the pollutant effect. As the relation between temperature and mortality can exhibit distinct variation between regions,6 the degree of confounding by cold weather is likely to vary between these studies. Some studies in both the UK and Europe have observed apparent significant relations between air pollutants and mortality to become no longer significant when the lagged effects of temperature were taken into account in the regression models.20,9
Keatinge et al9 and others21,22 also found that temperature effects on (all cause) mortality persisted beyond one or two weeks although in these studies the strongest associations were generally observed between mortality and the same or previous day temperature with the association generally decreasing with increasing lag. In contrast, some studies have found little evidence of cold temperature effects persisting for more than a few days.5
It is plausible that the lags for the effects of low temperature on human health may vary in length for different adverse health outcomes. Thus, exposure to cold produces vasoconstriction and blood pressure changes in seconds or minutes.10 Increased concentrations of fibrinogen follow over hours.17,22 Therefore consequences such as myocardial ischaemia from increased work demands on the heart muscle or from increased formation of thrombus can ensue in hours or days. However, it would be difficult for these mechanisms alone to explain the observed effect of temperature, lagged by 19–24 days, on cardiovascular mortality. On the other hand for adverse respiratory outcomes, the timescale for clinical manifestations of an adverse health effect may be longer—running into days or weeks. Although effects such as slowing down of mucociliary clearance can be rapid,23 their consequences in terms of build up of uncleared harmful agents (infective or otherwise) and the progression to a full blown exacerbation of chronic obstructive pulmonary disease may take much longer.
This study found little evidence to suggest that the effect of temperature on mortality varies between the cool (October to March) and warm (April to September) seasons. It is important to note the difference in methodology used in this study to investigate the main (whole year) and seasonal (cool and warm seasons) temperature effects on mortality. Our main analyses modelled the relation as two separate linear relations over different parts of the temperature range constrained to join at a “knot”. While accepting that the true relation between mortality and temperature is probably smooth and non-linear, this double linear approach was considered an adequate and easily interpretable representation for most analyses. However, the assumption of a constant gradient across, for example, the temperature range −16 to 11 degrees could lead to bias when comparing seasonal temperature effects if the true relation between mortality and temperature tends to be steeper at lower temperatures. As the winter gradient would be based mainly on temperature at the lower end of the range and the summer gradient mainly on temperatures at the upper end, the assumption of a constant gradient would lead to a false seasonal effect. Thus, to investigate the effect of temperature on mortality in the two seasons, we subdivided the temperature range into smaller sections within which the linear assumption might be adequate. Other “smooth” models (for example, polynomial or splines) could have been fitted but this would have complicated interpretation of the model coefficients.
This study did not find significant variation in the effect of temperature on mortality between the three cities. This is perhaps unsurprising because factors that may affect the temperature/mortality relation (including behavioural aspects of the population, percentage of the population that was elderly, and housing conditions) are unlikely to vary substantially between the three cities.
Main messages
-
Cold temperature is a strong predictor of mortality in the Scottish population.
-
The strongest associations were observed between cold temperature and respiratory mortality.
-
The effects of cold temperature on mortality persisted for periods in excess of two weeks.
-
The evidence does not suggest that wind chill temperature, as measured by the Steadman Index, is likely to be a better predictor of mortality than dry bulb temperature.
This study found little evidence to support our original hypothesis that wind chill temperature (as measured by the Steadman index) is a better predictor of mortality than “dry bulb” temperature alone. There have been relatively few epidemiological studies that have studied the relation between wind chill and cardiorespiratory mortality or morbidity. A study in the Netherlands found that daily variation in mortality, especially cardiovascular mortality, was more strongly related to wind chill, as measured by the Steadman index, than temperature alone.11 Similarly, a UK study24 that studied the relation between temperature and hospital admissions for stroke patients, found that the admissions had a stronger relation with wind chill, derived from the Siple-Passel formula, than with temperature alone. A number of studies have also simply studied the effect of wind speed (rather than a derived wind chill formula) in addition to, or separate to the effects of temperature, on mortality. Alberdi et al25 and Mackenbach et al20 both failed to observe a significant relation between wind speed and cardiorespiratory mortality. In contrast, a study by Kunst et al26 observed the effects of cold temperature on mortality to be increased by strong winds.
One possible explanation for this finding is that susceptible groups of the population, such as the elderly or those with existing disease, modify their behavioural patterns in some way (for example, by spending less time outdoors) during particularly cold and windy weather. A further explanation could be that the wind chill formula used in this study was not truly representative of the actual temperatures people were experiencing during the study period. There are two main wind chill formulas in use worldwide—the Siple-Passel formula and the Steadman formula—and these formulae are derived in distinctly different ways. The Siple-Passel formula is based upon experimental evidence regarding the length of time it takes for water to freeze in different weather conditions.27 In contrast, the Steadman index is based upon the theoretical concept of thermal equilibrium and considers many more variables than Siple-Passel.12
There were a number of reasons that led us to choose the Steadman index over the Siple-Passel index for the present study. Firstly, this formula approaches the thermal balance of the human body much more closely than the method of Siple-Passel and was thus felt to provide a more accurate representation of the actual temperatures experienced by the individual. Secondly, a previous study that investigated the association between mortality and both the Steadman and Siple-Passel formulae found the former but not the latter to be a stronger predictor of mortality than temperature alone.11 Finally, the Steadman index is the formula favoured by the UK Meteorological Office to derive wind chill temperature, and it was thus felt that choosing this formula would help maximise the relevance of the results.
Policy implications
-
Cold temperature is a public health problem. The most significant mortality outcomes are cardiovascular and respiratory although it is open to speculation as to whether people with prior cardiorespiratory disease are more susceptible to cold related mortality.
The meteorological parameters considered in this study were the daytime mean dry bulb temperature and the daytime mean wind chill temperature (which is composed of wind speed, temperature, and vapour pressure). Some studies have also indicated an association between relative humidity and mortality.25 However, relative humidity has been studied previously for this population and a significant association between this variable and mortality had not been found.28 It is also possible that the observed effect of temperature on mortality could be explained, in part, by confounding due to unmeasured pollutants. However, this study did include an adjustment for particulate matter (measured as black smoke), which is generally believed to be the most important pollutant in terms of health effects.29 A sensitivity analysis indicated that the inclusion or exclusion of black smoke in the regression models had little effect on the temperature estimates.
Although this study made no formal adjustment for the potential confounding effects of either influenza epidemics or pollen counts our seasonal model should have been adequate to reduce the potential confounding of these two variables.30
In conclusion, we have found cold temperature to be a strong predictor of mortality in our Scottish population with the effects of cold temperature persisting out to periods of one month. We have also found no indication that wind chill temperature is a stronger predictor of cardiorespiratory mortality than dry bulb temperature. The results of this study suggest that the most significant mortality outcomes are cardiovascular and respiratory although it is open to speculation as to whether people with prior cardiorespiratory disease are more susceptible to cold related mortality. A further important public health concern is whether the observed cold related mortality is primarily occurring among very frail individuals who were likely to die in a matter of days or weeks anyway; the so called short term “harvesting” effect. One possible indication of a harvesting effect is the presence of an inverse association between mortality and cold at later lags.7 Under this assumption, there was little evidence in the present study to suggest that the observed cold related increase in mortality was due solely to the short term harvesting of particularly frail individuals.
A number of issues require additional investigation. Further work is in progress to examine the possibility of interactions between cold temperature and air pollutants in terms of their effect on cardiorespiratory mortality and whether this relation varies according to season. Similarly, further work investigating the relation between the individual components of the Steadman wind chill index and mortality is required.
Acknowledgments
This work was supported by a research grant, number G9900747, from the Medical Research Council to RMA and colleagues. The views expressed in this publication are those of the authors and not necessarily those of the Medical Research Council.
REFERENCES
Footnotes
-
Competing interest statement: none declared.