Article Text

Abstract
Aims: To evaluate an epidemiological approach to a national noise hazard surveillance strategy, and report current exposure levels in the Danish workplace.
Methods: A study base of 840 companies in 10 selected high risk industries in the largest county in Denmark was identified from a national register. Noise exposure was measured among manual workers recruited from a random sample of workplaces in each industry. For reference, financial companies and a sample of residents were investigated according to the same protocol. The A-weighted equivalent sound level (LAeq) for a full shift was measured by portable dosimeters worn by 830 workers employed at 91 workplaces (67% of 136 eligible companies).
Results: The epidemiological design proved feasible and established a baseline for future noise surveillance. Substantial resources were needed to motivate workplaces to enlist and the final participation rate was less than optimal (66.9%). The LAeq (8) values in the selected industries were highly elevated (mean 83.7 dB(A) (95% CI 83.3 to 84.1) in comparison with residents and office workers (mean 69.9 dB(A), 95% CI 68.8 to 71.0). Some 50% of the workers were exposed to more than 85 dB(A) and some 20% to more than 90 dB(A) in several industries.
Conclusion: Noise levels in Danish high risk industries remain high. A substantial proportion of workers are exposed to noise levels above the current threshold limit of 85 dB(A). Ongoing surveillance of noise exposure using full shift dosimetry of workers in random samples of workplaces most at risk to high noise levels may help reinforce preventive measures. Such a programme would benefit from compulsory workplace participation.
- occupational noise
- occupational exposure
- monitoring
- hearing loss
Statistics from Altmetric.com
Long term occupational exposure to noise exceeding 80 dB(A) carries an increased risk of perceptive hearing loss,1–3 and Western regulatory agencies have accordingly prioritised preventive measures for decades. Such measures include legislation defining noise exposure limits at the workplace and limiting noise emission levels from specified products; requests to provide hearing protection devices when exposure exceeds 80 dB(A); regulations and recommendations regarding placement, dampening, and encapsulation of loud machinery; separation of workers in quiet and noisy work processes; and in some countries, monitoring of hearing thresholds in noise exposed workers.4
Information about the preventive impact of targeted noise prophylaxis remains sparse, as is knowledge about industrial noise exposures over time and today’s risk of noise induced hearing loss. Reporting and notification of noise induced hearing damage averaged some 2400 cases from 1995 to 2001. In Denmark workers are compensated for noise induced hearing damage when a threshold shift of at least 20–25 dB at 2000 Hz and 30–45 dB at 3000 Hz is combined with a speech discrimination loss exceeding 25%. The number of notified cases of hearing damage does not amount to valid information about the current hazard as national statistics on work related hearing loss probably grossly underestimate the true occurrence.5 The statistical information relies on notification by the general practitioner, who most often has no direct information about the workplace. The annual rate of reported Nordic cases of noise induced hearing loss varied between 0.5 and 6 per 1000 employed in 1980–92—fluctuations that can hardly be explained by true differences in the level of occupational noise hazards between and within these countries.6 A recent British survey indicates that occupational noise exposure substantially contributes to hearing loss in the elderly population,7 but these data may be of limited value when evaluating the current risk, because their hearing loss may be due to higher occupational noise levels in the past that are not representative for contemporary levels.
Reinforcement of preventive actions and sound prioritisation by regulatory agencies, industries, and workplaces hence requires reliable, systematic, and ongoing surveillance of noise hazards and noise related hearing loss. A proper surveillance strategy must monitor noise exposure levels and sensorineural hearing loss since use of protective hearing devices is of importance for the disease risk. We here report on the current levels of noise in the Danish workplace and outline and evaluate the implementation of a noise hazard surveillance model with the objective of providing reliable measures of the individual exposure to noise throughout the working day in selected industries. The survey was designed to provide broad coverage of the occupational noise hazard in Denmark and to establish a reference for future surveys.
DESIGN AND METHODS
Selection of workplaces and employees
For the purposes of this survey we identified 10 industrial trades with the highest reporting of cases of suspected noise induced hearing loss according to the Danish occupational disease statistics8 (table 1). We also included children’s day care units because recent comprehensive noise exposure measurements in Denmark have indicated average eight hour time weighted exposure levels of 79.9 dB(A) (standard deviation (SD) 3.4).9 For reference, we selected financial companies and a sample of inhabitants exposed to heavy traffic noise at their residence. Although sampled for a study of environmental noise, the working hours of the latter group represent a wide range of jobs that probably approaches the working population average.
Number of companies and employees by trade
Main messages
-
Occupational exposure to noise causes hearing loss, but knowledge about industrial noise exposures over time and today’s risk of noise induced hearing loss remains limited.
-
A Danish epidemiological survey among workers in 10 industrial trades observed average noise levels considerably above the threshold of 80 dB(A) which is associated with risk of hearing loss.
-
In several industries about 50% of the workers were exposed to more than 85 dB(A) and about 20% to more than 90 dB(A).
-
The suggested epidemiological design proved feasible and may serve as a template for future monitoring of workplace exposure to noise.
The National Bureau of Statistics provided a complete list of 2047 companies within the 12 selected trades in Aarhus County by 1 August 2001 (table 1). Counting a population of some 650 000 people, Aarhus County is the largest in Denmark. To ensure manageability of data collection, the survey was restricted to the 840 companies with 15 or more employees. Within each trade we randomly selected five companies with 15–49 employees, and five with 50 or more employees. A number of companies were ineligible because of downsizing and less than 10 employees in the production area, transfer of manufacturing to other areas, or closure. As companies declined to participate or turned out to be ineligible, the initial roster of 120 companies was consecutively updated with new randomly selected companies until five companies within each chosen trade and size specific stratum had been included, no more companies were available, or project resources had been exhausted (in that order).
Once a company had accepted participation, we asked for a complete list of the employees in its manufacturing departments since only workers in production areas were to be enrolled. Randomly selected employees on the roster were contacted by the project team at the worksite and invited to participate until a maximum of 10 participants had been reached. However, only 5–6 companies complied with the request to provide complete lists, and in most companies foremen and managers selected the workers so as to have at least one employee from each work area. The group of residents was identified from addresses obtained through a survey in the Aarhus Municipality. The group was divided into 10 different geographical areas, so that different parts of the central town were included in the study. Two residents were working in industries with possibly high noise levels, 28 in offices, education, or services, and 35% were students or unemployed. The dimensions of the study, 50 workers from small and 50 workers from large companies in each trade, allowed us to obtain accurate estimates of exposure levels as evidenced by the narrow confidence limits (cf figs 2–3).
Policy implications
-
Ongoing surveillance of noise exposure using full shift dosimetry of workers in selected industries should be considered in order to reinforce preventive measures. Such a programme would benefit from compulsory workplace participation.
Assessment of individual noise exposure
The A-weighted equivalent sound level (LAeq) and the peak sound level were recorded every 5 seconds for 24 hours by portable dosimeters (Bruel and Kjaer, model 4443, a type II instrument set to fast response). After pure tone calibration and installation of new batteries, an audiologist handed out the equipment and instructed participants individually at the workplace or at the Department of Occupational Medicine (the sample of residents). The dosimeter was worn in a pouch attached to a belt at the participant’s waist and the microphone was mounted at or near the participant’s collar—on the right side if right handed and the left side if left handed. The 24 hour period started when the participant began to wear the dosimeter and it was turned on. The display was dimmed during measurements to minimise noise dependent changes in the participant’s behaviour. Most periods began in the morning, Tuesday to Thursday. The dosimeters were retrieved from the participants by the audiologist at the workplace or at the residence the following day after the 24 hour recording was over. The dosimeters were set to a dynamic range of 50–120 dB(A), fast response, but because of technical problems calling the lower measurement range into question, a higher cut-off point in the low range, 58 dB(A), had to be used and measurements below 58 dB(A) were set to 0 dB(A). Simulations substituting values below 58 dB(A) with 20, 30, or 40 dB instead of 0 dB produced minimal changes in the total noise level since only minimal energy is contained in these low exposure levels. Peak levels were measured concomitantly by the same instrument using a 10−6 second interval, and the highest value per 5 second interval was recorded. Peak values were measured using a C-weighted model with an exchange rate of 3 dB in the range 70–120 dB(A).
During sound level recordings all participants kept a 24 hour diary to keep track of the timing of work, leisure, transportation, and sleep hours. A separate questionnaire was used to elicit information on work history, use, and type of hearing protective devices and noise emissions during work and leisure time (hand held tools, machinery, music, other people, traffic, and shooting). Diaries and questionnaires were reviewed together with the participant to ensure complete and accurate information.
Data analysis and statistical methods
The noise data loggers provided up to 17 280 measurements of LAeq and peak values for 5 second intervals for each participant. The dosimeter recordings were synchronised with the diary to identify the timing of each 5 second measurement relative to work, transportation, leisure, and sleep hours. The noise exposure was computed for each of the respective time intervals using the following formula:10

where n = number of 5 second measurements, and LEq1, LEq2 … LEqn are the average noise levels during each measured 5 second interval.
Since we obtained full work shift noise exposure recordings, the LAeq for work hours are equivalent to time weighted eight hour values (LAeq(8))—the point of reference for occupational threshold limit values. Peak levels were divided into the same categories as the noise level measurements, and the median as well as the 25th centiles for each category were calculated.
The distribution of the Leq sound pressure levels was close to normal and the median values were only marginally different from the mean values. We therefore chose to present the distribution of noise exposure levels by mean values and 95% confidence limits.11 Multiple linear regression analysis was used to model noise exposure levels as a function of independent variables such as trade and company size.12 Furthermore, we assessed exposure to high noise levels by computing the percentage of workers exposed to noise levels below 85 dB(A), between 85 and 90 dB(A), and above 90 dB(A).13 Data processing and analyses were performed in Microsoft Excel, Microsoft Access, and SAS version 8.2.
RESULTS
Recruitment of companies and workers
Among the 190 invited companies, 54 declined participation, 45 were ineligible, and 91 were enrolled, which yielded an overall average participation rate of 66.9% (91/(190−54)). The participation rate was higher in large companies with 50 employees or more (76.4%) than in companies with less than 50 employees (55.4%), and it varied grossly across trades (table 1). Following the initial mailing of information, company managers, foremen, and shop stewards were contacted by phone on average 5 times (range 1–12) in order to motivate enlisting. Meetings with managers or the safety and health boards were occasionally arranged to provide additional information. Reasons for declining participation included lack of time, ongoing reorganisations, lack of interest, ongoing contacts or conflicts with the labour inspection service or the occupational health services, recent mapping of noise exposure, noise not considered an important issue, or shift work. In a few cases the workers were reluctant to participate. The building and construction industry represented a special case because of non-stationary workplaces and workers divided among many workplaces. Few major construction sites were approached and samples of workers were enrolled independently of the companies where they were employed.
Altogether 830 employees were enlisted—that is, an average of 8.5 from each company (range 2–27) (table 1). The average age was 38.2 years (SD 9.5 years) and the majority of the study population was male (75%). While women constituted 92% of the employees in day care homes, the proportion ranged from 2% in the metal production and manufacturing industries to 30% in the publishing industry.
Levels of noise exposure
The distribution of the average LAeq weighted noise exposure was highly elevated during working hours in comparison with leisure and sleep hours, except among residents and people working in bank offices where work hour exposure overlapped leisure time exposure (fig 1). Exposure during transportation to and from the work place [mean LAeq 75.6 (SD 6.7)] fell between the level of work hour exposure [mean LAeq 82.1 (SD 6.7)] and leisure hour exposure [mean LAeq 69.2 (SD7.7)] and did not vary substantially across trades. Noise exposure levels during work hours did not vary systematically across the seasons of the year—either in models considering all trades or in any single trade (data not shown).
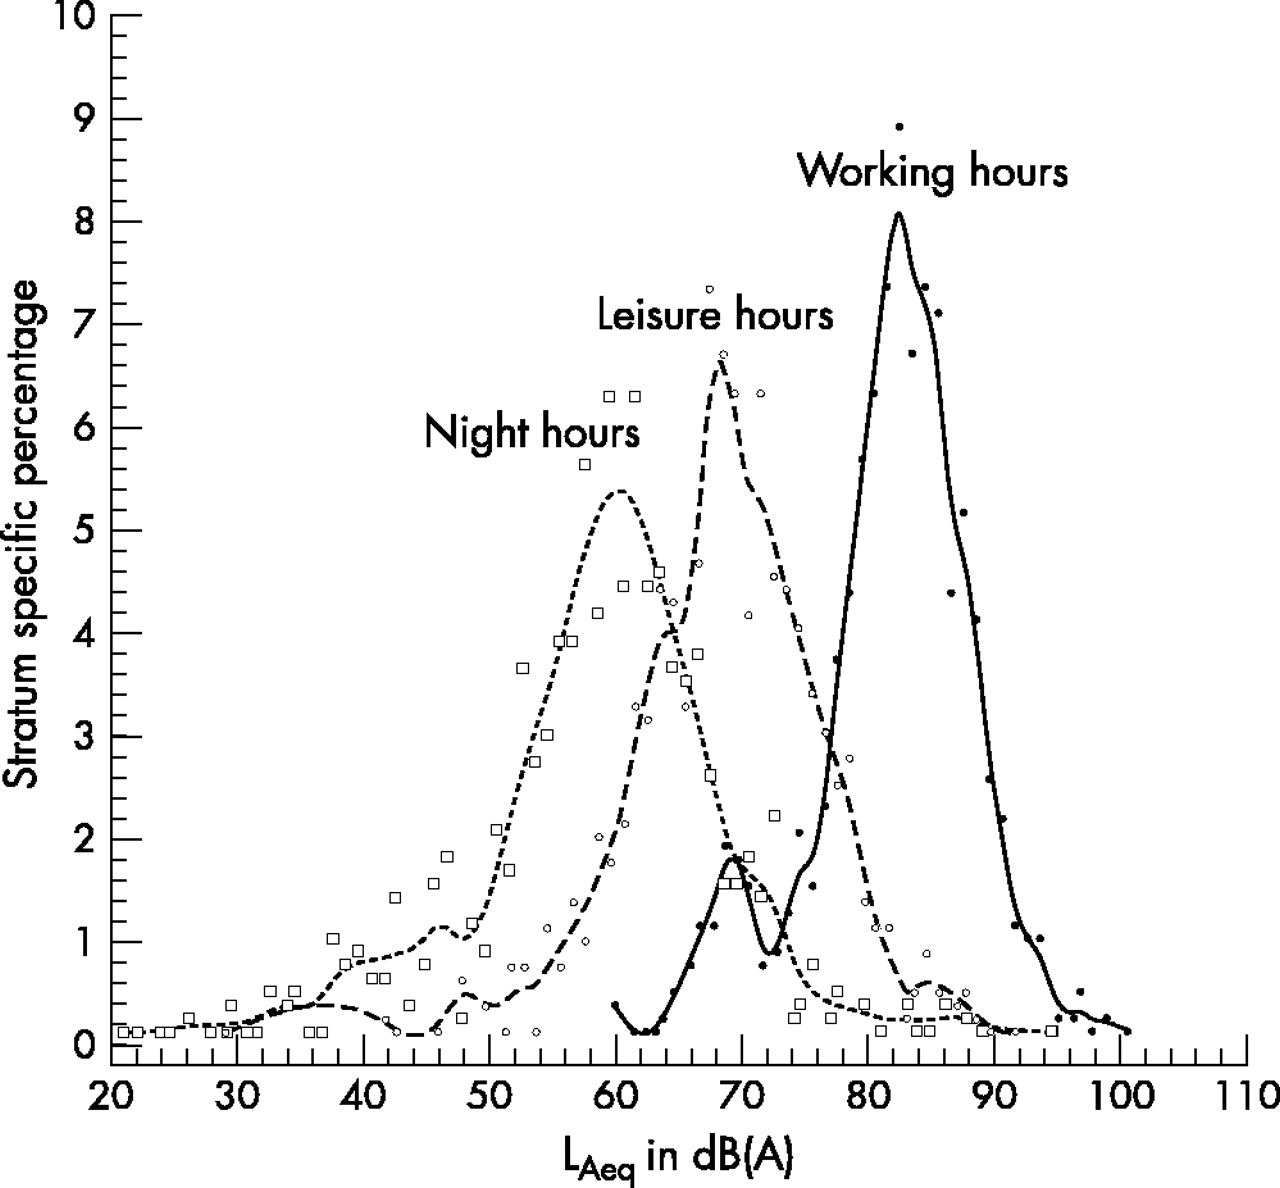
Distribution of the A-weighted equivalent sound level (LAeq) during work hours, leisure time, and sleep hours. Entire study population. The small peak 70 dB(A) identifies working hours among office workers and residents.
The average exposure during working hours was highly elevated [mean 83.7 dB(A), 95% CI 83.3 to 84.1] in the selected trades in comparison with residents and office workers [mean 69.9 dB(A), 95% CI 68.8 to 71.0; fig 2]. Among noisy industries, metal production and the wood industry exhibited the highest exposure levels, and publishing and machine industries the lowest. In comparison with the risk industry with the lowest noise levels (manufacturing of furniture), the LAeq levels were significantly elevated in the food, wood, stone, and metal manufacturing industries and in the iron and metal product industries. Children day care home workers were exposed to noise at “industrial” levels (fig 2). The average exposure in small companies with less than 50 employees (82.5 dB(A), 95% CI 82.0 to 83.1) was at the same level as in large companies with more than 50 employees (82.5 dB(A), 95% CI 81.7 to 83.3). This was true even after adjusting for effects of trades. The distribution of peak exposures during working hours across trades roughly corresponded to the average exposure (fig 3).

Distribution of the A-weighted equivalent sound level (LAeq) during work hours by industry. Mean values with 95% confidence limits.

Distribution of the individual upper quartile of peak noise exposure levels [dB(A)] during work hours by industry. Mean values with 95% confidence limits.
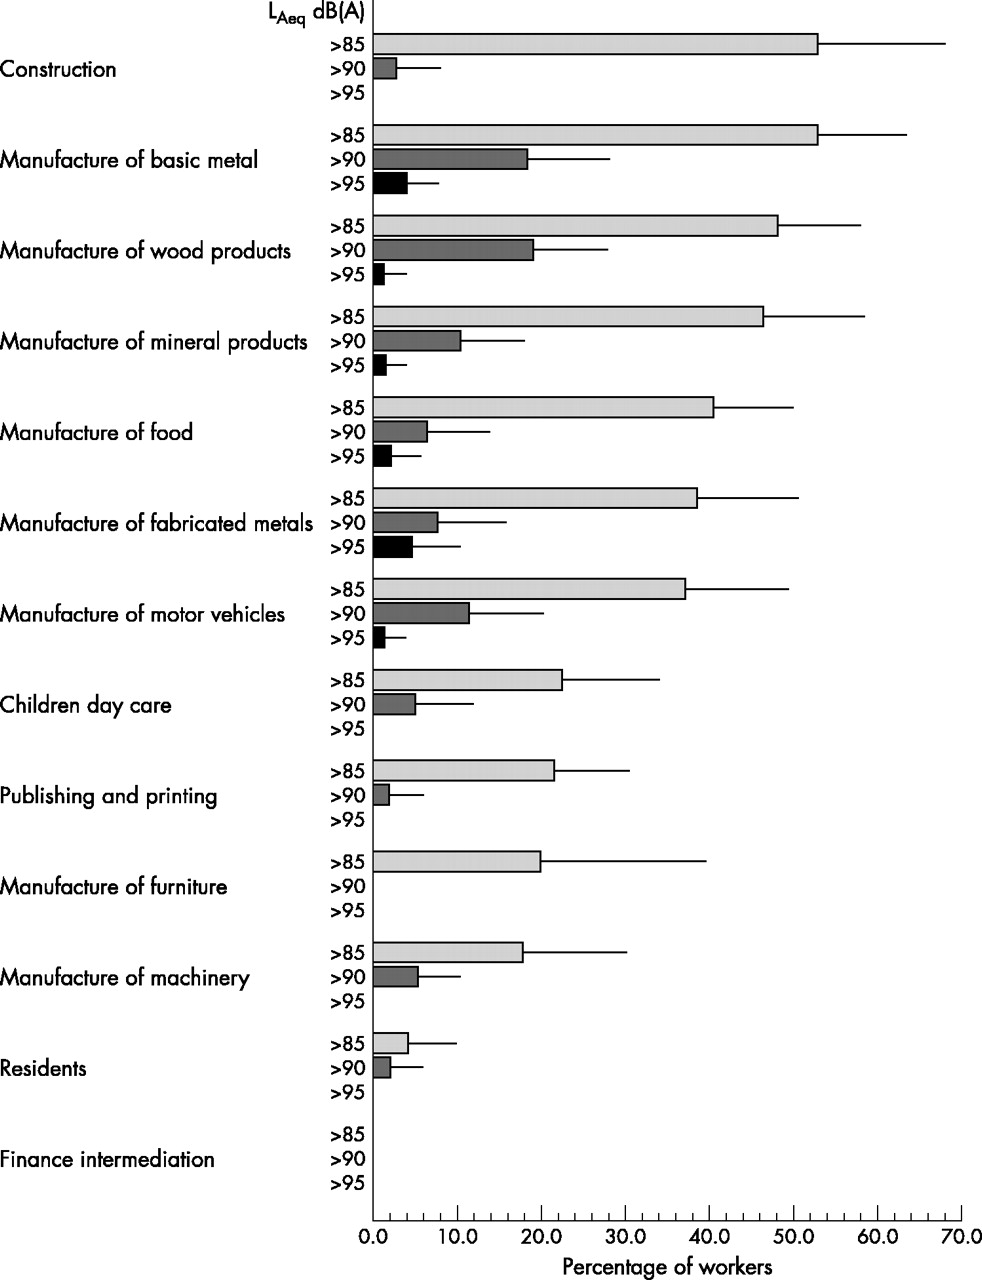
Some 50% of the workers were exposed to more than 85 dB(A) and some 20% to more than 90 dB(A) in several trades. In all noisy trades, a fraction of employees were exposed to more than 85 dB(A), but none of the office workers were exposed to such high levels (fig 4, categories not mutually exclusive). Use of hearing protection in the noisy trades ranged from 37% of employees in furniture production to 85% in manufacture of basic metals and was more common in large companies (on average 59% of workers) than in small companies (50% of workers). Moreover, use of hearing protection increased with increasing noise exposure from 20% at levels below 80 dB(A) to 63% at 80–90 dB(A), while 90% of the workers exposed to more than 90 dB(A) reported the use of hearing protecting devices. Devices were equally divided between hearing protectors and earplugs. Likewise, among those using protective devices, the duration of use rose with exposure, from an average of 2.6 hours at low levels to 5.3 hours among those exposed to more than 90 dB(A). Among the latter, at least 23% used protective devices for 6–8 hours daily.
Proportion of employees with A-weighted equivalent sound level (LAeq) during work hours exceeding 85, 90, and 95 dB(A) by industry. The bars indicate the upper 95% confidence limits.
DISCUSSION
Our survey shows that exposure to noise, even at prevailing average noise levels in selected Danish industries may pose a hazard to normal hearing. In most of the studied trades around half of the workers were exposed to noise above the threshold known to be associated with hearing loss. The survey also shows that exposure to noise levels above recommended threshold limits is not confined to the industrial workplace, but that day care workers may be at risk as well. Hearing damage can be prevented by adequate use of hearing protective devices, which were, in fact, used by the majority of high level exposed workers in this survey. Our data do not, however, allow us to ascertain whether the use of protective devices is sufficient to eliminate the risk of hearing loss and there seems to be a need for additional preventive measures including systematic surveillance of noise levels. A new EU directive (2003/10/EG) requests that action needs to be taken when noise levels exceed 85 dB(A), a level that has been lowered from the former 90 dB(A).
This study was performed in random samples of small and large workplaces within a range of selected industrial trades in order to provide an accurate and precise estimate of the noise exposures at the upper tail of the noise exposure distribution. A survey based on a simple random sample of the entire workforce would provide estimates of the population exposure, but less information about the high risk industries. From a preventive point of view, it is more important to characterise the risk trades than to get accurate population exposure estimates. One drawback is, however, that the selection of trades depends on current data, which may be inadequate. Our approach is conservative and new risk trades may escape recognition. However, systematic detection of new risk occupations with high noise levels would require population samples of enormous dimensions, unless the exposure prevalence is high.
We stratified the sampling on small and large companies because we expected that noise exposures would be under better control in large companies. This assumption was not corroborated by our survey and the design of future surveys could be simplified by omitting sampling stratified by company size. Nevertheless, a survey like this one based on enlisting of workers through their workplaces would cause workers from small companies to be overrepresented in the sample unless sampling was weighed by company size.
The companies in the trades selected for this study are probably representative for noise exposure levels in these trades throughout the country, but it is an obvious limitation from an surveillance point of view that many trades with potential high noise levels such as flight attendants, air pilots, army air crews, engineers in the merchant and navy ships, fishermen, musicians, employees of music clubs and discotheques, truck and train drivers, and probably many other occupations were not included.14–25 This limitation could easily be remedied in future surveys by extending the range of trades studied.
The main risk of bias was related to the enlisting of companies, the majority of which were initially rather reluctant to participate in the study. Although some of the reasons for declining participation such as time lag or organisational changes may not be related to noise exposure levels, it does represent a problem that some companies whose noise exposure levels were high and resources limited may have exhibited adversity to entering the study, thus skewing the data towards lower noise exposure estimates and, accordingly, underestimation of exposure levels. However, it is also conceivable that companies that have effectively solved a noise problem would be less interested in participating for that very reason. Neither the participation rate at the trade level spanning 50% to 100% nor the number of workers in each trade was related to the measured noise exposure levels. Nevertheless, the rather low participation rate averaging 67% may result in bias in an unpredictable direction; this issue should therefore be remedied in future studies. If surveillance of noise exposure is considered an important component of a noise abatement strategy, it seems important to ensure full coverage by legislation.
Our protocol demanded random selection of workers by the project team based on rosters of all currently employed production workers, but in most instances this request was not met. Companies not providing the requested roster selected candidates for the study by several methods. It is not possible to evaluate how intra-company selection may have influenced the findings. Obligation to strictly adhere to the suggested protocol would be important in forthcoming occupational noise surveillance programmes.
Assessment of occupational noise exposure is often based on measurements through limited time periods in a work shift. The availability of reliable data loggers has made it possible to measure sound levels throughout an entire work shift, although the type II instruments used for this study are less adequate for measuring transient peaks in an industrial setting. Variation of exposure related to changing job tasks is thus not an obstacle to obtaining representative recordings. This simplifies the study protocol and subsequent analysis and reporting of results. Variation in exposure across working days is more efficiently accounted for by monitoring more workers than by performing measurements in the same worker on consecutive working days.10 Season was not related to the noise levels in this survey and efforts to distribute measurements across seasons should thus not be given high priority in a Danish setting. The division of the day into working hours and leisure time hours relies on the information obtained by a simple 24 hour diary filled in by the worker. The diary was checked for completeness and consistency when personally handed over; an approach that worked well.
The deleterious effects on the inner ear of excessive noise exposure can be prevented by sufficient and adequate use of protective devices. We have fairly accurate knowledge of the dose-response relation between noise exposure and the risk of hearing damage,2 but this does not afford us the ability to predict the occurrence of hearing damage based on noise exposure levels alone. Surveillance of shifts in hearing thresholds in noise exposed workers should therefore also be considered.
Conclusion
The noise levels in Danish high risk industries remain rather high. A substantial proportion of workers are exposed to levels above the current threshold limit of 85 dB(A). It is suggested that ongoing surveillance of noise based on full shift monitoring of random samples of workers in random samples of workplaces in high priority trades be established as part of a preventive strategy. The feasibility and reliability of such a programme would greatly benefit from legislation making it compulsory for workplaces in risk trades to contribute.
Acknowledgments
The authors wish to thank audiologist Hanne Jessen and project secretary Jane Boilesen for company contacts, site visits, and organisation of the dosimetry measurements. The study was financed by a grant from the Danish Working Environment Authority (journal no. 20000087619).