Article Text

Abstract
OBJECTIVES To investigate whether there is a relation between residential exposure to aircraft noise and hypertension.
METHODS The study population comprised two random samples of subjects aged 19–80 years, one including 266 residents in the vicinity of Stockholm Arlanda airport, and another comprising 2693 inhabitants in other parts of Stockholm county. The subjects were classified according to the time weighted equal energy and maximum aircraft noise levels at their residence. A questionnaire provided information on individual characteristics including history of hypertension.
RESULTS The prevalence odds ratio for hypertension adjusted for age, sex, smoking, and education was 1.6 (95% confidence interval (95% CI) 1.0 to 2.5) among those with energy averaged aircraft noise levels exceeding 55 dBA, and 1.8 (95% CI 1.1 to 2.8) among those with maximum aircraft noise levels exceeding 72 dBA. An exposure-response relation was suggested for both exposure measures. The exposure to aircraft noise seemed particularly important for older subjects and for those not reporting impaired hearing ability.
CONCLUSIONS Community exposure to aircraft noise may be associated with hypertension.
-
Exposure to aircraft noise may be a risk factor for hypertension.
-
It is suggested that special attention be paid to maximum noise levels because of possible physiological effects from aircraft noise.
- arcraft noise
- hypertension
Statistics from Altmetric.com
Aircraft noise has been linked to various physiological and psychological effects, such as sleep disturbances, electroencephalographic changes, and annoyance.1 The relation between aircraft noise and hypertension has been studied only sparsely, but a few reports suggest some association.2 In a series of community surveys around Schiphol airport in Holland from the 1970s, Knipschild3 4 and Knipschild and Oudshoorn5 reported associations between exposure to aircraft noise and attendance at general practitioners, self reported health problems, and use of cardiovascular drugs, including antihypertensive agents. In one of these studies, which included people between 34 and 64 years of age living in eight villages around the airport, the prevalence of hypertension was greater in the areas exposed to aircraft noise.4 However, there was a high non-response rate which might have resulted in selection bias. Some association has also been reported between exposure to aircraft noise and raised blood pressure in cross sectional studies of children, but the evidence is weak.1 6 Furthermore, increased blood pressure has been found after exposure to high levels of military low altitude flight noise in field studies and from recorded aircraft noise in laboratory settings.7-9
Policy implications
-
These results may be useful for decisions on new guidelines, future regulations, and strategies to prevent environmental noise.
-
This study supports the view that potential physiological health effects from noise should be considered during assessment of health impact and in future planning.
The different traditional indices used to describe community exposure to aircraft noise, such as the British noise and number index, the American composite noise rating, the Australian noise exposure forecast, the Dutch Kosten unit, and the Swedish aircraft noise level (FBN), have typically comprised some sort of average noise level, often including different corrections for time of day and number of events.10 A Swedish study has found a stronger association between annoyance and measures of maximum aircraft noise levels compared with energy averaged levels.11 However, no study has investigated a relation between hypertension and maximum levels of community exposure to aircraft noise.
Despite the earlier indications of a risk for hypertension from exposure to aircraft noise and the increasing air traffic in many countries, especially in densely populated areas, there is a lack of recent epidemiological research on this issue. The aim of the present study was to examine a possible relation between residential exposure to aircraft noise expressed as energy averaged and maximum levels, and hypertension among adults, including assessment of exposure-response relations.
Methods
STUDY POPULATION
We used two random samples of subjects aged 19–80 years from an environmental health survey in Stockholm County.12 One sample included residents in the vicinity of Stockholm Arlanda airport and another sample was drawn from other parts of Stockholm County. To reduce misclassification of exposure from aircraft noise in the vicinity of the second airport within Stockholm County (Bromma airport), with low altitude overflights mainly above the central parts of Stockholm, as well as confounding by noise from motor vehicles, we excluded those living in Stockholm city. A postal questionnaire distributed in April 1997 was answered by 327 people in the airport sample (71%) and by 3276 in the county sample (74%). Information on age and sex was obtained from the National Population Register, and the questionnaire provided individual data on smoking habits, educational level, residential type, duration of residence, and prevalence of hearing disability. The subjects were also asked whether they had a medical diagnosis of hypertension “Have you been diagnosed for hypertension by a physician during the past 5 years?”. Information was also collected on various lifestyle factors, including physical activity outdoors, and consumption of fruit or vegetables. The analysis was restricted to those who had been living at the address for at least 1 year, which, after exclusion of subjects with missing data on some of the variables, resulted in 266 and 2693 subjects in the group exposed to aircraft noise and the reference group, respectively.
EXPOSURE CLASSIFICATION
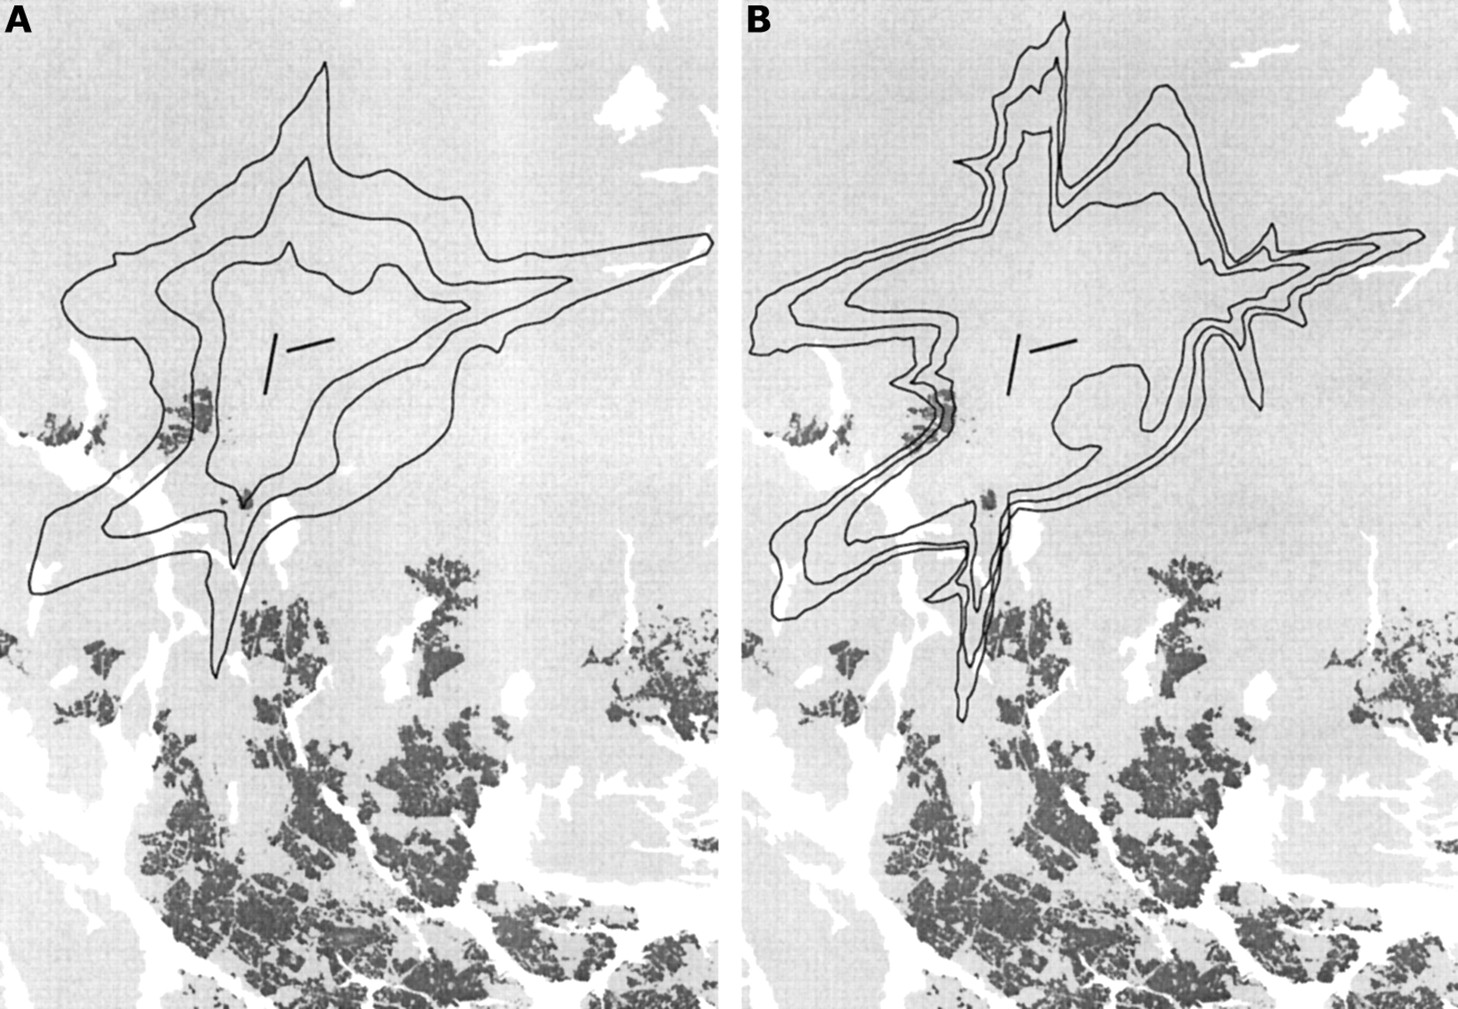
All residential addresses in the study were given geographical coordinates by combining the National Population Register and the Central Register for Real Estate Data. Contour lines from the Swedish Civil Aviation Administration, representing geographical boundaries with aircraft noise levels were superimposed on a digital map containing the residents' coordinates using geographic information system (GIS) techniques. The contours were expressed either as time weighted equal energy levels (FBN: the Swedish abbreviation for energy averaged aircraft noise level) or maximum noise levels (MNL).10 13 These contours were generated by a computer program based on air traffic statistics during 1997. For FBN the program produces yearly average noise levels where the number of aircraft events during the evening period (7 00 pm to 10 00 pm) and the night (10 00 pm to 7 00 am) is multiplied by a factor of 3 and 10, respectively.10 The FBN level is calculated as the mean noise level from all overflights corresponding to the noise energy each aircraft event would produce if occurring throughout 1 hour, during the average 24 hour period in 1 year. Long term field studies around Arlanda airport have shown close agreement between the estimated FBN values and measured levels.14 The contours representing energy averaged noise levels were given in 5 dBA boundaries from 50 dBA; thus the subjects were classified into exposure groups from below 50 dBA to above 65 dBA. The highest exposure category (>65 dBA) contained only two subjects and in the analyses we merged them with those between 60 and 65 dBA. The MNL level is defined as the highest noise level from aircraft overflights occurring at least three times during the average 24 hour period in 1 year—that is, on a typical day during that year. These contours were given in 1 dBA classes starting at 70 dBA. Cut off points based on tertiles according to the distribution of exposed subjects were used to obtain groups proportional in size; thus the subjects were classified into exposure categories of below 70 dBA, 70–72 dBA, 72–74 dBA, and above 74 dBA. Cut off points for dichotomous exposure variables were set at 55 dBA for FBN and 72 dBA for MNL, according to the median value of subjects with exposure information from either measure available (n=277). Because the sampling of subjects was made before completion of the 1997 aircraft noise statistics, 11 originally unexposed subjects from the county sample were classified as exposed to aircraft noise levels above FBN 50 dBA or MNL 70 dBA in the analysis. The study area around Arlanda airport, including the geographical boundaries of energy averaged and maximum aircraft noise levels used for exposure classification, is shown in figure 1.

Arlanda airport with aircraft noise contours representing geographical boundaries with energy averaged noise levels (FBN) of 50, 55, and 60 dBA (A) and maximum noise levels (MNL) of 70, 72, and 74 dBA (B) during 1997. The black lines in the middle are the two runways currently in operation, white parts are water, and the darker zones constitute populated areas.
STATISTICAL ANALYSIS
Prevalence odds ratios (PORs) and 95% confidence intervals (95% CIs) were calculated with multivariate logistic regression, adjusted for sex, age (continuous), smoking (never, former, or current), and education (four levels). Other models were also tested including frequency of physical activity outdoors (six levels), fruit consumption (six levels), vegetable consumption (six levels), residential type (three levels), and duration of residence (two levels). Correlation between variables was tested with Spearman's rank correlation coefficient. Linear trend of hypertension prevalence was compared across aircraft noise exposure categories using a Wald test. All statistical analyses were performed with Stata 6.0.
Results
The distribution of subjects from the two samples according to age, sex, smoking, and education is shown in table 1. The airport sample comprised slightly more men than women, and included slightly younger subjects than the county sample. Furthermore, the prevalence of current smoking was marginally higher in the airport sample, whereas more subjects in the county sample had a higher education.
Age, sex, smoking, and education for subjects from a sample near Stockholm Arlanda airport and a sample from other parts of Stockholm county
The prevalence of hypertension was 14% among those with equal energy aircraft noise levels of less than 55 dBA and 20% for those with higher exposure (table 2). This yielded a prevalence odds ratio (POR) for hypertension of 1.6 (95% CI 1.0 to 2.5) when adjusted for age, sex, smoking, and education. Subjects exposed to maximum levels of aircraft noise of less than 72 dBA had a prevalence of hypertension of 14% and those exposed to more than 72 dBA of 20%. This resulted in a POR of 1.8 (95% CI 1.1 to 2.8) when adjusted for covariates. There was no clear difference in risk between the sexes, but especially the older subjects seemed to have a higher prevalence of hypertension related to exposure to aircraft noise (table 3). Also, those who did not report hearing disabilities had particularly high risk estimates. Other background factors did not indicate heterogeneity of the risk in different strata.
Prevalence of hypertension among residents with exposure to equal energy and maximum levels of aircraft noise in Stockholm county
Prevalence of hypertension among residents with exposure to equal energy (FBN) and maximum (MNL) levels of aircraft noise, stratified by sex, age, and hearing loss
The two exposure measures were highly correlated in the sample (Spearman's rank correlation coefficient=0.90). In an effort to discriminate between the two exposure measures, a group variable was constructed classifying the subjects into high or low exposure categories according to either of the exposure measures. Using the subjects exposed to aircraft noise levels below both FBN 55 dBA and MNL 72 dBA as the reference group, resulted in an adjusted POR of 2.2 (95% CI 0.7 to 7.3), 0.9 (95% CI 0.2 to 4.6), and 1.7 (95% CI 1.1 to 2.8) among those exposed to low FBN but high MNL levels, high FBN but low MNL levels, and high levels of both FBN and MNL, respectively. Thus, the highest risk was indicated among those exposed to high maximum but low energy averaged levels, although based on small numbers (only 4, 2, and 25 hypertensive subjects in the different exposure categories, respectively).
Figure 2 shows the results of the exposure-response analyses using energy averaged aircraft noise levels. The adjusted POR among those exposed to FBN levels 50–55 dBA, 55–60 dBA, and above 60 dBA was 1.1 (95% CI 0.7 to 1.9), 1.5 (95% CI 0.9 to 2.5), and 2.1 (95% CI 0.8 to 5.3), respectively. An analysis of trend over these exposure categories resulted in an adjusted POR of 1.3 (95% CI 0.8 to 2.2). The corresponding analysis using maximum noise levels is shown in figure 3. The adjusted POR increased from 0.7 (95% CI 0.3 to 1.6), 1.4 (95% CI 0.8 to 2.5), up to 2.5 (95% CI 1.3 to 4.8) among those exposed to MNL 70–72 dBA, 72–74 dBA, and above 74 dBA, respectively. The adjusted POR for trend over these exposure categories was 1.8 (95% CI 1.1 to 3.0). Analyses were also carried out adjusting for additional covariates—for example, physical activity, diet, and residential type. This did not affect the risk estimates related to exposure to aircraft noise, indicating that confounding from these factors was unimportant.
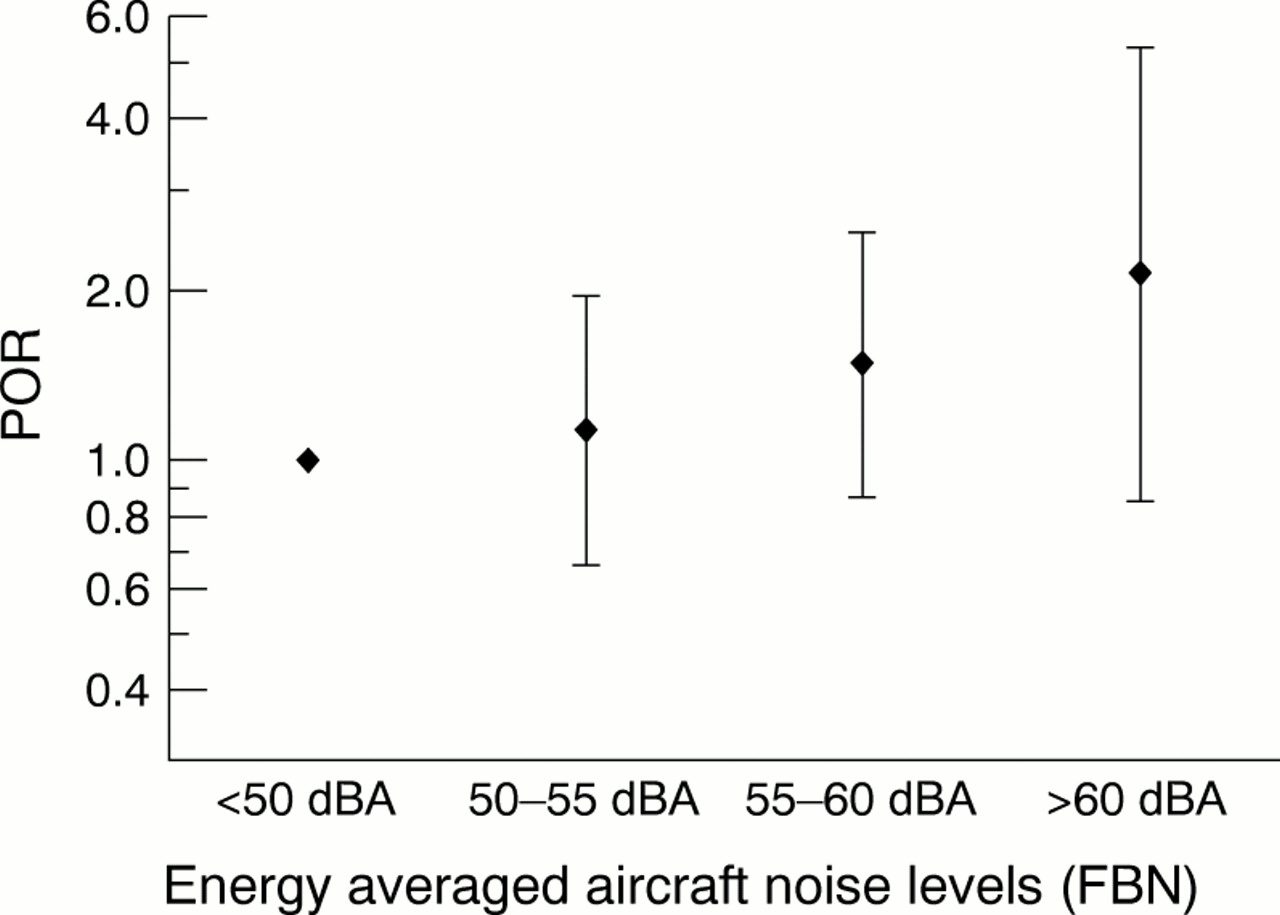
Risk for hypertension in different categories of equal energy aircraft noise levels (FBNs). Midpoints represent adjusted prevalence odds ratios (PORs) and error bars are 95% CIs.

Risk for hypertension in different categories of maximum aircraft noise levels (MNLs). Midpoints represent adjusted prevalence odds ratios (PORs) and error bars are 95% CIs.
Discussion
The prevalence of hypertension was found to be higher among subjects exposed to time weighted energy averaged aircraft noise levels of at least 55 dBA, or maximum levels above 72 dBA occurring at least three times during the average 24 hour period in 1 year. The national guideline values for exposure to aircraft noise proposed by the Swedish government are 55 dBA as energy averaged aircraft noise level and 70 dBA as maximum level.15 There was a high correlation between the two exposure measures and it was not possible to adequately separate the effect of the two measures in this study. However, aircraft noise defined as peak levels or number of events have been shown to be better related to the annoyance reaction than energy equivalent levels.11 Thus, despite the considerable overlap between the two exposure measures, this study suggests that it may be important to take maximum levels into account also when studying other health effects from exposure to aircraft noise, as suggested by the indication of a higher risk among those exposed to high maximum but low energy averaged noise levels.
Surprisingly few studies have investigated potential physiological effects from community exposure to aircraft noise, but some investigations have suggested that aircraft noise might be a risk factor for high blood pressure.3-6 A comparison with the results from previous studies on aircraft noise and hypertension is difficult because of differences in exposure measures and the lack of comparable outcome variables (self reported diagnosis or medical treatment v measured mean systolic or diastolic blood pressure) or reported risk estimates. In occupational settings dose-response relations between industrial exposure to noise and hypertension have been suggested,16 17 but to our knowledge this has not been previously reported for aircraft noise. Community noise exposure, such as aircraft noise, may act as a stressor and thus increase the risk for hypertension.1 2
The risk for hypertension from exposure to aircraft noise seemed greater among those not reporting hearing disabilities, indicating that hearing loss might protect against aircraft noise. It is well known that exposure to occupational noise is a risk factor for hearing loss and it has been argued that loss of hearing can protect against non-auditory effects of noise exposure.18 It is also possible that hypertension could increase the risk for loss of hearing,18 19 thus the interrelation between hearing loss and hypertension should be interpreted with caution.
A limitation of this study is that some important risk factors for hypertension—for example, family history of hypertension and body mass index—were not recorded. However, when adjusting for accessible factors—for example, physical activity and diet—the risk estimates remained unchanged. In the analyses we controlled for socioeconomic status by including educational level in the model, and additional adjustment for residential type did not influence the results. However, it cannot be ruled out that uncontrolled confounding contributed to the results, but it is unlikely that this would explain the exposure-response relations.
Although information on both exposure and disease applied to the same year, the analysis was restricted to those who had resided at the address for at least 1 year, which reduced the possibility of disease preceding exposure. Also, even if the exact date of diagnosis is unknown (during the past 5 years) and the information on duration of residence was crude (1–10 years or more than 10 years), only 21 exposed subjects with hypertension had lived at the address for 1–10 years, corresponding to 5% of all hypertensive subjects in the study population. The exposure classification was based on information of the subjects' home addresses; thus exposure occurring outside of the home (for example, occupational exposure) was not considered. Misclassification of exposure might occur, but it is not likely that the exposure classification would be dependent on disease status. Therefore, any bias introduced by such non-differential misclassification would be expected to mainly weaken any associations.
Self reported diagnosis of hypertension by a doctor constituted the outcome measure in the study; thus recall bias cannot be excluded. However, we think it unlikely that people living near the airport would be more prone to recall a medical diagnosis of hypertension than others, or that the diagnosis systematically would be set more often among those living closer to the airport. Also, the question used for the classification was taken from an extensive questionnaire including 87 questions covering mainly indoor environmental hazards and risk factors for allergy. Thus, the data on outcome and exposure were collected independently to a large extent and it is unlikely that the subjects would link their response to the survey question on hypertension to the distance between the airport and their home. Also, analysis using other dependent variables—for example, asthma, chronic obstructive pulmonary disease, and eczema—showed no signs of overreporting of disease in the airport sample.
In conclusion, our findings suggest that community exposure to aircraft noise may cause hypertension. This implies that aircraft noise might be a risk factor also for cardiovascular disease.