Article Text

Abstract
OBJECTIVE To give the observed and expected deaths due to cancer at all separate sites in asbestos workers in east London, and to analyse these for overall effect and exposure-response trend.
METHODS The mortality experience of a cohort of over 5000 men and women followed up for over 30 years since first exposure to asbestos has been extracted.
RESULTS There was a large excess of deaths due to cancer (537 observed, 222 expected). Most of these were due to cancer of the lung (232 observed, 77 expected) and pleural (52) and peritoneal (48) mesothelioma. The exposure-response trend for all these three causes was highly significant. There was also an excess of cancer of the colon (27 observed, 15 expected) which was significantly related to exposure. There were significant excesses of cancer of the ovary, of the liver, and of the oesophagus but with no consistent relation to exposure.
CONCLUSIONS The excess risk of cancer after exposure to asbestos was mainly due to cancer of the lung and mesothelioma. An exposure related excess of cancer of the colon was also detected but the possibility that some of these deaths may have been peritoneal mesotheliomas could not be excluded. There was no consistent evidence of exposure related excesses at any other site.
- asbestos
- cancer
- exposure-response
Statistics from Altmetric.com
The mortality of a group employed at an asbestos factory in the east end of London has been described in several publications.1-9 The group consisted of about 3000 men and 700 women factory workers and of 1400 laggers (insulators). The factory workers were involved in the manufacture of asbestos textiles and products—such as prefabricated cement pipes. Crocidolite was used until the mid-1950s as well as amosite and chrysotile asbestos. The laggers worked on contracts outside the factory with intermittent and varying exposure, and some had worked as insulators before their employment by this factory. The men were those first employed between May 1933 and 1964 who worked at the factory for at least 30 days, and the women were those first employed between 1936 and 1942. The most recent analyses were of the follow up to June and December 1980 for women and men respectively. Since that analysis follow up of the groups stopped. The previous publications reported exposure related excess deaths due to lung cancer and pleural and peritoneal mesothelioma. Several other cancer types were considered in some of the papers but the complete listing of all cancer sites has not been published. In view of the interest that occurs from time to time on the possibility that asbestos exposure increases risk of cancer at several sites it was considered appropriate to give the results for all sites while summary data are still available.
Methods
Causes of death were coded according to the 7th revision of the international classification of diseases (ICD-7). The cause of death coded was that given on the death certificate except that where a confirmed mesothelioma was found, the mesothelioma was taken as the cause of death irrespective of what was on the death certificate. Cancer deaths have been taken as ICD-7 codes 140 to 239 inclusive. In previous reports codes 140 to 205 have been used. The inclusion of codes 210 to 229 (benign neoplasms) and 230–239 (neoplasm of unspecified nature) involved only one extra death (ICD-7 237, neoplasm of brain or other part of nervous system).
The mortality was assessed by comparing the number of observed deaths with the number expected based on sex, age, and period specific death rates for England and Wales, calculated with the person-years method, and the tables of person-years produced for the most recent previous analysis.8 The first 10 years after first employment in the factory were excluded. In previous analyses the mortality covered the period from 1943 for men and from 1946 for women (10 years after first entry into the study) but because of the availability of cancer death rates for all the sites attention is now restricted to mortality from 1951 onwards. The effect of this change is trivial as the period excluded contained only 12 (expected 11.7) of the 1249 deaths from all causes and two (expected 2.0) of the 539 due to cancer.
Exposure was classified by degree (low to moderate versus severe) and duration (2 years or less and more than 2 years). Fuller details of the classification of jobs were given by Newhouse.1Briefly, the low to moderate category included administrative workers, store workers, those involved in the manufacture of insulating material with less than 20% asbestos, and maintenance staff. Workers in this category did not work regularly in areas where the 1931 asbestos regulations applied. The severe intensity category included workers involved in sectional pipe making, the manufacture of insulating material with a high asbestos content, workers in the textile and mattress sections, openers, disintegrators, and those employed in the disposal of dust. These jobs were all covered by the 1931 Asbestos Regulations. The terms low to moderate and severe are relative to the period during which the factory operated, and the exposures in the low to moderate jobs were usually higher than those specified in the 1969 Asbestos Regulations.7 Amosite, chrysotile, and crocidolite were all used and much of the exposure was to mixed types. It was not possible to isolate groups exposed to a single fibre type.8 The laggers (all men) were kept as a separate group. Most of the workers in all groups had been followed up for over 20 years, 41% of the male and 80% of the female production workers had been followed up for more than 30 years, whereas 9% of the laggers had been followed up beyond 30 years.8
The ratio of observed to expected deaths was used as a measure of excess mortality, and significance was calculated by taking the observed number as a Poisson variable. The exact confidence interval of the ratio was derived with the relation between the Poisson and the χ2 distributions. For assessment of an exposure-response relation the exposure groups were ranked in increasing order of exposure as low to moderate (all durations), severe (2 years or less), laggers, severe (greater than 2 years) based on the excess mortality due to lung cancer. The exposure-response relation was assessed by a trend χ2 test.10 For many of the sites the expected number of cases was small and the exposure-response assessed with an exact test computed with StatXact.11 Two tailed significance levels are given and for exact tests these are double the one tail probability.
For mesotheliomas, as the expected number was very low, the incidence was expressed as an absolute rate. Trend with exposure has been assessed by taking the expected numbers of mesotheliomas in the four exposure groups as proportional to person-years weighted by time since first exposure raised to a power of 3.5, and the rates have been adjusted to 25 years since first exposure.
Results
Table 1 shows the comparison of observed and expected mortality over the whole group of men and women. Those classified as other sites are peritoneum (ICD-7 158) not confirmed as mesothelioma (four); endocrine (ICD-7 195, two); thoracic secondary (ICD-7 165, one); and other unspecified (ICD-7 199, 26). As well as pleural and peritoneal mesotheliomas there were five sites with a significant excess of deaths: lung (relative risk (RR) 3.0, 95% confidence interval (95% CI) 2.6 to 3.4), liver (RR 2.7, 95% CI 1.3 to 4.9), ovary (RR 2.5, 95% CI 1.2 to 4.8), oesophagus (RR 2.1, 95% CI 1.1 to 3.6) and colon (RR 1.8, 95% CI 1.2 to 2.7). In table 2 the observed and expected mortality are shown for the different groups of subjects. In table 3the observed numbers of mesotheliomas and the rates and adjusted rates are given. For the seven sites with a significant overall excess there were four that had a significant trend with exposure: lung (p<0.001), peritoneal mesothelioma (p<0.001), pleural mesothelioma (p=0.011), and colon (p=0.017). For cancer of the ovary the significance level for the exposure trend was 0.18, but there was a significant excess in women with severe exposure of more than 2 years. For cancer of the liver the excess was distributed across all the exposure groups and the exposure trend was not significant (p=0.77). This was also the case for cancer of the oesophagus (p=0.98). The only other site for which the exposure-trend relation was significant at even the 10% level was the breast (p=0.08); there was a non-significant excess in women with severe exposure of more than 2 years but little overall excess at this site.
Observed and expected deaths for all men and women
Observed and expected mortality for separate exposure groups
Observed numbers of mesotheliomas, rates per 100 000 person-years and adjusted rates for 25 years follow up for separate exposure groups
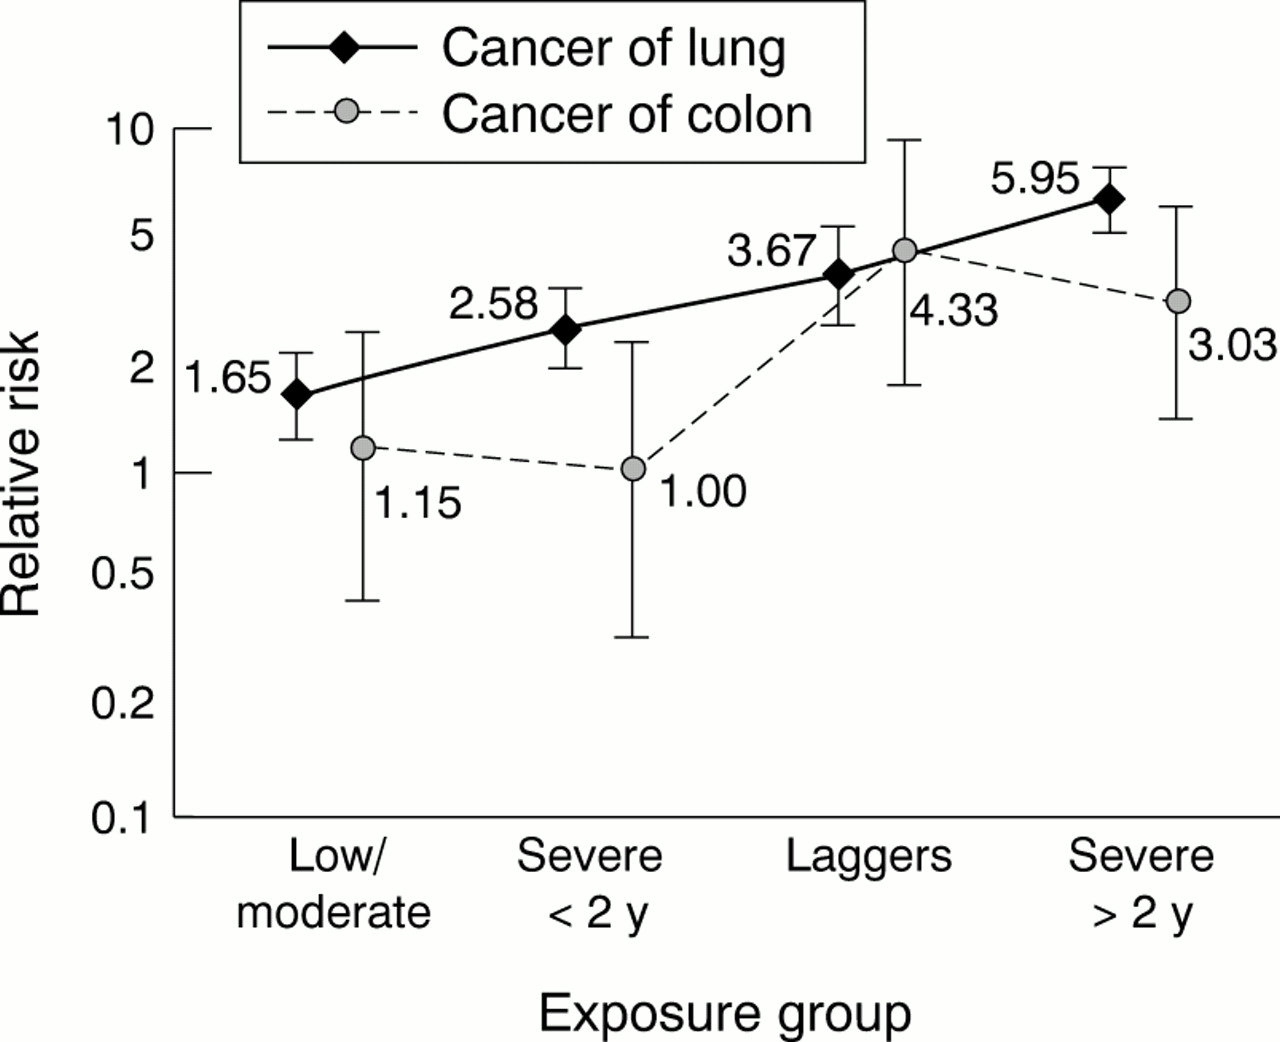
The trend relations are shown in figures 1 and 2 for the four sites which are in excess overall and have a significant relation with exposure. The increasing risk of mesothelioma with increasing exposure is clear (fig 1), but stronger for the peritoneum than for the pleura. There was also a steady trend in relative risk of lung cancer with increasing exposure (fig 2). The excess in cancer of the colon occurred only in the laggers and in men with severe exposure for more than 2 years (table 2).

Exposure-response relations for pleural and peritoneal mesotheliomas. Mesothelioma rates are per 100 000 person-years adjusted to 25 years after first exposure. The 95% confidence intervals are shown.

Exposure-response relations for cancer of the lung and cancer of the colon. Rates are relative risks compared with national rates adjusted for sex, age, and period. The 95% confidence intervals are shown.
Discussion
The overall excess was assessed on all men and women. There was evidence of excess lung cancer in the lowest exposure group (low to moderate 49 observed to 29.8 expected) and 16 mesotheliomas occurred in this group. Therefore, the exposure was sufficient in all exposure groups to produce an effect related to asbestos. The excess deaths due to cancer of the lung and both pleural and peritoneal mesothelioma and the exposure-response relations for these three causes are well established. The only other site which had a significant excess and a significant exposure-response relation was the colon (ICD-7 153; RR 1.8, 95% CI 1.2 to 2.7, p=0.017). In our previous report results for the wider grouping of gastrointestinal cancer (ICD-7 150–158) were given and an overall excess noted but without a significant relation with exposure.8 For this combined grouping there was a significant excess (observed 101, expected 67.2, RR 1.5, 95% CI 1.2 to 1.8) but the exposure-response was non-significant (p=0.10). For colorectal cancer (ICD-7 152-154) there was a significant excess (observed 39, expected 25.3, RR 1.5, 95% CI 1.1 to 2.1) but again a non-significant exposure-response (p=0.10). The significant and exposure related excess of cancer of the colon was diluted in the wider groups by cancer of the stomach, rectum, and pancreas, which showed little excess and cancer of the oesophagus and liver, which showed excesses not strongly related to exposure. The excess of cancer of the colon was confined to men who had worked as laggers or been severely exposed for more than 2 years.
As with all mortality studies the results depend on the accuracy of cause of death information. To be able to compare the observed number of deaths with the expected calculated from national records the cause of death as recorded on the death certificate was accepted except that some deaths were reclassified as due to mesothelioma, and some originally classified as mesothelioma were not confirmed as such, on review of pathological material.2 8 Of the 52 pleural mesotheliomas 37 had been coded as ICD-7 163, 11 as lung cancer (ICD-7 162), and four as other sites. Of 46 peritoneal mesotheliomas 26 had been coded as ICD-7 158, nine as other unspecified (carcinomatosis) ICD-7 199, six as cancer of the gastrointestinal tract (two stomach ICD-7 151, three rectum ICD-7 154, one pancreas ICD-7 157), one as cancer of the ovary (ICD-7 175), and four as other causes. It was not possible to check all cancer deaths as pathological material was not always accessible and it is not known for how many of the 27 deaths from cancer of the colon the pathological material was checked. Although none of the peritoneal mesotheliomas identified had been certified as cancer of the colon, three had been certified as cancer of the rectum, an adjacent site, so it cannot be excluded that a few of the deaths certified as due to cancer of the colon may have been peritoneal mesotheliomas. Therefore, it cannot be accepted that there is an excess of cancer of the colon attributable to asbestos unless there is support from other studies of asbestos workers.
Many of the sites have low observed and expected mortality. Cancer at these sites cannot contribute much to the total effect of exposure in terms of the absolute number of excess deaths compared with the large excesses from cancer of the lung and mesothelioma. For rare causes an excess of relative risk would be difficult to establish from a single study and a meta-analysis is required. Such a meta-analysis has recently been carried out for cancer of the kidney.12 The results given in this paper provide the information necessary for any future meta-analysis study of asbestos workers.
Acknowledgments
We are grateful to Professor Julian Peto (Institute of Cancer Research) who provided the death rates for the cancer sites for England and Wales from 1951 in electronic form.