Article Text

Abstract
Objectives We recently constructed a general population job exposure matrix (JEM), The Shoulder JEM, based on expert ratings. The overall aim of this study was to convert expert-rated job exposures for upper arm elevation and repetitive shoulder movements to measurement scales.
Methods The Shoulder JEM covers all Danish occupational titles, divided into 172 job groups. For 36 of these job groups, we obtained technical measurements (inclinometry) of upper arm elevation and repetitive shoulder movements. To validate the expert-rated job exposures against the measured job exposures, we used Spearman rank correlations and the explained variance according to linear regression analyses (36 job groups). We used the linear regression equations to convert the expert-rated job exposures for all 172 job groups into predicted measured job exposures. Bland-Altman analyses were used to assess the agreement between the predicted and measured job exposures.
Results The Spearman rank correlations were 0.63 for upper arm elevation and 0.64 for repetitive shoulder movements. The expert-rated job exposures explained 64% and 41% of the variance of the measured job exposures, respectively. The corresponding calibration equations were y=0.5%time+0.16×expert rating and y=27°/s+0.47×expert rating. The mean differences between predicted and measured job exposures were zero due to calibration; the 95% limits of agreement were ±2.9% time for upper arm elevation >90° and ±33°/s for repetitive shoulder movements.
Conclusions The updated Shoulder JEM can be used to present exposure–response relationships on measurement scales.
- Shoulder
- Occupation
- Job exposure matrix
- Exposure modelling
Statistics from Altmetric.com
What this paper adds
We recently constructed a general population job exposure matrix (JEM), The Shoulder JEM, which covers all Danish occupational titles. The Shoulder JEM provides estimates of occupational mechanical exposures based on expert ratings of for example, upper arm elevation and repetitive shoulder movements.
In the present study, technical measurements using inclinometry of upper arm elevation and repetitive shoulder movements were obtained for 36 of the 172 job groups in The Shoulder JEM.
Using the measured job exposures, we converted the expert-rated job exposures for all 172 job groups to measurement scales.
The updated Shoulder JEM can be used to present exposure–response relationships on measurement scales.
Introduction
Musculoskeletal disorders rank as the second most dominant cause of years lived with disability1 and account for substantial numbers of healthcare visits and costs in Western countries.2 ,3 Subacromial impingement syndrome (SIS) is the most frequently diagnosed shoulder disorder,4–6 with a 1-year prevalence of 2–7% in the working population.7 ,8 There is evidence of associations between occupational mechanical exposures and clinically diagnosed SIS,9 ,10 and to some extent even surgery for SIS.11 ,12
To set national priorities for preventive efforts of work-related SIS, there is a need for a population-based overview of the distribution of the relevant exposures across occupational groups. Such an overview can be provided by a general-population job exposure matrix (JEM). A general-population JEM would also be a valuable tool in studies of exposure–response relationships. Exposure–response relationships from studies comparing few occupational groups (eg, slaughterhouse workers and chemical factory workers,13 or house painters, car mechanics and machinists),14 may be difficult to generalise to the general working population due to differences in the composition of the exposures. Studies across a variety of occupational groups using a general-population JEM would help to overcome this problem. Finally, JEM-based estimates of the exposure prevalence in the population can be combined with exposure–response estimates to calculate the expected number of cases that could be prevented by reducing high-exposure levels to a certain limit.
We have recently constructed The Shoulder JEM, a general-population JEM for large-scale epidemiological studies of shoulder disorders.11 ,12 The Shoulder JEM is based on expert ratings of several occupational mechanical exposures, for example, upper arm elevation >90° and repetitive shoulder movements.11 ,12 The Shoulder JEM has shown good predictive validity with respect to shoulder surgery11 ,12 and associations with shoulder pain.15 However, any systematic overestimation or underestimation in the expert-rated job exposures would produce inadequately protective or unnecessarily strict exposure guidelines, respectively.16 To take account of any systematic inaccuracy in the expert-rated job exposures, measured job exposures may be used to calibrate the expert-rated job exposures into predicted measured job exposures on measurement scales, provided that the expert-rated and measured job exposures correlate. Exposure–response relationships on measurement scales would facilitate translation of exposure–response results into practice, for example, to estimate the risk of SIS in relation to exposures that are measured in connection with labour inspection visits. Exposure–response results on measurement scales would also enable future pooling of results across studies,17 which, at present, entails a major challenge due to heterogeneity in exposure assessment.9
In the original Shoulder JEM, the expert-rated job exposures were considered equal for men and women in the same occupational group. This may not be a valid assumption because task distributions may be sex-segregated, and task exposures may differ between men and women.18–20 Sex-specific JEMs may therefore be necessary to ensure accurate exposure measures for both sexes so that they would be equally protected by preventive guidelines.
The overall aim of this study was to convert the expert-rated job exposures for upper arm elevation >90° and repetitive shoulder movements in The Shoulder JEM to measurement scales. The specific aims were (1) to validate the expert-rated job exposures against the measured job exposures, (2) to convert the expert-rated job exposures to predicted measured job exposures and (3) to estimate the agreement between the predicted measured job exposures and the measured job exposures.
Methods
Study design
We used the expert-rated job exposures from The Shoulder JEM11 ,12 supplemented by technical measurements (inclinometry). To obtain as many technical measurements as possible, the technical measurement programme was coordinated with a corresponding technical programme in a Danish study of the wrist (goniometry),18 ,21 so that inclinometer and goniometer measurements were performed simultaneously. In addition to the Danish programme that covered 23 job groups, we included previous technical measurement data for 13 job groups collected by the Department of Occupational and Environmental Medicine, Lund, Sweden. The total technical measurement programme covered 36 of the 172 job groups in The Shoulder JEM. The Danish and Swedish technical measurements were performed with identical methods.
The study was approved by the Danish Data Protection Agency (j. nos.: 2012-41-1187 and 2010-41-5325) and accepted by the Regional Committee on Biomedical Research Ethics for the Capital Region of Denmark (identification no. H-C-FSP-2010-036). According to the Regional Committee on Biomedical Research Ethics for Central Denmark Region, the project did not require their approval (request no. 130/2009). Participants gave informed consent.
The original shoulder JEM
We have previously outlined the construction of The Shoulder JEM.11 ,12 In brief, we excluded 185 obsolete or very rare occupational titles from a total of 2227 titles in the Danish version of the International Standard Classification of Occupations from 1988 (D-ISCO 88). The remaining 2042 titles were divided into 172 job groups with expected homogeneous exposure patterns regarding all occupational mechanical exposures that we intended to assess (ie, upper arm elevation >90°, repetitive shoulder movements, forceful shoulder exertions, lifting/carrying, pushing/pulling, use of handheld vibrating tools and computer work). The present study was restricted to upper arm elevation and repetitive shoulder movements.
In 2010, five specialists in occupational medicine with at least 10 years of experience from departments of occupational medicine performed the ratings. The experts first agreed on the occupational mechanical exposure estimates for 11 benchmark groups, which were selected from the whole exposure spectrum, so that they could serve as a common scale.22 For each of the remaining 161 job groups, the experts independently rated the exposures in terms of a full working day of 7.5 h. To enable the experts to base their ratings on their clinical experience as specialists in occupational medicine, they were asked to estimate the exposures that they would expect to reach after interviewing a typical employee as part of their history-taking for a medical record. The durations of upper arm elevation >90° and repetitive shoulder movements were rated in ½ hour intervals. For the total period with repetitive shoulder movements per day, the experts categorised the typical frequency as either moderate (≥4 to <15/min) or high (≥15/min).23 In the present study, we disregarded the distinction between moderately and highly repetitive work because this information was captured by the estimated duration (moderately repetitive work typically takes place for a limited part of the working day, whereas highly repetitive work typically takes place for most of the working day).
The experts discussed large differences in the initial ratings at a meeting, and after agreeing on job components, a number of outlying estimates were changed by each expert. In this way, we aimed to synthesise the best features of consensus ratings and independent assessments.24 ,25 For each job group, expert-rated job exposures were calculated as the mean of the experts' ratings. The original Shoulder JEM did not include sex-specific exposure estimates.
The total technical measurement programme
In the Danish technical measurement programme, our temporal, technical and financial resources allowed us to perform 300–350 whole-day technical measurements. With a view to correct estimation of exposure–response relationships in later JEM-based studies, we planned the programme so that it represented large exposure contrasts and included frequent job groups for men and women. We gave priority to job groups that were highly exposed according to the experts, but also included job groups with intermediate and low exposures. The programme covered 23 job groups.
In addition to the Danish programme, we included previous technical measurement data from Sweden for 13 job groups, which we expected to have similar exposures as their Danish counterparts. An overview of the measurements for 11 of these groups has been provided previously (table 1),26 that is, hairdresser (study group 43f, (f, female) 33 women), fish industry worker (study group 33m, (m, male) 8 men), manual packer (study group 29f, 7 women), childcare worker (study group 9f, 11 women), cleaner (study group 42f, 23 women), wood industry worker (study group 6f, 6 women), slaughterhouse worker (study group 35m, 10 men), dental hygienist (study group 40f, 12 women), office worker (study group 3f, 24 women; study group 3m, 17 men), dentist (study group 39f, 14 women; study group 39m, 10 men), and assembly worker (study group 27f, 9 women; study group 27m, 9 men). The remaining two job groups were electrician (12 men excluding Brazilian data)27 and truck-/forklift operator (10 men).28
Characteristics of the participants in the Danish technical measurement programme
The total technical measurement programme covered 36 job groups: 17 job groups for men only, 9 job groups for women only, and 10 job groups for both men and women.
Organisation of the Danish technical measurement programme
From each selected job group, we chose one occupational title, which we thought was representative of the job group. For each of these occupational titles, we received a list of all public and private businesses in and around the two largest Danish cities (Copenhagen and Aarhus) using the Danish Central Business Register. From the list, we randomly sampled 25 companies with at least five employees. In a random order, we sent a written invitation to these companies until five companies accepted to take part. Around Aarhus, participating companies were asked to provide a list of all employees with the occupational title in question, and the employees were asked to participate in a random order, until two persons had agreed. Around Copenhagen, companies with few employees were asked to identify two employees, who would volunteer to participate. To be included, the employees had to be >18 years old, of the prespecified sex, full-time employed, right-handed and generally healthy without neck or upper extremity complaints which interfered with the way they performed their work. For all participants, we registered age, sex, height, weight and duration of employment.
A priori, we decided to obtain measurements for 10 men or 10 women for each occupational title in order to obtain sufficiently accurate and precise measured job exposure estimates.29 For some job groups with a high representation of both sexes, we decided to obtain measurements for 10 men and 10 women; as an exception, we performed measurements for 25 male and 25 female house painters because these measurements were also intended for detailed studies of this occupational group.18 ,21
To account for seasonal exposure variations, we distributed the measurements from March 2011 to March 2012. The measurements were performed on ordinary working days from Monday to Thursday, while Friday was avoided because it was often a short working day. The measurements were obtained for whole working days in order to obtain as representative measures of typical job exposures as possible. Since we wanted to estimate mean job exposures, we chose to distribute the measurements with 1 day rather than more days per person.30
Inclinometry
All measurements were performed using inclinometers based on triaxial accelerometers (Logger Teknologi HB, Åkarp, Sweden), which measured postures and movements for the head, upper back and both upper arms. Only right arm data were used in the present study. The inclinometers per se have an accuracy of 1.3° and a reproducibility of 0.2°, and are considered valid for measuring during work.31 ,32 Data were sampled at 20 Hz using a data logger (Logger Teknologi HB, Åkarp, Sweden).33 The participants were asked to work as usual, and to register the timing of lunch and coffee breaks.
A recent study suggested that inclinometry may underestimate upper arm elevation angles >90° by more than 10° when compared to observation.34 To evaluate the possibility of underestimation, we used the Danish technical measurements during a 90° abduction test that we performed as a general quality check. For the right upper arm, the mean elevation during the test was 91.0° (SD 7.0°) for the 216 men and 90.3° (SD 5.8°) for the 113 women who performed the test. Most likely, these negligible differences could be explained by our use of small plates when mounting the inclinometers.35
Processing of inclinometry data
The inclinometry data were analysed using EMINGO, a programme for analysing ElectroMyography, INclinometry and GOniometry, developed by the Department of Occupational and Environmental Medicine, Lund, Sweden. The data were processed to yield the percentage of the measurement time excluding breaks, which was spent with the upper arm elevated >60° and >90°, the 90th and 99th percentiles of the angular distributions (ie, the angles that were exceeded for 10% and 1% of the time, respectively), and the median angular velocity (°/s) of the upper arm. Since the experts were asked to rate %time with the upper arm elevated >90° (in accordance with their usual focus during history taking for a medical record), we a priori chose to present results for this variable as our primary exposure estimate of upper arm elevation. We used the median angular velocity as our measurement-based operationalisation of repetitive movements. We calculated the measurement variables for each person, and to obtain measured job exposure estimates, we calculated the arithmetic mean of these values for each occupational title. For occupational titles with measurements for both sexes, we calculated measured job exposure estimates disregarding sex and sex-specific measured job exposure estimates.
Statistical analyses
To validate the expert-rated job exposures against the measured job exposures, we visually assessed the degree of symmetry between the exposures estimates for the 36 job groups, where measured job exposures were available. We also performed Spearman rank correlation analyses between the expert rated and the measured job exposures disregarding sex. Furthermore, we estimated the explained variance  according to linear regression analyses of the measured job exposures on the expert-rated job exposures. We used t test to compare the mean of the sex-specific measured job exposures across the 10 occupational titles, where we had measurements for both sexes. We also used t test to compare the sex-specific measured job exposures for each of these 10 occupational titles. To evaluate if the experts systematically overestimated or underestimated the exposures for either men or women, we compared the sex-specific calibration equations (see below).
To convert the expert-rated job exposures to predicted measured job exposures (ie, measurement scales), we used the linear regression analyses described above. The intercept (α) and the slope of the regression line (β) (ie, the regression coefficient) from these analyses were used in the calibration equations:
The linear regression analyses were performed using (1) measured job exposure disregarding sex (36 job groups), and (2) sex-specific measured job exposure (27 job groups for men and 19 job groups for women). To evaluate if the experts systematically overestimated or underestimated the exposures for either men or women, we compared the intercept and slope estimates of the sex-specific calibration equations using likelihood-ratio analyses. In all regression analyses, different data transformations were analysed (log-transformation and square root-transformation), but the non-transformed data yielded the highest  . The assumptions behind linear regression were met for all analyses. To convert the expert-rated job exposures into predicted measured job exposures, we simply inserted the expert-rated job exposures in the calibration equations disregarding sex and the sex-specific calibration equations, thereby constructing predicted measured job exposures for all 172 job groups.
To evaluate the agreement between the predicted measured job exposures and the measured job exposures, we repeated the regression analyses disregarding sex, this time by means of delete-one jackknife resampling, that is, using exposure data from all other job groups to estimate the calibration equations for each specific job group. The predicted measured job exposures were then compared with the measured job exposures using Bland-Altman plots with 95% limits of agreement.36 The assumptions behind the Bland-Altman plots were met. All analyses were performed using STATA V.13.1 (StataCorp LP, College Station, Texas, USA).
Results
The technical measurements represented 575 working days; 339 in Denmark and 236 in Sweden. Table 1 shows characteristics of the participants in the Danish technical measurement programme.
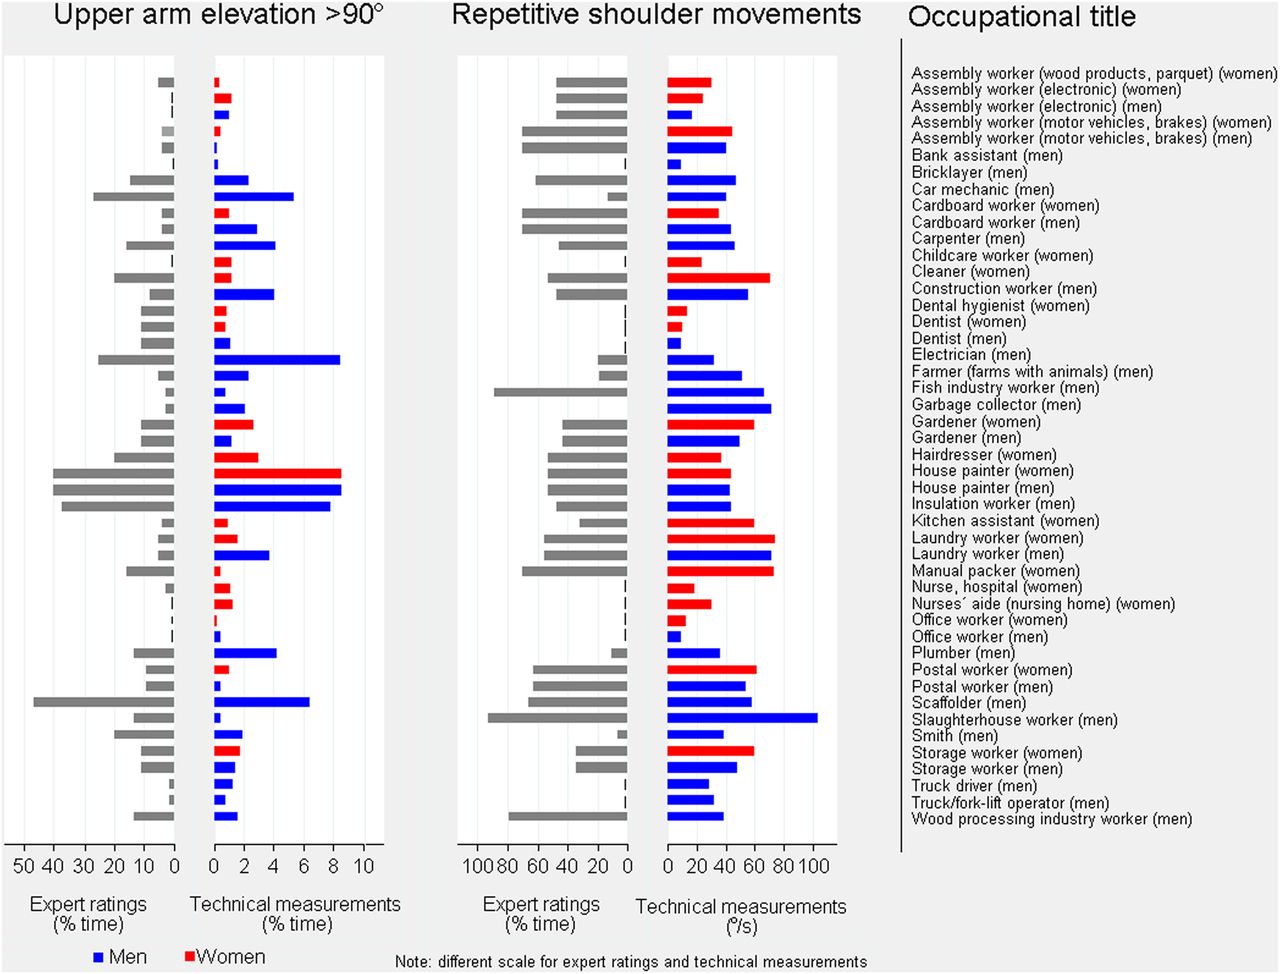
Figure 1 shows the expert-rated job exposures and the sex-specific measured job exposures for the 36 job groups where measured job exposures were available. The scales for the expert-rated and the measured job exposures are different. Of note, the experts generally overestimated %time with upper arm elevation >90°. Figure 1 shows quite a high degree of symmetry, which was further supported by Spearman rank correlation coefficients of 0.63 and 0.64 for upper arm elevation and repetitive shoulder movements, respectively. For %time >90°, the expert-rated job exposures explained 64% of the variance of the measured job exposures  . The explained variance
  for %time >60° and the 90th and 99th centiles ranged between 0.46 and 0.56 (lowest for %time >60°). For repetitive shoulder movements, the explained variance was 0.41.

Expert-rated job exposures and measured job exposures of upper arm elevation >90° (left panel) and repetitive shoulder movements (right panel). Blue and red columns pointing to the right represent sex-specific measurements for men (27 job titles) and women (19 job titles), respectively.
We found no statistically significant differences in sex-specific measured job exposures when we compared the mean values across the 10 occupational titles, where we had measured job exposures for both sexes (p=0.7–0.9). Statistically significant differences in sex-specific measured job exposures were found for %time >90° for gardener (men 1.2 %time and women 2.7 %time), postal worker (men 0.4 %time and women 1.0 %time), and laundry worker (men 3.7 %time and women 1.6 %time), and for repetitive movements for assembly worker (electronic) (men 17°/s and women 24°/s), and postal worker (men 54°/s and women 62°/s). We found no indication that the experts systematically overestimated or underestimated the exposures for either men or women (see the comparison of the sex-specific calibration equations below).
Figure 2 shows the linear regression analyses which we used to convert the expert-rated job exposures to predicted measured job exposures. For %time >90°, the calibration equation disregarding sex was y=0.5 %time+0.16×expert rating (95% CI −0.2 to 1.2 for the intercept and 0.12 to 0.20 for the slope). The sex-specific calibration equations were y=0.7 %time+0.16×expert rating for men and y=0.2 %time+0.15×expert rating for women, without statistically significant sex-differences (p=0.4 for the intercept and p=0.6 for the slope). For repetitive movements, the calibration equation disregarding sex was y=27°/s+0.47×expert rating (95% CI 18 to 35 for the intercept and 0.28 to 0.66 for the slope). The sex-specific calibration equations were y=27°/s+0.43×expert rating for men and y=21°/s+0.58×expert rating for women, without statistically significant sex-differences (p=0.6 for the intercept and p=0.7 for the slope).

Linear regression of measured job exposures on expert-rated job exposures for upper arm elevation >90° and repetitive shoulder movements (duration vs median angular velocity). Regression lines disregarding sex (n=36 job exposures, upper panel) and sex-specific regression lines (n=46 job exposures; 27 for men and 19 for women, lower panel).
According to figure 3, the mean difference between the predicted and measured job exposures was zero for all exposure estimates due to the calibration. For %time >90°, the SD of the difference was 1.5 %time and the 95% limits of agreement were ±2.9 %time; one job title (electrician) was outside these limits. For repetitive shoulder movements, the SD of the difference was 17°/s, and the 95% limits of agreement were ±33°/s; two job titles were outside these limits (slaughterhouse worker and garbage collector).

Bland-Altman plots of predicted measured job exposures and measured job exposures (%time with upper arm elevation >90° and repetitive shoulder movements in terms of median angular velocity (°/s)) for the 36 job groups where both expert-rated and measured job exposures were available (estimates disregarding sex). Predicted measured job exposures were calculated using delete-one jackknife resampling.
Thus, we updated the Shoulder JEM so that—in addition to the original expert-rated job exposures—it now includes predicted measured job exposures for all 172 job groups (estimates disregarding sex and sex-specific estimates) and measured job exposure for 36 job groups. The JEM also provides estimates for D-ISCO 88 codes. For the measured job exposures, the JEM includes mean, SD, and number of measurements for men and women, respectively. Online supplementary appendix 1 illustrates the composition of the updated Shoulder JEM with respect to %time >90° for five selected occupational titles.
Supplementary appendix
Discussion
Our results showed good validity of the expert-rated job exposures when compared to the measured job exposures in terms of ranking and explained variance, and the expert-rated job exposures did not systematically overestimate or underestimated the measured job exposures for either men or women. Systematic differences between expert-rated and measured job exposures were corrected by converting the expert-rated job exposures to predicted measured job exposures. The Shoulder JEM was updated to include measured job exposures for 36 job groups (10 of them for men and women), and exposure estimates on measurement scales for 172 job groups covering all occupational titles in Denmark.
The expert-based Shoulder JEM has shown high predictive validity with respect to surgical treatment of SIS,11 ,12 and the expert-rated shoulder exposures were more closely associated with shoulder pain than with upper body pain (pain in hands, wrists, forearms, elbows, shoulders and/or neck), which indicates that the expert-based job exposures reflect shoulder exposures quite specifically.15 The experts generally overestimated %time >90°, when compared to the measured job exposures. This was expected because the experts were not asked to estimate measured exposures, rather they were asked to let their ratings reflect the job exposure estimates that they would expect to reach during history-taking for medical records as part of their clinical work as specialists in occupational medicine.
We did not perform measurements for more than one occupational title per job group because we prioritised to obtain measured job exposures for as many job groups as possible. To the extent that we did not succeed in constructing homogeneously exposed job groups, the occupational title that we selected for the measurements may not have yielded exposure estimates that were representative for the whole job group, which might lead to underestimation of the validity of the expert ratings. If we had constructed a JEM with fewer job groups, we might have been able to cover all groups with our measurement programme. On the other hand, we assumed that the groups would become more heterogeneous with increasing size, at least with respect to some of the exposures that the experts rated. Large groups would also tend to move the group means toward the population mean, which would narrow the spread of the job exposures and increase the uncertainty of estimated exposure–response relationships.16 ,37
We calibrated the expert-rated job exposures into predicted measured job exposures, so that estimated exposure–response relationships would reflect the risk associated with measured job exposures, for example, in connection with labour inspection visits. Exposure estimates obtained by different methods may be combined in different ways.38 ,39 We chose linear regression calibration as a simple and transparent method to convert the expert-rated job exposures to measurement scales. In future calibration studies, it might be of value to include additional predictors, such as duration of employment,18 to increase the accuracy and precision of the predicted measured job exposures.
An additional feature of the conversion of expert-rated job exposures to measurement scales is that although the experts rated %time >90°, the expert-rated job exposures could also be converted to, for example, >60°, or the 90th and 99th percentiles of the exposure distribution, which may be used as alternative exposure measures depending on research goals. In general, the choice of exposure measures should be related to the expected pathogenetic mechanisms.40
In further studies of exposure–response relationships, the predicted measured job exposures may be used for all 172 job groups in The Shoulder JEM, or the predicted measured job exposures may be replaced by measured job exposures when available (36 job groups). The relatively wide limits of agreement between the predicted and the measured job exposures could be an argument for using the measured job exposures when available. Another argument would be that regression calibration does not allow the ranking of the expert-rated job exposures to be overruled by a different ranking according to the measured job exposures (the position of the expert-rated job exposures on the X-axis in figure 2 is fixed). Considering the option of using available measured job exposures rather than predicted measured job exposures, we planned the measurement programme so that it included frequent job groups for men and women, and gave priority to job groups that were highly exposed. In this way, the measured job exposures would weigh relatively heavily in exposure–response analyses, when compared to the predicted measured job exposures for job groups without measurements. On the other hand, the experts may have provided exposure estimates that were more representative of the whole job group than the occupational title that was selected for the measurements; this could be an argument for using the predicted measured job exposures even for job groups where measurements were obtained. We are currently comparing exposure–response relationships based on predicted measured job exposures for all job groups with corresponding relationships based on predicted measured job exposures and measured job exposures when available.
The Danish labour market is, to a large extent, sex-segregated, so that men and women work in different jobs, which limits the potential exposure misclassification due to the fact that the expert-rated job exposures did not include sex-specific estimates. We did not find systematic differences between the sex-specific measured job exposures, and the experts did not systematically overestimate or underestimate the exposures for either men or women. This indicates that the expert-rated job exposures were equally valid for men and women. However, when we compared the sex-specific measured job exposures for the 10 job groups where technical measurements were performed for men and women, significant differences were found for four job groups. This may be an argument for using the sex-specific measured job exposures when available.
With time, we hope to extend The Shoulder JEM by measured exposures for more job groups. This is likely to reduce the CI for the intercept and slope of the regression lines, but we do not expect that the rank correlations, the equations for predicting the measured job exposures, the explained variances, nor the Bland-Altman results will be altered to any large extent. The main advantage of including more measured job exposures will probably be that they can replace the predicted measured job exposures, thereby increasing the accuracy and precision of the exposure estimates, and correcting the ranking of job groups. This will provide more correct exposure–response relationships.
Although the updated Shoulder JEM is based on Danish and Swedish information, we think that it has a potential for use in other countries with a similar labour market, maybe with some modifications. The calibration method that we applied may be useful to convert other JEMs to measurement scales.
In conclusion, we converted our expert-based Shoulder JEM to measurement scales for upper arm elevation and repetitive shoulder movements. The updated Shoulder JEM can be used to present exposure–response relationships on measurement scales.
Acknowledgments
The authors thank Jens Peder Lind Haahr, Department of Occupational Medicine, Regional Hospital West Jutland—University Research Clinic, and Jane Frølund Thomsen, Department of Occupational and Environmental Medicine, Bispebjerg Hospital, University Hospital of Copenhagen, who provided expert ratings for the JEM. They also thank Klaus Dahlerup Djernes for assisting in the collection and Lothy Granqvist for assisting in the analyses of the technical exposure measurements.
References
Footnotes
Contributors AD, G-ÅH, PF, JHA and SWS conceived and designed the study. AD and TH-H headed the collection of technical exposure measurements in Western and Eastern Denmark, respectively. AD performed the statistical analyses in collaboration with G-ÅH and PF. AD, SWS, G-ÅH and JHA contributed to interpreting the findings. AD drafted the manuscript in collaboration with SWS and PF. G-ÅH, JHA, and THH contributed to revising the manuscript critically. The final version was approved by all authors, who stand by the integrity of the entire work.
Funding This study was supported by the Danish Working Environment Research Fund (grant no. 32-2009-03), The Danish Graduate School Network in Public Health Science (GRASPH) (grant no. 07-07-2009), and The Danish Rheumatism Association (grant no. A1024).
Competing interests None declared.
Patient consent Obtained.
Ethics approval The study was approved by the Danish Data Protection Agency and accepted by the Regional Committee on Biomedical Research Ethics for the Capital Region of Denmark. According to the Regional Committee on Biomedical Research Ethics for Central Denmark Region, the project did not require their approval (request no. 130/2009).
Provenance and peer review Not commissioned; externally peer reviewed.
Data sharing statement No additional data are not available.