Article Text

Abstract
Epidemiological studies on exposure to pesticides and risk of prostate cancer (PC) provide inconsistent results. We aimed to explore various potential sources of heterogeneity not previously assessed and to derive updated risk estimates from homogenous studies. We searched PubMed, Web of Science and Scopus databases for case–control and cohort studies published from 1985 to April 2014. We assessed the quality of the articles using the Newcastle-Ottawa Scale. Pooled estimates were calculated using random-effects models. Heterogeneity was explored using subset analyses and metaregression. Fifty-two studies were included in the review and 25 in the meta-analysis. No association was found between low exposure to pesticides and PC, but association was significant for high exposure, pooled OR 1.33 (1.02 to 1.63), I2=44.8%, p=0.024. Heterogeneity was explained by a number of variables including method used to assess exposure. Pooled OR was weak and non-significant for studies measuring serum pesticide level, 1.12 (0.74 to 1.50), I2=0.00%, p=0.966. For studies applying self-reporting of exposure, pooled estimate was 1.34 (0.91 to 1.77), I2=0.00%, p=0.493, while a high significant association was detected for grouped exposure assessment, 2.24 (1.36 to 3.11), I2=0.00%, p=0.955. In spite of a weak significant association detected when pooling ORs for high occupational exposure to pesticides, the magnitude of the association was related to the method of exposure assessment used by the original studies. A family history–pesticide exposure interaction was also observed for a number of pesticides.
- Public health
- Prostate Cancer
- Meta-analysis
Statistics from Altmetric.com
What this paper adds
Epidemiological studies examining the association between pesticide exposure and prostate cancer (PC) are heterogeneous, and provide inconsistent results.
Positive findings were mostly confined to occupational exposure to specific groups of pesticides or particular groups of those exposed.
A consistent finding of studies belonging to the Agricultural Health Study (AHS) was an increased PC risk among the highly exposed categories of pesticide applicators who have a positive family history of PC. Nevertheless, many epidemiological studies did not adjust for this important confounder.
The pooled OR for PC with low exposure to pesticides was 1.02, 95% CI (0.88 to 1.17). For high exposure, it was 1.33 (1.02 to 1.63), but heterogeneity was detected (I2=44.8%, p=0.024).
The impact of the methodology applied for assessment of exposure on the pooled OR was evident. Pooled OR of PC when measuring serum pesticide level was 1.12 (0.74 to 1.50), whereas a high significant association was obtained for high occupational exposure to pesticides for studies applying grouped assignment of exposure, 2.24 (1.36 to 3.11).
Introduction
Prostate cancer (PC) is the second most commonly diagnosed cancer and the sixth cause of cancer mortality among men worldwide.1 ,2 Advancing age, family history and ethnicity are the only established risk factors.3 In recent years, evidence has also accumulated regarding the potential role of many environmental and occupational exposures.4 ,5 In spite of that, there is no consensus among published results.
The role of hormones, including androgens and oestrogens, on PC development has long been studied.6–8 This has suggested the possible association between exposure to endocrine disrupting chemicals, which include many types of pesticides, and PC.9–11 In vitro, animal, toxicological and genotoxicity studies produced a basis of biological plausibility and supported an association between several pesticides and PC.12 ,13
However, results obtained from epidemiological studies are controversial. This might be attributed to the complicated nature of the association that led to differences in the approaches of the studies as regards (1) studied pesticides, which encompass diverse groups that might be handled generally or individually;14 ,15 (2) exposure assessment and quantification, a main challenge for epidemiological studies;16–18 (3) design of the study, especially sample selection; (4) adjusting for confounders that are dealt with differently due to the unclear aetiology of PC and (5) studied populations that include occupational as well as environmental exposures. Accordingly, this variability is expected to affect the quality of the studies and may influence the results obtained.
A number of reviews and meta-analyses have been previously published,19–24 most of which examined the association between farming and PC without assessing pesticide exposure.19–22 The pooled estimates provided by previous meta-analyses showed a weak yet significant association, ranging from 1.08 (1.06 to 1.11) to 1.24 (1.06 to 1.45).19 ,24 However, some authors noted that the lack of specific data on pesticide exposure limited the results.20 ,23 ,24 Heterogeneity between studies has been explained by study design, geographical location and control population.20–24 However, many aspects of variability between studies, such as exposure assessment methodologies, quality of the studies, adjustment for potential confounders, diverse types of pesticide as well as the distinct degrees of exposures, have not yet been considered.
Our main objective was to conduct a systematic review to assess the potential association between different degrees of exposure to pesticides and risk of PC. We aim to update previous meta-analyses by including data from recent studies and to explore several sources of heterogeneity that have not yet been analysed.
Methodology
Design and eligibility criteria
We conducted a systematic review and meta-analysis of epidemiological data on the association between pesticide exposure and PC. The predefined inclusion criteria were: (1) original studies; (2) case–control or cohort studies; (3) studies containing information about association measures—ORs, relative risks (RRs)—and their CI relating pesticide exposure and PC or providing sufficient data from which they could be calculated; and (5) studies written in English, French or Spanish. We searched for articles published from 1985 to April 2014.
Exclusion criteria were: (1) in vitro experimental studies; (2) studies based solely on mortality rates; (3) studies addressing pesticide manufacturing workers (given the particular nature of exposure in production plants); and (4) reviews, previous meta-analyses, editorials or letters. In case of articles in which participants were included in a later published article, we chose the most recent one.
Search strategy and selection of articles
First, we searched PubMed (US National Library of Medicine, Bethesda, Maryland, USA), Web of Science (Thomson Reuters) and Scopus (Elsevier) databases. We used different combinations of the following medical subject heading terms and keywords: “pesticide exposure”, “pesticides”, “agricultural exposure”, “pesticides application”, “pesticide applicators”, “farmers”, “farm workers”, “farming”, “agricultural workers”, “prostate cancer”, “prostatic carcinoma”, “prostatic neoplasm”, “incidence”, “case-control studies”, “cohort studies”, “occupational cancer”, “exposure assessment”, “risk factors”. The second stage was hand searching the references of the included articles. Finally, we contacted authors for unpublished data, but were only provided with online links related to the Agricultural Health Study (AHS). Titles and abstracts of the identified articles were reviewed independently by two investigators (A-ML-M and TOG). Those not considered relevant for further checking of the full-text article were excluded and the reasons for exclusion were listed. Relevant articles were read and analysed independently by two researchers. A standardised procedure was followed for extracting and tabulating relevant data as follows.
Data extraction and quality assessment
Data collected for each study included: (1) country of study; (2) design (case–control or cohort study); (3) study population; (4) sample size; (5) participant selection; (6) period of recruitment of cases and controls, recruitment and follow-up periods of cohort studies; (7) type of pesticides; for studies that reported a large number of studied pesticides, we utilised estimates reported for organochlorine (OC) pesticides; (8) method applied for exposure assessment; (9) magnitude of the association: OR/RR estimators and 95% CI by exposure level. Where both crude and adjusted ORs were presented, we used the latter; and (10) confounding factors that were adjusted for in each study. Lastly, all the information obtained initially by the two researchers was compared and disagreements were resolved by two senior epidemiologists (AB-C and JJJ-M). This procedure lasted from March 2013 to April 2014.
To systematically assess the quality of the included articles, we applied the Newcastle-Ottawa Scale (NOS) proposed by Wells et al.25 The NOS contains eight items that are given star points if fulfilled, with an overall minimum score of 1 and a maximum of 9 stars that cover three main quality dimensions: (1) selection of the study population; (2) comparability among the groups; and (3) outcome or exposure measures for cohort and case–control studies, respectively. We utilised the overall scores given for the included studies to categorise them into high (8–9 stars), medium (6–7 stars) and low quality (≤5 stars). We also categorised studies according to exposure assessment quality into high (3 stars), medium (2 stars) and low quality (1 star).
Data synthesis and analysis
We pooled PC risk estimates presented for ever versus never exposed to pesticides, then for low exposed categories versus non-exposed and lastly for the highest exposed groups. Thus, we avoided mixing of estimates calculated for different levels of exposure. Heterogeneity was assessed by Cochran Q test. I2 was estimated and heterogeneity was considered as low for values between 25% and 50%, moderate for 50–75% and high for >75%.26
We explored heterogeneity by stratifying studies based on several potential variables that we assume might have produced the detected heterogeneity (subset analyses). These a priori defined variables included overall quality of the studies according to NOS, quality of exposure assessment, methods applied for quantification of exposure, adjusting for family history of PC, pesticide category, exposed population, type of control population for case–control studies, year of publication and geographical location. All subset analyses were performed taking into account study design, owing to the expected differences between case–control and cohort studies. We also conducted a metaregression analysis to explore the importance of these variables on the OR estimates.
Owing to the observed heterogeneity, a random-effects model was applied.27 All statistical analyses were performed using Stata V.12 statistical software (Stata Corp, College Station, Texas, USA).
Sensitivity analysis
To examine the disproportionate influence that a specific study may impose on the combined summary statistics, we recalculated pooled estimates after deleting one study, in a sequential manner. We have also applied this in the subset analysis to examine the robustness of our results.
Publication bias
We applied a contour-enhanced funnel plot technique, in which the natural logarithm of the estimator of OR was plotted against the inverse of the SE (estimate's precision).28 The SE of the log of the estimate was utilised. We also tested funnel plot asymmetry by applying a linear regression model proposed by Egger,29 to confirm if there is a small study effect.
Results
Selection of primary studies
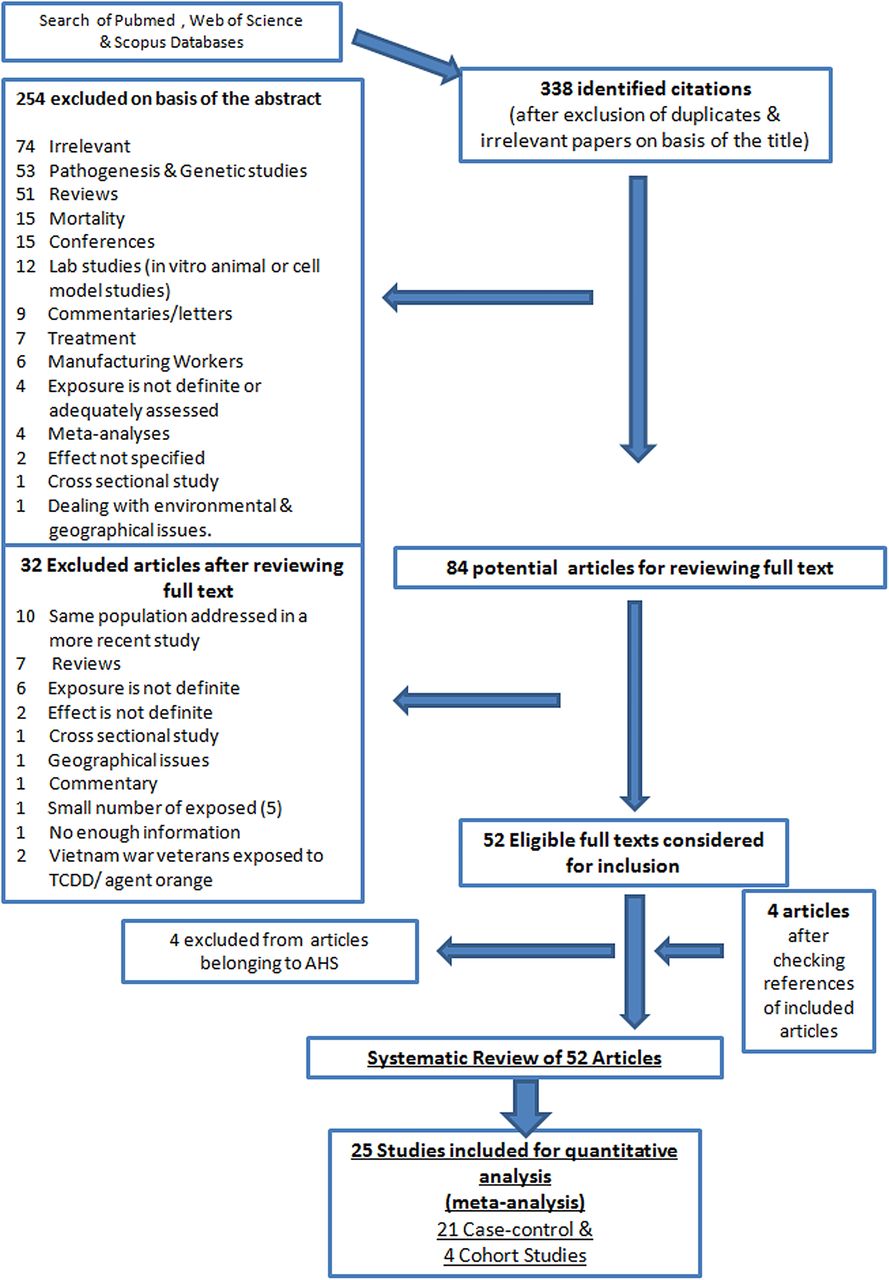
As seen in figure 1 (flow chart summarising the selection process of the articles), our search strategy yielded 338 articles after omitting duplicates and irrelevant articles. 254 were ineligible after reviewing the abstracts for not complying with our inclusion criteria. After reviewing the full text of the 84 potentially eligible articles, 32 were excluded for various reasons, as presented in the flow chart. Thirty-two articles belonged to the same cohort, the AHS, but four were excluded for not providing estimates for the association under question. Hand searching of the references of the included articles resulted in four more articles that fit our inclusion criteria. Finally, we systematically reviewed 52 articles while 25 articles were included in our meta-analysis (covering 21 case–control and 4 cohort studies), as only the most recent articles belonging to the AHS were included in the meta-analysis.

Flow chart for the selection process of the included articles (AHS, Agricultural Health Study).
Study characteristics
Online supplementary tables S1 and S2 display characteristics of the case–control30–50 and cohort studies51–54 that were included in the meta-analysis. Online supplementary table S3 displays articles belonging to the AHS that constituted part of the systematic review.55–81 For simplicity, we will comment in the following section on the 28 articles derived from the AHS simultaneously, due to their sharing common characteristics, followed by the other included studies.
The AHS is a large prospective cohort study that started in 1993 and included about 55 000 pesticide applicators in North Carolina. Data were collected by a self-administered questionnaire that sought information on the use of a large number of pesticides, personal protective equipment used, pesticide application methods, a history of PC in first-degree relatives, non-farm occupational exposures and other data.55 A cumulative exposure intensity score was utilised by most of the articles of the AHS (n=21).82 According to NOS, the observed quality of AHS articles was high, as regards selection of cohort members, detailed assessment of exposure, long follow-up period and adjustment for many potential confounders. Strengths of articles derived from this study also included the large size of the group of exposed individuals, prospective nature, and assessing different and specific pesticides.
For the cohort and case–control studies (other than AHS), the general characteristics could be summarised as follows:
Publication dates: More than half of the retrieved studies were published in recent years (2005–2013) while the oldest article included dates back to 1993.30
Location: Half of the studies were conducted in the USA or Canada (n=12), nine were carried out in Europe, while the remaining three studies were carried out in Australia, Japan and Malaysia.
Sample size: For the cohort studies, sample size ranged from 2449 to 33 658 individuals.51 ,53 For case–control studies, the number of PC cases ranged from 49 to 138644 ,39 and controls from 20 to 3999.40 ,50
Methodology applied for assessment of pesticide exposure: Five studies (21%) applied biological monitoring of studied pesticides37 ,40 ,46–48 while 6 (25%) relied only on self-reporting of pesticide exposure through questionnaires,31 ,33–35 ,42 ,45 2 studies utilised mainly job exposure matrices43 ,50 while 4 (15%) depended on expert assessment of exposure.32 ,39 ,41 ,44 For the remaining 7 studies (27%), assignment of exposure was less individualised as they depended mainly on similarities between groups of farmers, pesticide applicators or general population as regards types, dates, patterns or locations of crops grown, or similarities in workplace conditions (from employment records) for assigning of probability and/or levels of pesticide exposure.30 ,36 ,38 ,49 ,51–53
Studied pesticides: 14 studies assessed exposure to any pesticide,30–35 ,39 ,42–45 ,51–53 nine examined several pesticides,36–38 ,40 ,41,46 ,48–50 while one study addressed chlordecone.47
Quality assessment of studies
Online supplementary table S4 displays the scores given for each study according to NOS. For case–control studies, potential sources of selection bias were observed. For example, a general healthy population constituted the controls for only half of the studies. The other half used hospital controls diagnosed with other cancer types30 ,38 ,44 ,50 or benign prostatic hyperplasia (BPH), or other urological symptoms.31 ,40 ,46 One study used two distinct groups of controls, population and cancer controls.32 In another study, two hospital controls were selected for each case, one with BPH and the other treated for a non-urological condition.33
On the other hand, 67% of case–control studies (n=14) suffered from potential sources of information bias mainly arising from lack of efficient assessment of exposure. Regarding comparability between cases and controls, age was adjusted for in all studies. However, only 5 studies (24%) adjusted for family history of PC.38–40 ,43 ,47 We also observed that PSA screening rate differences were not commented on except in three studies.42 ,43 ,47
Methodological deficiencies were also observed among the included cohort studies (other than AHS). Potential sources of selection bias included comparing the observed incidence of PC among the exposed cohort to that expected in the general population, which might introduce bias due to the healthy worker effect. Also, ascertainment of exposure was not from a secure record,51 or was relatively crude and based solely on licensure year.53 Outcome assessment was not adequate in the three studies.51–53 Regarding comparability between exposed and unexposed, there was no adjustment, even for age, in two studies.51 ,52
Summary of results reported by articles of the AHS
There was an excess risk of PC among pesticide applicators of the AHS, compared with the general population, in spite of the low incidence of all cancers combined. However, standardised incidence ratio (SIR) obtained was only modestly elevated; 1.14, 95% CI 1.05 to 1.24.55 Seven years later, similar results were updated (SIR=1.19, 95% CI 1.14 to 1.25).80 Nevertheless, some authors also calculated relative SIR, which puts into account the low incidence of all cancers combined among the pesticide applicators, and higher values were reported (1.66, 95% CI 1.57 to 1.77).
On the other hand, no clear association could be detected when studying exposure to a large number of specific pesticides. In 20 (71.4%) AHS articles, the authors did not find an increased PC risk for exposure to all of the following pesticides: alachlor, atrazine, glyphosate, diazinon, pendimethalin, cyanazine, phorate, metolachlor, dicamba, malathion, carbaryl, OCs, captan, trifluralin, chlorothalonil, thiocarbamate herbicide (EPTC), metribuzin, imazethapyr and metolachlor.56–62 ,64–75 ,77
A significant association was found for only very limited types of pesticides, as in case of butylate, RR for the highest exposed categories compared with non-exposed 2.09 (1.27 to 3.44). A suggestive association was reported for terbufos, RR for tertiles 2 and 3 were 1.28 (1.06 to 1.55) and 1.21 (0.99 to 1.47), respectively.76 ,78 For the most recent study belonging to the AHS, which examined the association between lifetime cumulative exposure to 48 different pesticides and risk of PC,54 a positive association was found for the highest quartile of exposure to only three organophosphates (fonofos, malathion and terbufos) and the OC aldrin.
As seen in table 1, a consistent finding of the AHS is an observed significant association between exposure to certain pesticides and PC among those with a positive family history. A family history–pesticide exposure interaction was reported for several specific pesticides.54 ,55 ,63 ,79
RR, interaction ORs and 95% CI for PC associated with different levels of pesticide exposure among pesticide applicators with a positive family history of PC
Summary of results reported by studies other than the AHS
The findings of the 21 included case–control studies were inconsistent but could be summarised as follows. No association could be detected in five studies,32 ,33 ,41 ,46 ,48 four of which applied accurate methodologies, with low potential selection and information bias. Two of these studies depended on expert assessment of exposure based on detailed information of every job held by each participant through combining information from participant questioning and workplace measurement data,32 ,41 while two applied measuring serum level of the studied pesticides.46 ,48 Furthermore, a negative association was found in a large population-based case-referent study that examined PC risk for a large number of job exposures utilising expert assessment of exposure.39 An insignificant association was reported by three case–control studies.30 ,31 ,40
On the other hand, 12 studies (57%) reported significant associations.34–38 ,42–45 ,47 ,49 ,50 However, the association was confined to specific conditions in the majority of studies. For example, an increased PC risk was observed only among farmers employed for short durations34 and among those who farmed for less than 5 years.42 Also, an association was found among Hispanics36 ,43 and among Caucasian farmers, but not for African-Americans,42 which might conflict with the fact that the highest incidences of PC are observed among African-American peoples.1 An association was also found among farmers with high pesticide exposure, though types of pesticides were not systemically assessed and the study was limited by the small number of cases (49 farmers).44
Furthermore, cases were more likely to be found exposed to pesticides when the authors depended only on self-report of ever been exposed,45 or more frequently exposed (defined as once a week or more for ≥6 months) during leisure activities,35 which could be considered as less accurate methodologies.
The association was more evident for certain pesticides; particularly OCs. Examples of this were the association found in cases of exposure to chlordecone,47 dichlorodiphenyltrichloroethane and dicofol,38 ,50 or long-term exposure to specific OC pesticides such as lindane and heptachlor,36 ,37or environmental exposure to OCs in general.49 These results are consistent with a very recent study that found a high and significant association between the highest quartile of serum DDE and PC.83
Regarding the included cohort studies, other than the AHS, results were as follows: there was no increased incidence of PC among pesticide applicators in Iceland compared with the general population, contrary to the increased risk of other cancer types among the studied population.51 Also, an association was only confined to being licensed for agricultural pesticide applicators between 1965 and 1976.52 On the other hand, a significant elevated risk of PC was detected among pesticide applicators in Florida compared with the general population, although exposure measures were solely based on information on pesticide application licensure year and duration of exposure.53
Quantitative analyses
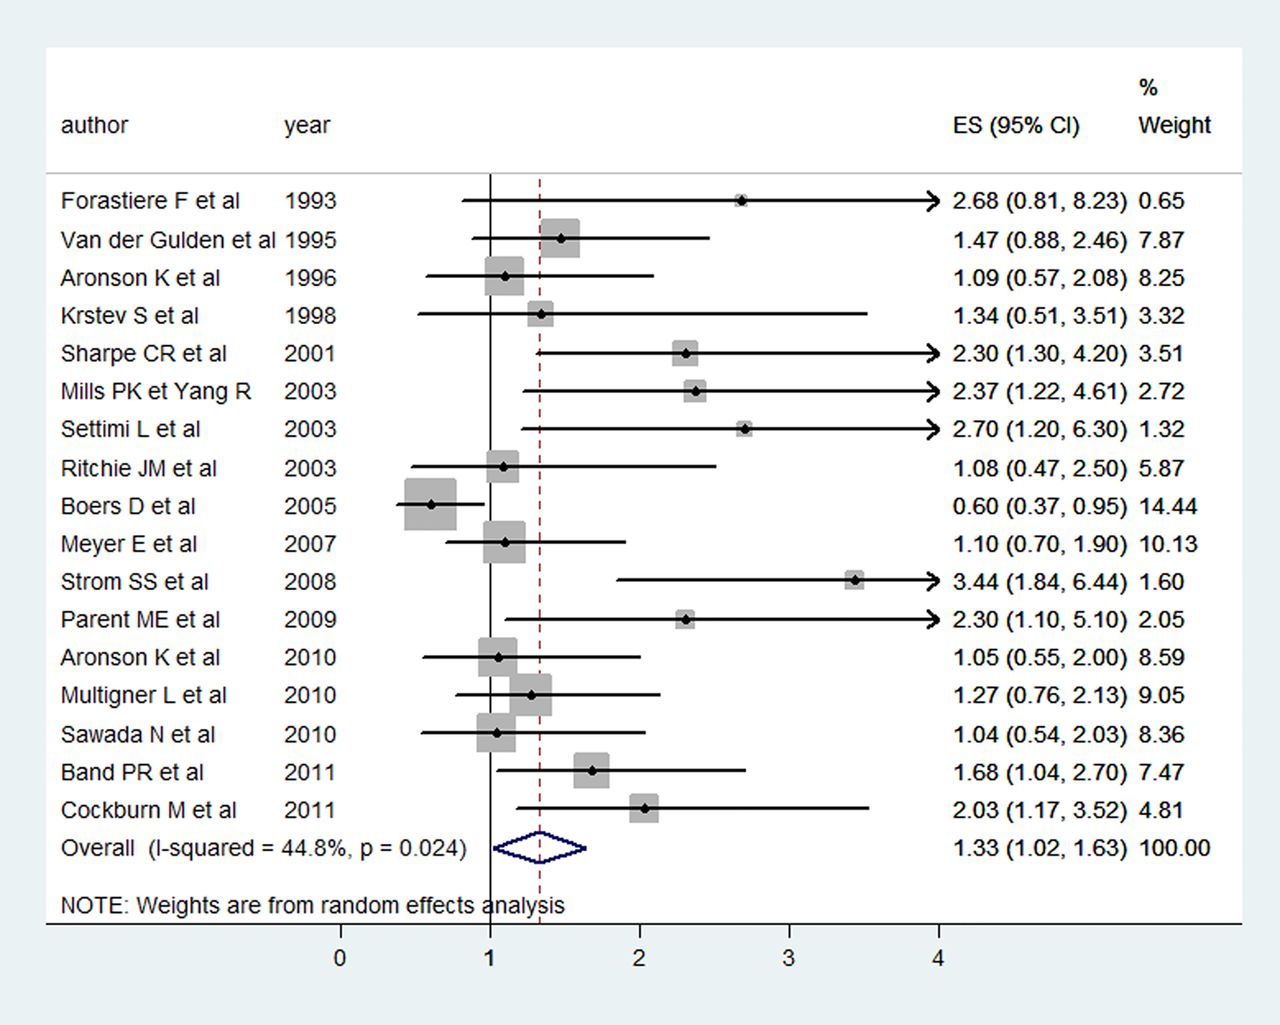
Pooled OR for the lowest exposed groups versus the non-exposed groups for the case–control studies was 1.02, 95% CI 0.88 to 1.17 (I2=0.00%, p=0.622; see online supplementary figure F1). However, as displayed in figure 2, pooled OR for the highest exposed categories was 1.33, 95% CI 1.02 to 1.63, but heterogeneity was greater than that expected by chance (I2=44.8%, p=0.024). (NB: Only one cohort study provided RR for high pesticide exposure.)

Forest Plot displaying random-effects meta-analysis of the association between high exposure to pesticides and PC risk (case–control studies). ES, effect size; PC, prostate cancer.
On the other hand, pooled OR for ever versus never been exposed to pesticides obtained from the random-effects model of case–control studies was 1.27, 95% CI 0.92 to 1.63 (I2=54.3%, p=0.016). For the cohort studies, high degree of heterogeneity was observed: 1.27, 95% CI 0.65 to 1.89 (I2=95.9%, p=0.000).
Exploring heterogeneity
As displayed in table 2, homogeneity was revealed for the highest exposed categories when stratifying case–control studies by a number of variables. For example, pooled OR of the five studies37 ,39 ,46–48 that applied more precise exposure assessment (scoring 3 stars, NOS) showed no association contrary to the high and significant pooled estimate for the four studies30 ,35 ,44 ,49 that assessed exposure to pesticides less precisely (1star, NOS). However, we noted that four out of the five studies in the first group did not report specific occupation, as these ORs are for the highest serum level of pesticides detected in the general population. On the other hand, farmers were the exposed population in three out of the four studies in the second group.
Pooled estimates, 95% CI, and I2 and p values for homogeneity between case–control studies presenting PC risk estimates for high exposure to pesticides by various grouping of studies (subset analyses)
Consistent results were obtained from the metaregression analysis, as quality of exposure assessment and adjusting for family history were significant factors (p=0.003 and p=0.041, respectively), with these two variables explaining most between-study variability (adjusted R2=58%).
Table 2 displays more results of substratifying case–control studies by several variables of interest. Online supplementary figure F2 displays forest plot for stratifying case–control studies by the exposure assessment methodologies.
Sensitivity analysis
Results of sensitivity analyses are displayed in table 3. Homogeneity was observed after deleting studies reporting extreme ORs, but with no change in the pooled estimate, which might strengthen the results. Worth mentioning is the high significant association when pooling estimates of high exposure among those with a positive family history of PC as well as for developing aggressive forms of PC.
Pooled estimates, 95% CI, and I2 and p values for homogeneity between studies: sensitivity analysis
Since we previously conducted subset analysis without including cohort studies, we re-evaluated the results after including the cohort study that provided RR for high pesticide exposure,54 but results did not change.
We also observed that homogeneity for ever/never exposed to pesticides was revealed when eliminating one study from case–control studies. However, the high degree of heterogeneity observed between the cohort studies could not be resolved.
Detection of publication bias
Online supplementary figures F3 and F4 display contour-enhanced funnel plots with corresponding random-effects pooled estimates across studies for low and high pesticide exposure, respectively. There was no visual evidence of asymmetry when pooling estimates for low exposure to pesticides (Egger's test: bias coefficient=0.572, SE=0.593, p=0.348). However, asymmetry could be observed for high pesticide exposure (Egger's test: bias coefficient=1.547, SE=0.808, p=0.072).
Discussion
Summary of main findings
We obtained findings that might indicate an impact of the quality of the articles on the pooled estimates. We observed that the magnitude of the association between high pesticide exposure and PC was related to the methodology adopted by the included studies for assessing pesticide exposure. A stronger association was detected when less accurate methodologies for exposure assessment were applied. We consider that applying an aggregate measure of exposure assignment imposes uniform exposure of individuals within a group, implying also fixed exposure over time. This simplifying assumption may mask expected individual variation and introduce more sources of bias than when applying individualised exposure assessment.84 On the other hand, studies measuring serum level of the studied pesticide may provide a potentially optimal index of exposure that reflects the internal dose of pesticides and offer the advantage of integrating aggregate pesticide intake across multiple exposure routes.85 Nevertheless, its reflecting cumulative exposure is a matter of the studied pesticide, and its feasibility and cost restrict its use in large epidemiological studies.16
In spite of the fact that exposure misclassifications are almost inevitable in occupational epidemiology studies, direction of this effect has not been rigorously assessed.86 Our results suggest that less accuracy of pesticide exposure assessment exaggerated the magnitude of the association with PC. The magnitude of the association for the ever versus never exposed, which was almost equal to that retrieved for the highest exposed, might be explained from the same perspective. We observed that collapsing exposure scales into only two categories, as well as other sources of bias such as non-adjustment of important confounders (family history), and selection bias(using patients with cancer as controls), have biased the results away from the null.87 ,88
Importance of adjustment for potential confounders, especially family history of PC
In spite of the documented increased risk of PC among those with a positive family history,89 ,90 very few studies adjusted for this important confounder. We obtained a high and significant pooled OR from pooling the results of three studies43 ,47 ,54 that estimated PC risk among the highest pesticide exposed groups that have a positive family history. An important genetic component contributing to PC risk associated with exposure to specific pesticides has been suggested in many recent studies, which may point to gene-environment interaction.91 ,92
Owing to the importance of adjustment for confounders, we have chosen to use the adjusted rather than the non-adjusted ORs. However, in spite of our attempts to examine the impact of adjustments on the pooled estimates, we could not obtain relevant results due to the obvious discrepancy in the numbers of studies adjusting for different types of variables.
Farmers as an exposed group of special interest
A positive significant association was detected in case of pooling results reported by studies conducted specifically on farm working populations, which is consistent with a number of previous studies and meta-analyses.19 ,20 ,93–96 Many explanations were proposed, including exposure of farmers to a wide range of chemicals that might be carcinogenic, not only pesticides.19 Others postulated that farmers may be particularly at risk, as they are subject to higher-than-average levels of exposure to pesticides over long periods.97 However, the increased incidence of PC among farmers is contradictory to the findings that they have a much lower incidence of many other types of cancer compared with the general population, which calls for future research.98
Interpretation of the results should be in context with the expected sources of bias. Although PSA screening has been widely used in recent years, which resulted in an increased incidence of PC, its use has been uneven across countries and social classes. Access to health services in rural areas may be less among farmers than in the general population.54 ,99 ,100 This fact might bias the results towards the null, as it has rarely been taken into account in the available epidemiological studies. On the other hand, inaccurate quantification for exposure and considering all farm jobs as pesticide-exposed may also bias the results.101 In our meta-analysis, the impact of the methodology applied for exposure assessment to pesticides was evident when we stratified studies addressing farmers.
Publication bias
There are diverse potential sources of bias and available tests that detect specific sources are limited. However, the asymmetry observed in the funnel plot representing estimates for high exposure to pesticides and not for low exposure might indicate publication bias, where authors tend to publish positive results. Also, the role of data irregularities cannot be ruled out, especially the fact that there was heterogeneity when pooling estimates of high exposure to pesticides.102 Our results have explained, to an extent, several sources of these heterogeneities.
Comparison to previous meta-analyses
Results obtained from pooling estimates for high exposure to pesticides are to a high degree in concordance with previous meta-analyses, which also presented a weak yet significant positive association.23 ,24 However, given the heterogeneity detected between studies, considering results obtained from further stratifications would be more accurate than relying on the overall pooled estimate.103
Keller-Burne et al21 examined the association between farming and PC, based on articles published from 1988 to 1994. The pooled estimate provided for 13 retrospective studies was 1.29 (1.10 to 1.51). Although there was no assessment of exposure to pesticides, the authors proposed hormonally active agricultural chemicals to be responsible for the obtained association.21 One year later, Acquavella et al20 reported similar results and explained heterogeneity by design and geographical location of the studies. Van Maele-Fabry et al included studies published up to 2001. The pooled estimates were 1.13 (1.04 to 1.22) and 1.24 (1.06 to 1.45) for two consecutive meta-analyses.23 ,24 Our finding higher pooled estimates for the USA and Canada than for European countries is consistent with the results noted by previous meta-analyses.20 ,23 ,24 Also, the higher pooled ORs we noted for case–control studies where controls were patients with cancer is in concordance with previous findings.23 ,24
All these previous meta-analyses did not assess the quality of the included articles. Worth mentioning is a meta-analysis on occupational parental exposure and childhood leukaemia, where the authors reported a stronger association for studies with higher exposure measurement scores. However, we attribute this to the different pathophysiological mechanisms underlying the development of PC and childhood leukaemia.104
Strengths of our meta-analysis
We have put much energy on making use of specific estimates provided in the included articles according to degrees of exposure. Thus, we combined data in a precise manner and obtained pooled estimates for three specific categories of exposure, which was not the case for the previous meta-analyses.
We also included recent studies than previous meta-analyses and explored sources of heterogeneity not previously tackled. We also exclusively assessed studies providing estimates for pesticide exposure, to avoid the inadequacy of exposure information that was highlighted by previous meta-analyses as a limitation for drawing firm conclusions.19 ,20 ,24
In spite of broadening our inclusion criteria, we chose not to include studies depending merely on mortality rates as we consider them to be a poor indicator of PC risk, given the usual chronic nature of PC as well as its high survival rate.105 Thus, our relying on incidence rates may have served our aetiological hypothesis more.
Limitations
Although we have tried to manage the data as accurately as possible, there might still be some sort of non-differential misclassification. We utilised risk estimates presented for quartile 4, tertile 3 and the higher exposed (in studies presenting low and higher exposed categories), and those with the longest duration of exposure, to present the highest exposed groups. However, this grouping was inevitable, as stratifying into more narrow categories led to the production of uninformative strata.
For studies that reported a number of studied pesticides, we utilised estimates for OC pesticides. This was the only way to avoid losing data that we especially chose not to be hindered by different methodologies adopted by studies, but to assess their impact on obtained results. OC pesticides were thought to be the best option as they were the common group of pesticides pesticide assessed by the included studies, and because their endocrine disruptor and carcinogenic potential were studied, which was also in favour of our choice.
Conclusions
This systematic review summarises the currently available epidemiological evidence on the association between pesticide exposure and PC. We observed that positive findings were mostly confined to farmers exposed to high levels of specific groups of pesticides. An increased PC risk is also obvious for high occupational exposure to pesticides among individuals with a positive family history. Nevertheless, an impact of the exposure assessment methodologies on the pooled results was also observed.
There are still gaps in the available research, which make the association unclear. Future research should put more effort into: (1) validating quantification methods applied for assessment of occupational exposure to specific pesticide categories to detect the magnitude of association with PC more precisely; (2) conducting more studies, especially in the developing world where pesticides that have been banned in the USA and Europe are still in use; (3) the design of new studies, where it would be necessary to take into account well-known sources of biases such as differences in PSA testing rates, selection of population controls and confounding factors such as family history of PC, which should be adjusted for more rigorously. Owing to the high incidence of latent PC, more research on aggressive forms of PC may better contribute to targeted prevention strategies in occupational settings.
Acknowledgments
This paper is part of the PhD work of A-ML-M. It presents independent research commissioned by the European Union and reflects the view only of the author. The commission cannot be held responsible for any use that may be made of the information contained therein.
References
Supplementary materials
Supplementary Data
This web only file has been produced by the BMJ Publishing Group from an electronic file supplied by the author(s) and has not been edited for content.
- Data supplement 1 - Online figures
- Data supplement 2 - Online tables
Footnotes
Contributors A-ML-M conducted the searches, reviewed the papers, interpreted the analysis and contributed to the writing of the manuscript. AB-C contributed to the design of the study, reviewing of the papers, interpretation of the analysis and writing of the manuscript. TOG contributed to the searching and reviewing of the papers. RO-R contributed to the writing of the manuscript. MD-R contributed to the interpretation of the analysis and the writing of the manuscript. JJJ-M designed the search strategy, contributed to the reviewing of the papers, interpretation of the analysis and the writing of the manuscript.
Funding This project has been funded with support of the European Commission (Erasmus Mundus scholarship).
Competing interests None declared.
Provenance and peer review Not commissioned; externally peer reviewed.