Article Text

Abstract
Objectives To construct a cohort-specific job-exposure matrix (JEM) using surrogate metrics of exposure for a cancer study on career firefighters from the Chicago, Philadelphia and San Francisco Fire Departments.
Methods Departmental work history records, along with data on historical annual fire-runs and hours, were collected from 1950 to 2009 and coded into separate databases. These data were used to create a JEM based on standardised job titles and fire apparatus assignments using several surrogate exposure metrics to estimate firefighters’ exposure to the combustion byproducts of fire. The metrics included duration of exposure (cumulative time with a standardised exposed job title and assignment), fire-runs (cumulative events of potential fire exposure) and time at fire (cumulative hours of potential fire exposure).
Results The JEM consisted of 2298 unique job titles alongside 16 174 fire apparatus assignments from the three departments, which were collapsed into 15 standardised job titles and 15 standardised job assignments. Correlations were found between fire-runs and time at fires (Pearson coefficient=0.92), duration of exposure and time at fires (Pearson coefficient=0.85), and duration of exposure and fire-runs (Pearson coefficient=0.82). Total misclassification rates were found to be between 16–30% when using duration of employment as an exposure surrogate, which has been traditionally used in most epidemiological studies, compared with using the duration of exposure surrogate metric.
Conclusions The constructed JEM successfully differentiated firefighters based on gradient levels of potential exposure to the combustion byproducts of fire using multiple surrogate exposure metrics.
- Firefighters
- Job-Exposure Matrix
- Dose-Response
Statistics from Altmetric.com
What this paper adds
A fundamental problem in epidemiological studies of cancer among firefighters is the presumed exposure based on duration of employment. Relying solely on this metric has been shown to cause exposure misclassification.
The study describes the creation and analysis of a job-exposure matrix to address these recognised limitations by using several surrogate measures of exposure to develop an exposure–response relationship for an analysis of career firefighters.
We found that misclassification can occur in up to 30% of a study population when using duration of employment as a surrogate for exposure compared with other metrics. These findings indicate that future studies on firefighters should at least use other surrogate metrics of exposure beyond simply using duration of employment.
Introduction
There has been an increasing amount of epidemiological evidence linking occupational exposures from firefighting to various forms of cancer including cancers of the brain, digestive tract, genitourinary tract, lymphohaematopoietic and respiratory systems.1–13 Currently, the International Agency for Research on Cancer has classified occupational exposures to firefighters as possibly carcinogenic to humans.14 However, it is well known that firefighters are exposed to many carcinogens during firefighting activities, which include polycyclic aromatic hydrocarbons such as benzo[a]pyrene, as well as asbestos, formaldehyde, benzene and 1,3-butadiene along with many other probable or possible human carcinogens that can become volatilised or aerosolised during a fire.15–19
The lack of integrating exposure information into epidemiological analyses is a fundamental problem in most studies of firefighters. Firefighter exposure monitoring is costly and impractical in most settings. In lieu of exposure measurements, dose–response analyses have relied on exposure surrogates, the most common of which is employment duration. Yet duration of employment has been shown to be a poor correlate of true exposures, which may lead to bias risk estimates in epidemiological analyses.20 Thus, combining duration of employment with additional information that accounts for gradients in exposure potential from job assignments and firefighting strategies are likely to reduce misclassification and ultimately improve risk estimates.
To date, six previous studies examining cancer among firefighters have used surrogate metrics of exposure, other than duration of employment.1 ,3 ,4 ,6 ,7 ,21 The studies by Heyer et al,1 Demers et al3 and Demers et al21 on urban firefighters in the northwestern USA, used duration of exposure as a surrogate metric by assigning each firefighter as on active duty, with the potential for exposure to combustion byproducts, or on administrative duty, without any potential for exposure. Similarly, the study by Guidotti4 on urban firefighters in Alberta, weighted each year of a firefighter's career exposure potential based on job title.
A previous study of Philadelphia firefighters used cumulative fire ‘runs’ as a surrogate metric for firefighter exposure.7 In that study, a fire ‘run’ was defined as any fire engine or truck response that included fire-related and non-fire-related activities. Similarly, Tornling et al (1994) estimated the number of fires attended by each Stockholm firefighter between the years 1931 and 1983, using information in a 10% sample of fire reports made during the observation period. Details on the contents of these reports were not provided, but given the large number examined (190 000), it is likely that they represent all responses by the Stockholm Fire Brigade. Both authors reasoned that the number of runs (or fires attended) is a correlate of hazardous exposure in firefighting; however, a later study by Austin et al20 found that, although an improvement over employment duration, the number of runs may be an unreliable exposure surrogate given that actual exposures vary widely among types of runs. Austin et al20 suggested that the time spent at fires may be a more reliable metric in epidemiological analyses compared with the number of runs.
In this report, we describe the methods used to estimate exposures to firefighters selected for a study on cancer incidence and mortality on urban career firefighters from the Chicago (CFD), Philadelphia (PFD) and San Francisco (SFFD) Fire Departments hired after 1 January 1950.22 Building from previous studies, we developed a cohort-specific job-exposure matrix (JEM) that uses combinations of job title, apparatus assignment, response records and institutional knowledge, to estimate the exposed duration of employment, the number of runs and the time spent at fires for persons in the study.
Methods
Study group
The details of the study group are described elsewhere.22 Essentially, the cohort was comprised of all male firefighters who were employed at the CFD, PFD or SFFD for one or more years on or after 1 January 1950, and followed through 2009. All methods described here pertain to the exposure assessment supporting a longitudinal study of these workers; however, the exposure assessment was conducted by researchers who were blinded to case status, to reduce the likelihood of information bias in the subsequent epidemiological analyses.
Work history data collection and coding
In general, the JEM was constructed from data comprised of unique job titles and apparatus (job) assignments for each firefighter after standardisation across fire departments. The process is illustrated in figure 1 and described in detail in the following paragraphs.

Development of the job-exposure matrix based on standardised job titles and assignments (EMS, emergency medical services; HAZMAT, hazardous materials).
Work history cards and electronic work history records were obtained from the personnel and retirement board offices of the CFD, PFD and SFFD. Several data collection trips were made to each city to identify and collect study information hardcopy and electronic records sources. Relevant hardcopy records were digitally scanned into searchable document files. Record sources included, but were not limited to, departmental work history cards, retirement and pension board records, union reports, department rosters and archived records maintained at fire museums.
The majority of work history information was abstracted from hard copy records maintained by each department from the early 1900s, and for PFD, through the study observation period. SFFD and CFD converted to electronic records systems in the 1990s and early 2000s, respectively. The work history cards and electronic records from each department included date-sequenced job titles, promotions and fire company assignments during a firefighter's career. Information on limited duty assignments or time away from the department resulting from illness, injury, leave of absence or disciplinary action was also available.
Work history databases were created using information abstracted from fire department records. These data were manually keypunched by statistical support personnel using formal coding instructions. For quality assurance, keypunching was validated by duplicate coding and independent review of a random sample comprised of at least 25% of all data entries. On initial completion of departmental databases, audits were conducted to identify missing or potentially erroneous entries. Potential errors were investigated and reconciled using available records. Additional record searches were conducted through the department's personnel, union and fire museum files, to reconcile any missing data.
Fire-run and time at fire data collection and coding
Hard copy reports that contained information on the annual totals of fire-runs (CFD and PFD) and fire hours (CFD only) by apparatus as well as the annual total of greater alarms within the department (CFD and PFD), were collected from the CFD and PFD. The apparatus would generally include engines and trucks as well as several special units such as chemical, hazardous material and rescue units, starting in the mid to late 1950s until 2009. As described previously, a fire-run is any response by an engine, truck or other type of special unit, to a call; the call might consist of an actual fire or hazardous material spill, or it might be a false alarm, which does not distinguish between fire and non-fire-runs. Similar historical fire-run data were unavailable for SFFD.
Time at fire data were available from the CFD and were considered to be the time an apparatus left the station until it returned from being dispatched to a fire. Greater alarm fire data include all fires above a single-alarm fire, which indicate the severity of the fire by increasing number. Fire-run, time at fire and greater alarm data were electronically and manually coded into separate departmental databases.
Fire-run (CFD and PFD) and time at fire data (CFD only) were incomplete for the entirety of the study period for certain combinations of apparatus and years, and were largely unavailable prior to the mid-1950s. Therefore, missing values comprised 22% of the data set and were estimated by interpolation using trends of the two 5-year periods adjacent to the missing value. In the absence of 5 years of adjacent data, the average of the closest 5-year time period was used. Greater alarm data for both departments were complete for the selected time period.
JEM standardisation and assignments
Standardised job titles and unit assignments were created across all three city fire departments, and were mutually agreed on by departmental representatives. All unique collapsed job titles and assignments were given a qualitative assignment based on the potential exposure to combustion byproducts from fire. Each entry in the JEM received a dichotomous (yes/no) assignment for exposure potential based initially on job title and job assignment. Figure 1 illustrates the job title and job assignment standardisation and JEM creation process.
Duration-based JEM analysis
The first exposure metric, ‘exposed-days’, or duration of exposure, was derived based on standardised job titles and assignments, and was available for all the firefighters in the study. This metric was essentially employment duration that was modified to exclude time during which the exposure potential was negligible. For firefighters assigned to one or more standardised exposed job titles or exposed job assignments (figure 1), the time spent in each unique exposed job title/assignment was summed over the entirety of the firefighter's career. The calculated duration of exposure excluded any non-exposed job titles or assignments as well as documented time away from service for injuries, personal reasons, or disciplinary actions. For example, days accumulated as a firefighter assigned to an engine were ‘exposed’, while days worked as a firefighter assigned to headquarters as administrative support were not exposed and were not included in the calculation.
Fire-run and time at fire-based JEM analysis
Fire-runs and time at fire metrics used the same JEM developed for the duration of exposure-based analysis supplemented with data on fire-runs (CFD and PFD) and time at fire (CFD). In order to have fire-runs or fire hours calculated, the firefighter needed a standardised exposed job title and exposed job assignment (figure 1). Annual fire-run or fire hour data were matched to standardised exposed job title/assignments based on the specific apparatus and year. Calculations were then performed by adjusting the amount of time spent per year at each exposed job title/assignment and dividing the annual totals by the average number of shifts worked per station at each department. Cumulative annual totals of fire-runs and hours based on job title and assignment were added to provide a career exposure score for fire-runs and hours.
Since many firefighters will frequently fill vacation/injury relief roles randomly throughout the department, the standardised job assignment given was ‘unassigned’. Any firefighter with a standardised exposed job title and a job assignment of ‘unassigned’ would have the average annual number of truck and engine fire-runs, and time at fire, assigned to them during that specific time period in order to complete the calculation, since they generally moved from station to station filling vacancies where needed.
During the analysis of the PFD fire-run data, it was discovered that there was an increase in fire-runs for engines, starting in the mid to late 1980s, which continued until the end of data collection. This was in stark contrast to truck data and the number of greater alarms, both of which trended downward over the same time period (figure 2A). It was discovered that the increasing trend in engine runs after the mid-1980s was attributable to changes in departmental–response policies, which increased runs unrelated to fires (eg, mutual aid). Thus, to counter the non-fire-related increase, fire-run data for PFD engines were adjusted downward, based on the prevailing trend in truck data and greater alarms. For data before 1980, it was found that the total number of engine runs was consistently about 1.73 times the number of truck runs in any given year. This ratio was assumed to continue after 1980, and therefore the fraction was applied from 1980 to 2009.
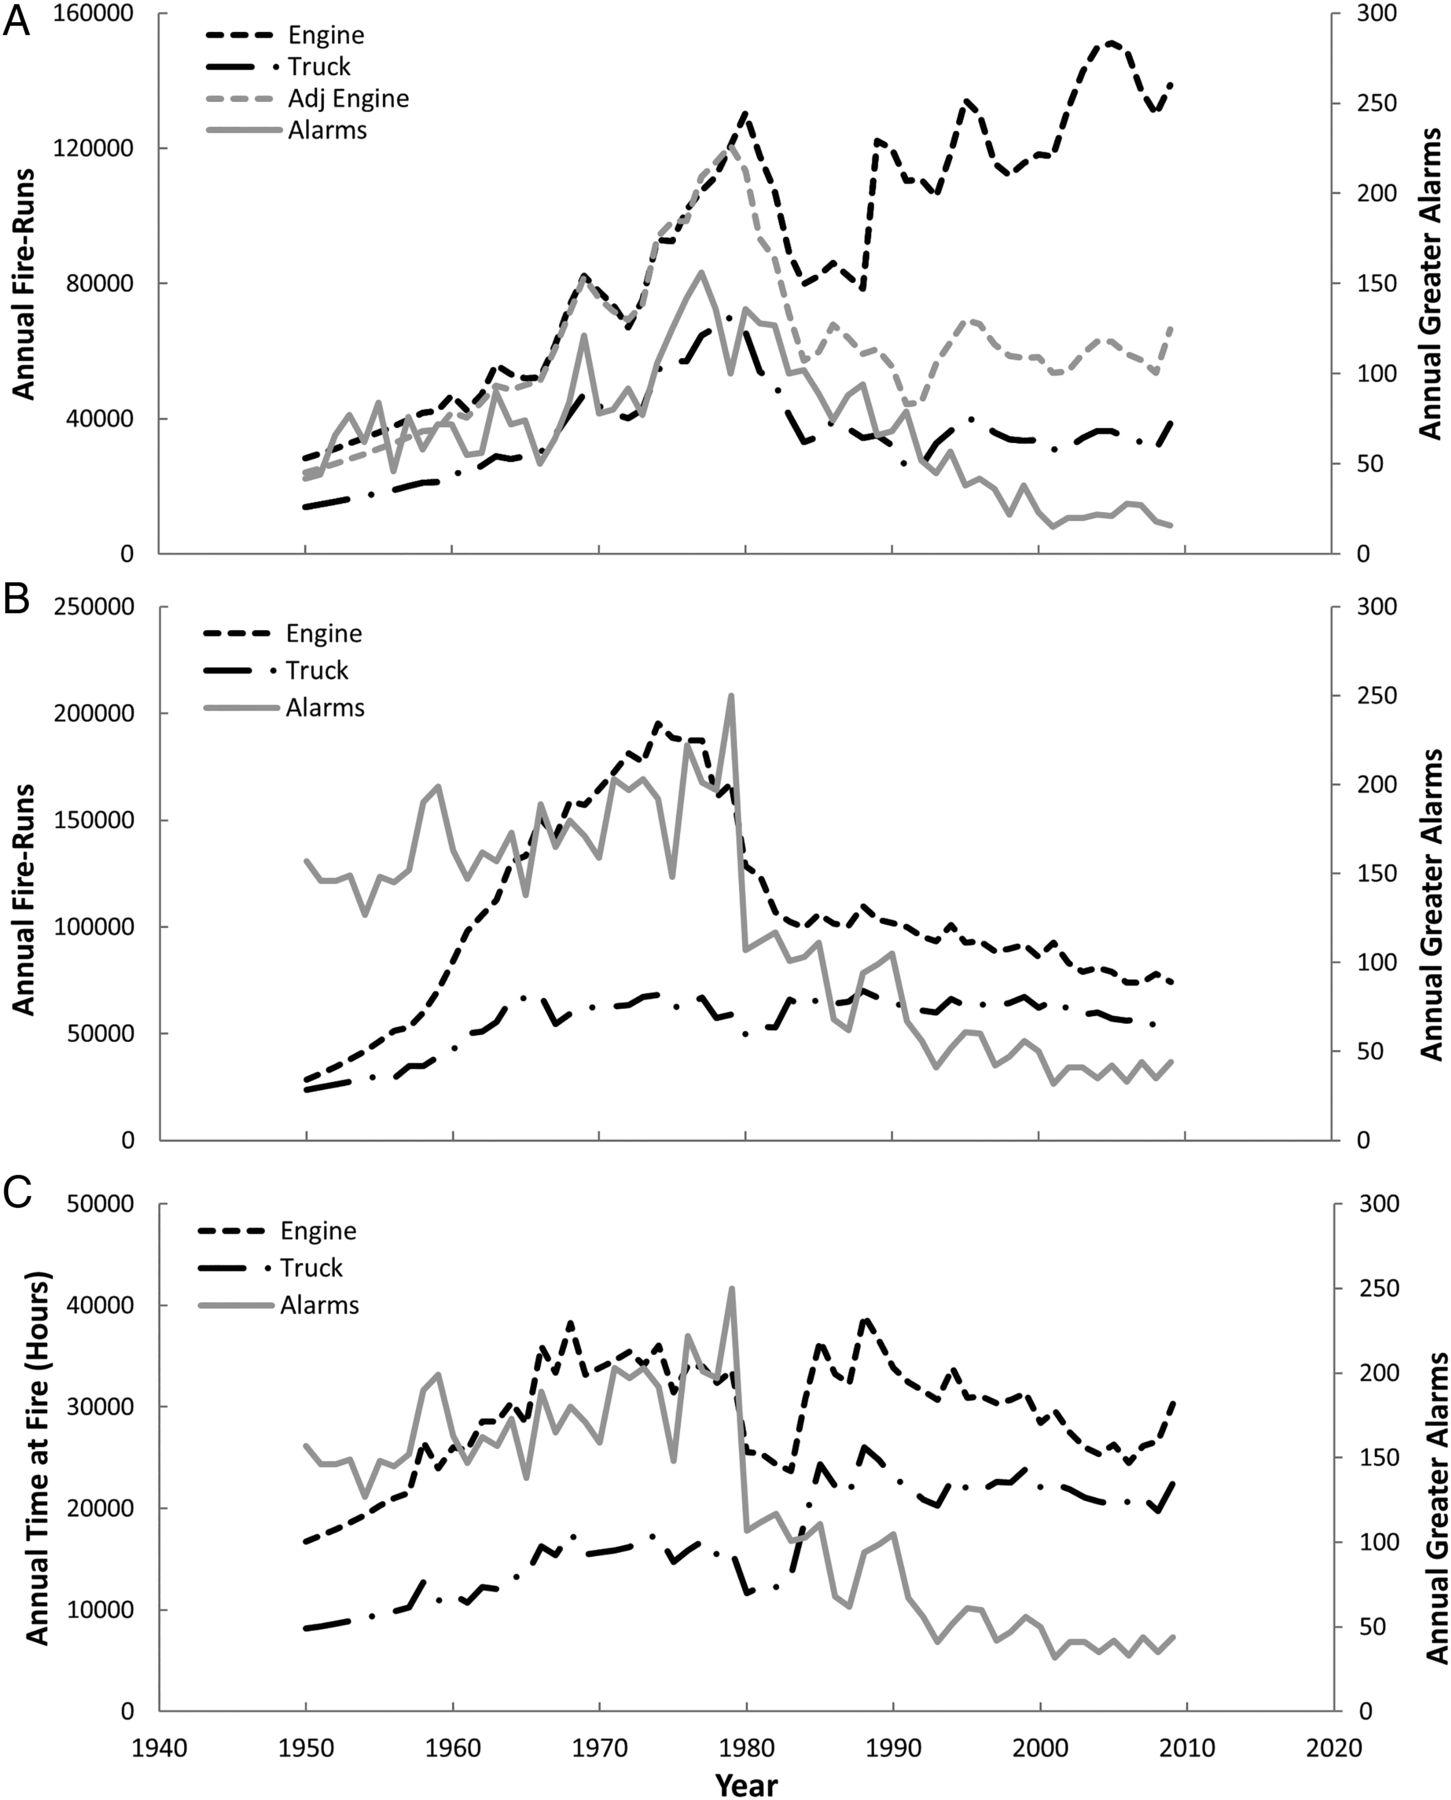
(A) Philadelphia Fire Department fire-runs by engine (adjusted and unadjusted) and truck with the annual greater alarms. (B) Chicago Fire Department fire-runs by engine and truck with the annual greater alarms. (C) Chicago Fire Department time at fire (fire hours) by engine and truck with the annual greater alarms.
Statistical analysis methods
Cumulative duration of employment, duration of exposure, fire-runs and time at fire for each member of the cohort were calculated and are represented as histograms. In addition, Pearson product-moment correlation coefficients between exposure metrics were calculated using Excel.
Per cent of misclassified data was calculated by first dividing the total number of person-years with an exposed job title and exposed job assignment (duration of exposure) by the total number of person-years employed (duration of employment) by decade. This number gives the per cent of employed person time that was considered exposed and, therefore, one minus this number gives the amount of employed person time that would have been misclassified as ‘exposed’ in a study that simply used duration of employment.
Results
There were a total of 19 423 firefighters eligible for the epidemiological analyses. Of these, 12 firefighters from Chicago, 92 from Philadelphia and 10 from San Francisco were excluded due to missing or incomplete work history data. The final JEM-based study cohort included 19 309 male firefighters.
The JEM consisted of 529, 574 and 1195 unique job titles alongside 2214, 8792 and 5168 unique job assignments found within the CFD, PFD and SFFD, respectively, and were collapsed into a total of 15 standardised job titles and 15 standardised job assignments (figure 1). Many of these unique job titles and assignments could be attributed to slight changes in shorthand from the various individuals’ who were hand writing the work history cards over several decades. There were approximately 16 000 combinations of standardised job title, assignment and year combinations used within the JEM.
The average duration of employment for all departments was 20.7 years (7551 days), while the average cumulative duration of exposure was 15.7 years (5721 exposed-days). Firefighters from PFD, SFFD and CFD had an average cumulative duration of employment of 19.5 years (7139 days), 20.3 years (7416 days) and 21.4 years (7825 days), with average durations of exposure of 16.5 years (6024 exposed-days), 16.2 years (5929 exposed-days) and 15 years (5486 exposed-days), respectively. The average number of fire-runs was 5954 from the CFD and PFD, and 1548 h for time at fire from the CFD.
Greater alarms and fire-run data for engine and trucks at the PFD, from 1950 to 2009, are displayed in figure 2A. The data peak for engines, trucks and greater alarms in the early 1980s, followed by a steady downward trend for the greater alarm and truck run data, until 2009. The unadjusted engine data begin to follow the same downward trend starting in the early 1980s, but by the mid to late 1980s, they begin to trend upwards due to the increase in non-firefighting activity. For validation purposes only, the adjusted engine data were calculated for data before 1980 (figure 2A), and the adjusted engine runs differed from actual runs by an average of 7% each year. Furthermore, the average difference was less than 3% for years 1965–1980.
Figure 2B shows the CFD greater alarm and fire-run data from 1950 to 2009. The data follow a trend similar to PFD data, where peak runs and alarms occurred in the late 1970s or early 1980s and trended downward until 2009. However, in figure 2C, the annual time at fire data for engines as well as trucks seem to follow the fire-run trend, peaking in the late 1970s and trending down starting in the early 1980s, but the time at fire data begin to slowly increase and stabilise after the mid-1980s.
The distributions of the cohort by the various exposure metrics are displayed in figure 3 by duration of employment (all departments), duration of exposure (all departments), fire-runs (CFD and PFD) and time at fire (CFD). Inspection of the histograms revealed similar right-skewed exposure distributions among the fire-run and time at fire exposure metrics while the duration of exposure distribution was slightly less skewed. However, these distributions differed greatly compared with the duration of employment metric. Approximately 6% of cohort members, with most having the standardised job title of fire service paramedic, did not have the potential for exposure to combustion products, having exposure scores of 0 from the various metrics, with the exception of duration of employment.
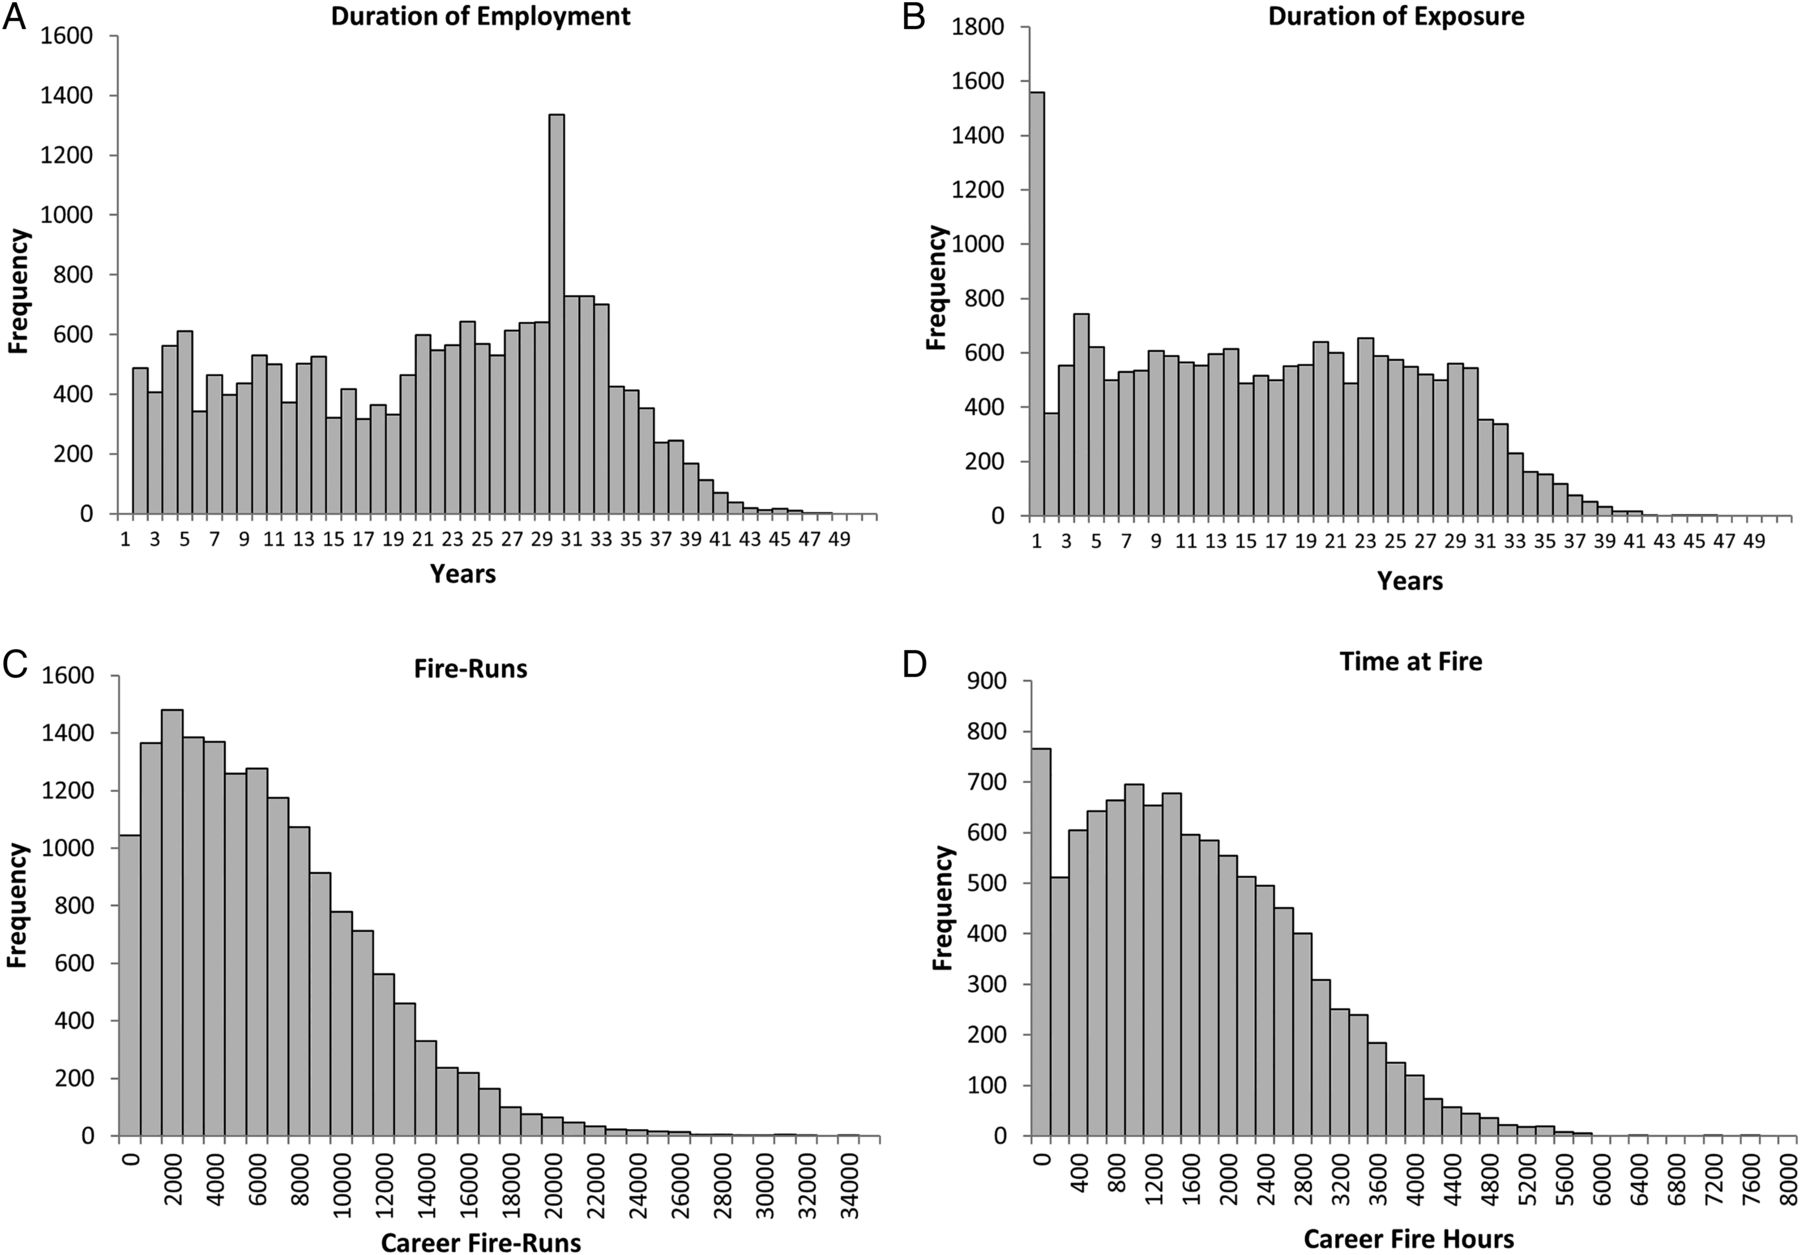
Distribution of the various cumulative exposure metrics. (A) Duration of employment (all departments), (B) duration of exposure (all departments), (C) fire-runs (Chicago and Philadelphia Fire Departments) and (D) time at fire (Chicago Fire department).
Correlations were examined between the four different exposure metrics and are shown in figure 4. The strongest correlation was found between the fire-runs and time at fire metrics (Pearson coefficient=0.92; CFD only), while the next best correlations were found between the duration of exposure and time at fire metrics (Pearson coefficient=0.85; CFD only), as well as the duration of exposure and fire-run metrics (Pearson coefficient=0.82; CFD and PFD), and the duration of employment and duration of exposure metrics (Pearson coefficient=0.77; CFD, PFD and SFFD). The two weakest correlations were between the duration of employment and fire-run metrics (Pearson coefficient=0.67; CFD and PFD), and the duration of employment and time at fire metrics (Pearson coefficient=0.60; CFD only).

Correlation plots of the four possible exposure metrics. (A) Duration of employment versus duration of exposure. (B) Duration of employment versus fire-runs. (C) Duration of employment versus time at fire. (D) Duration of exposure versus fire-runs. (E) Duration of exposure versus time at fire. (F) Fire-runs versus time at fire.
The per cent misclassified as exposed by decade using duration of employment as opposed to duration of exposure is displayed in table 1. The PFD had the lowest total amount of misclassification, at 16%, followed by the SFFD at 20% and the CFD at 30%. The per cent misclassified for all three departments steadily increased by decade, peaking in the 2000s, ranging from 22% to 33%. The per cent of exposed job titles by person-years for all three departments is also displayed by decade in table 1. As time increases from the beginning of the study period in 1950, a steady decrease is seen in the per cent of job titles with potential exposures.
Per cent misclassified as exposed using duration of employment as opposed to duration of exposure
Discussion
This JEM was based on career firefighter work histories and supporting data collected at CFD, PFD and SFFD , in support of a National Institute for Occupational Safety and Health (NIOSH) epidemiological cancer incidence and mortality study. The JEM successfully differentiated potential exposures to combustion byproducts from fires based on standardised job titles and assignments, using several surrogate exposure metrics.
Trends in fire-run, time at fire and greater alarms, from the CFD and PFD, followed similar patterns from previously reported studies and other sources of data. Austin et al20 examined exposure patterns in a study of Canadian firefighters in Montreal, and reported a 17% decrease in structural fires over an 8-year period, from 1985 to 1994. Similarly, the National Fire Protection Association (NFPA) has been collecting data from an annual survey, which began in 1980 and has continued through to the present day. The data show that the total number of fire department runs has increased nationwide since 1980, but a decreasing percentage of those runs are attributable to actual fires.23 This decrease in the number of fire-runs is partially attributed to the increased amount of prevention and educational activities by the departments, improved standards in building codes and the increased use of fire-resistant materials.14 ,20
The correlations displayed in figure 4 suggest that the time at fires and fire-runs are comparable surrogate measures of exposure. Also, the duration of exposure appeared in good agreement with time at fire and fire-runs. In contrast, the duration of employment was a poor correlate of the time at fire and fire-runs. Assuming that time at fires is the best measure, our data suggest that fire-runs followed by duration of exposure are superior to the duration of employment as exposure surrogates. This is in concurrence with the conclusions found by Austin et al,20 who also found a strong correlation between the number of fire-runs and time at fire (Pearson coefficient=0.88).
A higher than expected correlation was found between the duration of employment and duration of exposure metrics, but this can largely be explained by the fact that the cohort could only have durations of exposure that were less than, or equal to, the duration of employment. This limited the amount of spread displayed in the data, which artificially increased the amount of correlation.
This study estimates that the total misclassification rates between the duration of exposure and duration of employment metrics, for exposed and non-exposed firefighters from all three departments, ranged from 16% to 30% (table 1). However, this is most likely an underestimate since the cohort members had to be hired as firefighters on or after 1950, creating a lag period for a portion of those firefighters to ascend into managerial or other non-exposed job titles, depressing the misclassification rates for the first several decades. Therefore, the last several decades most likely represent more accurate misclassification rates, which range from 15% to 37%.
This lag effect is also demonstrated by the per cent of exposed job titles by person-years in the first three decades of the study, with 92–99% of the cohort having standardised exposed job titles. Overall, 85% of the person-years from the cohort had exposed job titles. However, for reasons previously mentioned, the latter decades are likely more representative and ranged from 79% to 83%. In the study by Austin et al,20 it was estimated that 66% of the firefighters had the highest potential for exposure, but they also included non-firefighters such as civilian managerial and support staff, which this study did not. When removing the civilian managerial and support staff, the per cent of exposed firefighters increased to roughly 70%, which is comparable to the range of exposed individuals found in this study.
The JEM has a number of limitations. All surrogate measures of fire exposure used in this JEM are only approximations of potential exposures to combustion byproducts of fire. Approximately one-fifth of the time at fire and fire-run data were missing for the entirety of the study and were subsequently interpolated. Also, it is known that firefighters are frequently not assigned to a specific firehouse or engine/truck, in order to cover injuries or vacations around the department. It was thought that these assignments would be evenly distributed throughout the cohort making the average number of fire-runs/hours for engines/trucks for that time period an acceptable surrogate.
Conclusion
To date, few epidemiological studies on career firefighters have used surrogate metrics of cumulative exposure beyond duration of employment to estimate these exposures. This study demonstrates that exposure misclassification, although inevitable, can be exacerbated by choice of surrogate exposure metric. There was a strong level of correlation between fire-runs and time at fire, and very good correlations between time at fire and fire-runs, compared with the duration of exposure. At the very least, future epidemiological studies should use exposed standardised job titles and assignments to estimate the duration of exposure in the absence of fire-run and time at fire data, which are the preferred surrogate exposure metrics.
Ideally, the preference would be to characterise the exposure potential for each individual firefighter by the true number of fires, time at fires, or the actual levels of exposure to various carcinogens found at fires he/she attended during the entirety of their career. Yet, for purposes of practicality, fire departments have not routinely collected and maintained sufficient information suitable to estimate exposure potentials for each firefighter. However, with the advent of electronic record keeping over the past several decades, vast improvements in the quantity and quality of exposure-related information is being realised in fire departments. In particular, some departments are currently collecting fire-run information (eg, apparatus, call type and time on scene) at the level of the individual responding firefighter. These data are likely to improve exposure estimates for firefighters in future research.
Acknowledgments
This study benefited from the continued cooperation of the men and women serving the Chicago, Philadelphia and San Francisco fire departments. The authors would like to acknowledge the NIOSH staff and their contractors for contributing to the collection, coding and management of study data, which included Faith Armstrong, Adrienne Bullard, Bill Ehling, Jean Geiman, Chris Gersic, Kim Jenkins, Delores Montgomery and Surprese Watts.
References
Footnotes
Contributors MMD participated in the design, data collection and manuscript development. RDD participated in design, data collection and analysis. SB and SA participated in design and analysis.
Funding Research funding was provided by the National Institute for Occupational Safety and Health (NIOSH) by intramural award under the National Occupational Research Agenda (NORA) and by the US Fire Administration (USFA). This research was also supported in part by the intramural research programme of the National Institutes of Health (NIH), National Cancer Institute (NCI).
Competing interests None declared.
Ethics approval This research was approved by the Institutional Review Boards of the National Institute for Occupational Safety and Health (NIOSH), and the National Cancer Institute (NCI).
Provenance and peer review Not commissioned; externally peer reviewed.