Article Text

Abstract
Background Six research groups independently conducted prospective studies of carpal tunnel syndrome (CTS) incidence in 54 US workplaces in 10 US States. Physical exposure variables were collected by all research groups at the individual worker level. Data from these research groups were pooled to increase the exposure spectrum and statistical power.
Objective This paper provides a detailed description of the characteristics of the pooled physical exposure variables and the source data information from the individual research studies.
Methods Physical exposure data were inspected and prepared by each of the individual research studies according to detailed instructions provided by an exposure subcommittee of the research consortium. Descriptive analyses were performed on the pooled physical exposure data set. Correlation analyses were performed among exposure variables estimating similar exposure aspects.
Results At baseline, there were a total of 3010 participants in the pooled physical exposure data set. Overall, the pooled data meaningfully increased the spectra of most exposure variables. The increased spectra were due to the wider range in exposure data of different jobs provided by the research studies. The correlations between variables estimating similar exposure aspects showed different patterns among data provided by the research studies.
Conclusions The increased spectra of the physical exposure variables among the data pooled likely improved the possibility of detecting potential associations between these physical exposure variables and CTS incidence. It is also recognised that methods need to be developed for general use by all researchers for standardisation of physical exposure variable definition, data collection, processing and reduction.
- mechanical worload
- data comparability
- statistical power
Statistics from Altmetric.com
What this paper adds
-
Insufficient sample size causes lower statistical power that may hinder findings of relationships between occupational physical exposures and musculoskeletal disorders.
-
A research consortium sponsored by National Institute for Occupational Safety and Health (NIOSH) pooled data from six individual studies in order to increase the sample size and enlarge the physical exposure spectra.
-
The analyses of the pooled physical exposure data showed increased sample sizes and enlarged spectra of the various physical exposure factor variables.
-
Individual studies collected physical exposure data from vary different jobs, that contributes the increased spectra on the physical exposures.
-
The pooled data set will likely improve the possibility of detecting potential associations between these physical exposure variables and carpal tunnel syndrome (CTS) incidence.
Introduction
Epidemiological studies of job physical factors have shown both positive and negative associations with upper extremity musculoskeletal disorders (UEMSDs), leading to conflicting results across the body of evidence.1–3 One reason for negative findings in individual studies may include lack of power to assess potential relationships between job physical exposures and UEMSDs. Reduced power may result from modest sample sizes, limited jobs studied, low job physical exposure variance, poor data resolution, low data quality and random error. While major results have been reported,1 these individual studies had insufficient power for some exposure-outcome dyads. Data pooling and meta-analyses are common methods to attempt to address that weakness.4
To address these research weaknesses, the National Institute for Occupational Safety and Health (NIOSH) funded several large-scale prospective cohort studies on work-related upper extremity musculoskeletal disorders or UEMSDs in the early 2000s.5–9 The common goal of these studies was to evaluate detailed relationships between workplace physical exposures and work-related UEMSDs. Methods used to quantify physical exposures such as force, repetition and hand/wrist posture were similar, but independently developed.
In 2010, NIOSH funded another study to pool data from six of these prospective cohort studies to provide a more diverse working population, improve statistical power of analyses and more precisely quantify exposure–response relationships for work-related carpal tunnel syndrome (CTS).6 ,8 ,10
At the time these studies were originally incepted, there were no explicit agreements on physical exposure variable definitions, data collection approaches or data processing and reduction methods. Thus some of the exposure measurement methods differed slightly among the individual research studies. However, all these studies aimed to quantify relationships between the commonly recognised physical exposures and work-related UEMSDs and therefore several common physical exposure measures were collected.
The consortium recognised that small methodological differences could adversely affect exposure–response relationships.10 Therefore, it conducted a detailed and time-consuming data pooling process. A subcommittee responsible for pooling physical exposure data was established and conducted a series of activities to develop more comparable physical exposure data sets from these six research studies.10 These activities included visiting each research study, documenting methods used to collect physical exposure data, determining compatibility of exposure variables, establishing methods to achieve comparability of all physical exposure variables, and recommending physical exposure variables to be included for analysis by the consortium.
On completion of study site visits, the subcommittee (1) performed a detailed methodological assessment of the exposure data (methods used for data collection, data processing and data reduction), (2) identified data where daily exposure was too varied to accurately quantify physical exposure (eg, machine repair and maintenance work) or which had missing data for a portion of the work shift, (3) identified differences in variable definitions, (4) proposed consistent definitions for data pooling, (5) prepared a detailed report of physical exposure data for the consortium showing data compatibility as well as any additional work required from each individual study to make data compatible, and (6) provided a prioritised list of job physical exposure variables to be pooled from each study based on information collected.10
The prioritised list of physical exposure variables recommended to pool included several domains of physical exposures that are known to be associated with work-related CTS. They are (1) estimates of levels of hand force exertions, (2) repetitiveness estimates of hand exertions, (3) estimates of percent durations of exertions or duty cycles, (4) estimates of wrist postures and (5) vibration estimates due to power tool use. Since a dimension of physical exposure may be estimated by different methods, more than one physical exposure measures were obtained for some of the same exposure domains. For instance, for the domain of hand force exertions, two measures (worker estimated hand force and observer estimated hand force) were obtained.
Data were pooled at the task level rather than the subtask level (by definition, a worker performs one job in a workday, which may have one or more tasks; a task may consist of one or more subtasks.). Task level was used because most of the research studies did not collect data at the subtask level. All research studies recorded dominant hand exposure so those data were used for the pooling. Table 1 lists the specific variables for each of the physical exposure domains together with their definitions. Variables in the same category indicate that they quantify the physical exposure of the same domain, but different methods were used. The worker estimated hand force in category 1 is the perceived hand force exertion reported by the workers using the Borg scale.11 The observer estimated hand force is the rated hand exertion by an ergonomist from observation of a task performance. Both of the measures quantify the physical exposure domain of the hand force. The observer estimated hand activity level (HAL) is a rated quantity of the repetitiveness aspect of hand exertions using the rating scale proposed by the American Conference of Governmental Industrial Hygienists (ACGIH).12 The variables in the category 6 are the calculated ACGIH threshold limit value levels (TLVs) using the worker estimated hand force and observer estimated hand force variables from category 1 respectively.
Physical exposure variables to be pooled for the consortium study
In our previous publication, Kapellusch et al,10 detailed the process used to pool the exposure data across studies. The present paper presents an analysis of the pooled data. Since these studies will produce a number of publications based on analyses of the pooled data set, this report provides readers a detailed description of the pooled physical exposure variables, and the source information by individual research study group.
Methods
The original cohort studies were approved by their respective institutional review boards (IRBs). The pooled study was also approved by these IRBs.
Members of the six consortium research studies were provided a list of the physical exposure variables that would be included in the pooled exposure data set, together with a detailed set of instructions that described the data inclusion criteria. The exposure subcommittee had numerous communications with members of the groups to clarify data questions. To improve compatibility, review and standardisation of data were performed by each of the research study groups.
Following explicit written instructions, all research study groups submitted their physical exposure data sets to a central location. The individual data sets were then examined to identify missing data patterns and outliers; those were then discussed among the subcommittee and pertinent study groups. Verifications of outlier or missing data were made if needed. This usually included discussions with the researchers responsible for exposure data in each of the pertinent study groups, verification on variable definitions and data processing procedures, and viewing samples of job video clips. Several rounds of such communications and minor data corrections (such as double counting of the same participants, and missing data that should have existed) were conducted prior to the pooling of the exposure data sets.
The distributions for all pooled physical exposure variables were computed at the task level. It was noticed that more than one task at any given observation occurred frequently. For the purpose of computing the overall job level physical exposure variable distributions, the ‘peak’ values (ie, the highest exposure value for a particular physical exposure variable among the tasks for an observation) and the ‘typical’ values (ie, the exposure values that correspond to the tasks with the longest duration in a job) were selected. To simplify the comparisons of the distributions, only baseline physical exposure data (the first measurement for each participant) were used in the distribution calculations. Box-and-whisker plots were plotted for the various physical exposure variables of the research studies. Comparisons between the means of the variables among the research studies were performed using analysis of variance. The Duncan's multiple-range tests were used for post hoc comparisons between the studies.
As each individual study collected prospective cohort data, physical exposure variables were recorded episodically during the studies. As these were convenience cohorts of employed workers, there were naturally decreasing numbers of participants over time. The maximum number of available participants from each research study were calculated and presented for each of the study visits.
Since multiple methods were used to quantify the same domain of physical exposure, correlation analyses between exposure variables of the same category were performed on the baseline data. Correlation analyses were also performed between the other exposure variables in the pooled data set. The Spearman's rank correlation coefficients (r) were used to quantify the degree of correlation between two exposure variables.
All statistical analyses were performed using the SAS statistical programme (V.9.4, SAS Institute Inc, Cary, North Carolina, USA).
Results
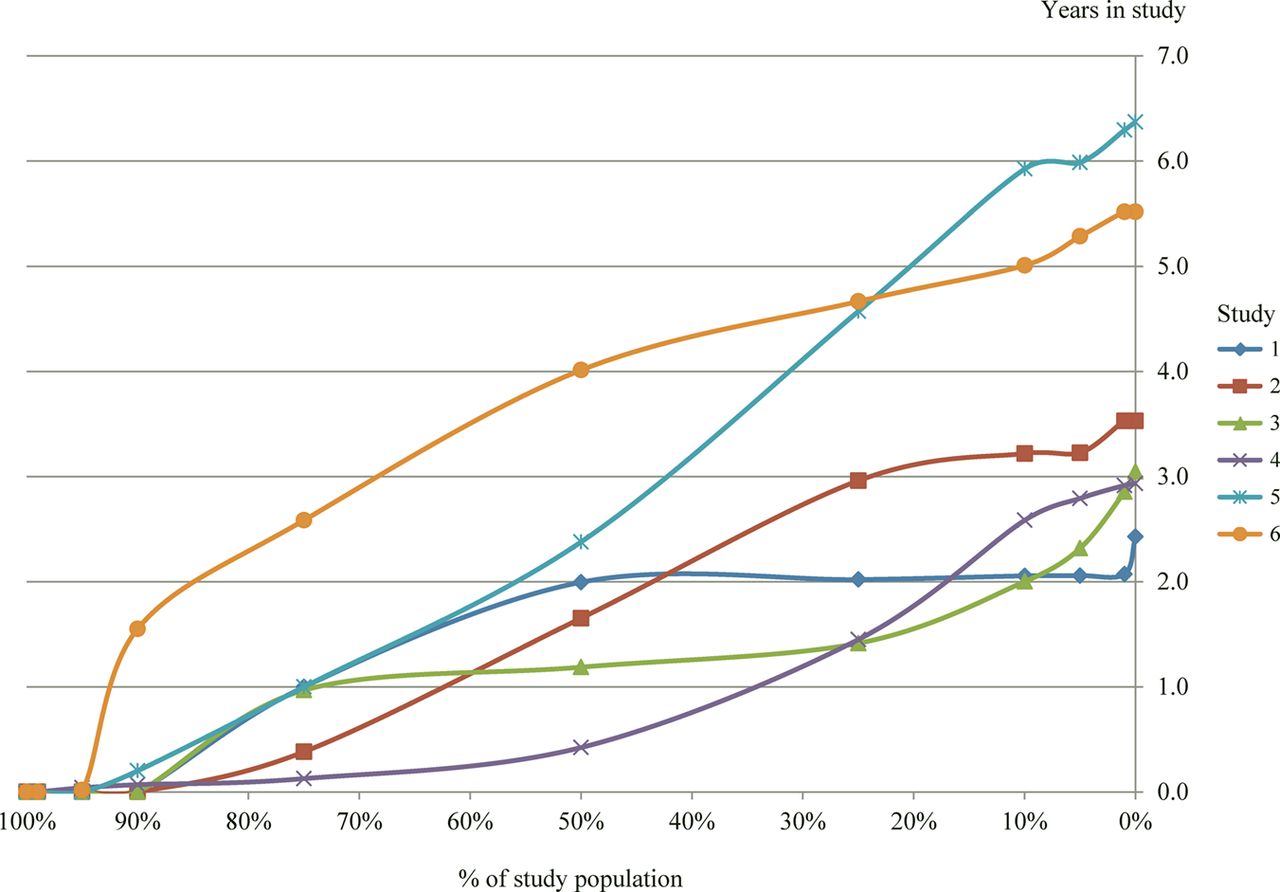
At baseline, there were a total of 3010 participants with both exposure and health outcome data from the six research studies that were eligible for pooling in the exposure–response analyses. These 3010 participants were from 54 US workplaces in 10 US states. A large variety of jobs (ranging from less physical activities such as office workers, pharmacists, and light electronic assembly jobs to very physically demanding jobs such as sawmill workers, school bus manufacturing mechanics and construction workers) were performed by these 3010 participants. The pooled cohort lost participants at differing rates from each research study over the studies’ durations. After 1 year into the study, study 6 had retained the highest proportion of participants (>90%) compared to study 4 which had lost more than 60% of the original study population (figure 1). However, study 6 only had 46 eligible participants at the start of the project. For all participants in the pooled data set, about 75% remained in the study for 1 year, 50% for 1.9 years, and 25% for 2.8 years.

Changes of study populations during the study period of the six studies.
At baseline, the average ages of the male and female participants were 38.9 (SD=11.5) and 43.0 (SD=10.5)-years–old, respectively, and the women were statistically older (p<0.01) than the men. The women had slightly higher body mass index (BMI=28.9) compared to the men (28.4, p=0.02). There were significant age differences between samples from the different individual studies (p<0.01), with study 5 having the oldest group of workers (mean 32 years) compared to the youngest workers in study 2 (mean 27.3 years).
Among the pooled study population at baseline, 57% of the participants had jobs with only one task, 15% had two tasks, 14% had three tasks and the remaining 14% had four or more tasks. The numbers of tasks that a worker had in his/her job differed across the six studies (table 2). The median durations of time spent in ‘typical’ tasks were different across the six studies and ranged between 10 and 44 h/week.
Numbers (N) of participants performing 1–12 tasks in a job by research studies at baseline
Figure 2A shows the distribution of typical observer forceful hand exertion ratings collected by the six studies. Pooling the data across the studies increased the range of the forceful exertion levels compared to the range of values from any single study. For example, study 3 added more high hand forceful exertion jobs (partially due to many physically demanding jobs of stone manufacturing workers), while study 2 provided more jobs with lower hand force exertions resulting in a more heterogeneous study population (partially due to the inclusion of some low physical demand jobs such as office workers and pharmacists). Significant differences (p<0.01) existed among the studies for all comparisons. Similar patterns were also found in the ‘peak’ force values and when the forceful hand exertions were estimated by the workers rather than the observers. In general, jobs studied by study 3 had the highest forceful exertions compared to studies 1, 2 and 6. Jobs from study 6 had the lowest forceful exertions when they were estimated by the observers.

Distribution of “typical” exposure variables across the six studies. (A) Observer typical force rating; (B) Observer typical hand activity level; (C) Typical repetition/min for all exertions; (D) Typical repetition/min for forceful exertions; (E) Typical % duration for all exertions; (F) Typical % duration for forceful exertions; (G) % time that typically wrist extension ≥50 degrees; (H) % time that typically wrist flexion ≥30 degrees.
‘Typical job exposures’ for the three variables measuring repetitive aspects of hand exertions are shown in figure 2B–D, respectively. Studies 3 and 5 had jobs with the highest repetitiveness levels as estimated by the ACGIH verbal anchor HAL12 and studies 1, 2 and 6 had jobs with the lowest repetitiveness levels. A similar trend was found when the repetitiveness was defined as ‘any exertions’ (Rall) rather than ‘forceful hand exertions’ (studies 4 and 6 did not collect this variable). When the repetitiveness was defined as significant forceful exertions (Rforce), study 3 also had the highest repetitiveness value. This may suggest that many jobs included in study 3 primarily involved high repetitive forceful exertions (again the stone manufacturing workers contributed to the high values of therepetitive forceful exertions). A similar pattern was also seen when the ‘peak job exposure’ variables were used for these three repetitive aspects of hand exertions.
‘Typical job exposure’ values of the percent durations (duty cycle) of all exertions (DCall) and forceful exertions (DCforce) are shown in figure 2E, F. Study 2 had the shortest duration of exertions compared to studies 3, 4 and 5, while study 3 had the longest durations for all exertions and study 4 had the longest duration for forceful exertions (study 4 did not have the variable of typical % duration for all exertions, and study 6 did not collect the variables for both all exertions and forceful hand exertions). This pattern was observed for the peak job exposure values of these two variables.
All individual studies had different percent durations for hand/wrist extension ≥50° postures (typical job exposure values shown in figure 2G, H) with study 2 having significantly lower durations at these postures. While the durations for hand/wrist flexion ≥30° differed significantly among the studies with study 5 having the longest duration in hand/wrist flexion ≥30° postures, the magnitude of the differences was not as large as the hand/wrist extension posture variable.
When using the worker-reported and observer-estimated hand force data in the ACGIH HAL TLV computations, the jobs in study 3 had significantly higher exposures compared to those in studies 2 and 6. Hand exposures from jobs in studies 1, 4 and 5 were somewhere between those from studies 2, 3 and 6. Variability of ACGIH HAL TLV scores was increased in the pooled data set as compared to the data sets of the individual studies.
In terms of power tool use, study 3 did not collect data on this variable. There were 31%, 11%, 46%, 54% and 22% participants who used power tools at their jobs for studies 1, 2, 4, 5 and 6 respectively.
Table 3 shows the correlation coefficients (r) between the physical exposure variables collected at the task level. Using descriptive categories according to the correlation coefficients (1—perfectly correlated, 0.81–0.99—almost perfectly correlated, 0.61–0.80—substantially correlated, 0.41–0.60—moderately correlated, 0.21–0.40—fairly correlated, 0–0.20 slightly correlated, and 0—not correlated), we found that hand force estimated by workers (Fw) and by observers (Fo) were moderately correlated (r=0.56). However, the strengths of correlations varied from study to study (r=0.10–0.76).
Correlation coefficient between the physical exposure variables
Regarding measures of repetitiveness, HAL was moderately to fairly correlated with Rall and Rforce (r=0.52 and 0.40 respectively), and with DCall and DCforce (r=0.38 and 0.30, respectively). Similar to measures of hand force, disparate correlations were observed among the studies. Rall and Rforce were moderately correlated (r=0.59), but DCall and DCforce were only fairly correlated (r=0.27).
The frequency of forceful exertions (Rforce) was almost perfectly correlated (r=0.84) with percent duration of forceful exertions (DCforce). Thus, more repetitive tasks seemed to have longer exertion duty cycles. Similar relationship patterns were observed across the different studies.
The two hand/wrist posture measures were only slightly correlated with measurements of forceful exertions, repetitiveness, percent duration of exertion, and power tool measurements (r=0.01 to 0.28). These findings were consistent across all individual studies.
The composite measures (TLVo and TLVw) had moderate to almost perfect correlations with the respective hand force measures (Fw and Fo, r=0.87–0.88) as well as HAL (r=0.56–0.63). The relationship patterns were consistent across the studies. The two TLV values using worker's hand force estimates and observer's estimated hand forces (TLVo and TLVw) were substantially correlated (r=0.67), although the degree of correlations varied among the studies (r=0.33 to 0.96).
On average, worker's estimated hand force values were higher than that of the observers (p<0.0001). Consequently the TLV values using the worker's estimated hand forces were significantly higher than those estimated by observers (p<0.0001). However, when examining the hand force and TLV values stratified by study, significant relationships were observed only within data collected by studies 3, 5 and 6 (p<0.0001), and not by studies 1 and 2 (p=0.0656 to 0.6430). Although study 4 showed significant differences between hand force values quantified by the two different methods, both hand forces and the TLV using worker's estimated values were smaller than those using observer's estimated values (p<0.0001).
Discussion
This pooled study has shown that physical exposures varied significantly from study to study within a consortium (figure 2). By pooling data, we have enlarged the spectra of physical exposures well beyond what any one study can provide. We believe this increased variance is due to the large number of diverse jobs from the 54 workplaces in 10 US states that each consortium member provides, rather than potential differences in data collection methods between the studies that have now been addressed.10 We looked the types of jobs in the different studies and related the perceived job physical demands of these jobs to the calculated exposure distributions. For example, comparing the typical HALs of study 2 and 3 (figure 2B) and the types of jobs (large variety of manufacturing and service jobs such as assembly, and hospital workers from study 2 with perceived low-to-moderate hand activities versus high-intensity hand activity jobs such as stone product manufacturing workers from study 3), we could conclude that it makes sense that the HAL from participants of study 3 is higher than those from study 2. We also took some small samples of jobs from several studies that have similar jobs (hence similar exposures such as electronics assemblers, sewing machine operators), and compared the calculated exposure variables to be sure that they are actually comparable. Researchers often attribute lack of data variance and insufficient statistical power to negative results for expected relationships.13 These beliefs may be plausible since geographical, resource and financial constraints might effectively limit individual research studies to certain types of industries and occupations with resultant narrow physical exposures spectra. This pooled data set's improved statistical power and greater physical exposure variable spectra are the main strengths of this work-related CTS consortium. These features will provide the opportunity to present results without the weaknesses.
The physical exposure variables discussed above are commonly used by many different research groups studying work-related UEMSDs with several having been associated with CTS.1–3 The physical exposure variables cover the three dimensions of forceful exertions (ie, intensity, frequency and duration). All of these parameters are believed to be important in quantifying workplace physical exposures.14 Even without prior coordinated discussions, all six of these individual studies included these prospectively collected exposure variables at the individual level in their exposure quantification methods,10 thus avoiding the limitations of group-based exposure determinations.15
As previously noted,10 although the physical exposure variables collected by the different studies within the consortium were originally believed largely homogeneous, a large amount of heterogeneity among the variable definitions and methods used in data collection, processing and analysis was discovered. Thus, data pooling process was challenging. We pooled only those variables that required limited reanalysis, predominantly due to time and resource limitations. Individual studies collected many other physical exposure variables (eg, wrist ulnar and radial deviation postures) with greater levels of detail (eg, physical exposures quantified at subtask levels vs at task level) than what could be pooled due to insufficient power or incompatible methods
In order to merge data, some compromises were required. For example, study 3 lacked observer-rated force for many workers and worker-rated force was substituted. If this had not been performed this way, the average level of the observer estimated force of the pooled data set would be slightly lower, as the worker estimated hand force was usually higher than the observer estimated hand force according to this pooled data set. Similarly, study 2 used a 10-point scale to rate observer force and it was assumed those ratings were compatible with those of the Borg CR-10 scale.11 While the improved exposure distributions in the pooled data are likely attributable to genuine differences in the physical exposures collected by the individual studies, it is difficult to know whether the pooled distributions may be significantly affected by necessary compromises such as those described above although it seems unlikely.
Measuring or estimating hand force levels, repetition rates and durations of exertions are some of the key tasks in most ergonomics job assessments. Definitions and data collection methods have been well described.15–19 However, this study's physical exposure subcommittee's work revealed some differences in data collection, processing and reduction that can make these seemly well documented exposure parameters somewhat less compatible when collected by different groups.10 These measurement differences, combined with somewhat limited exposure distributions, may explain why studies published by different researchers have reported conflicting results and/or different cut-points for common exposure variables. In order to improve the comparability of physical exposures, efforts to standardise physical exposure variable definitions, data collection, data processing and data reduction should be strongly emphasised.
A few studies have compared self-reported and observer estimates of force.20 ,21 While each of these methods may have different degrees of correlations with data collected by instrumented methods, their strengths in targeting large groups of workers at lower costs make them useful in large epidemiological studies of work-related musculoskeletal disorders and by ergonomics practitioners. However, given this study's results (table 3), it is possible that they address somewhat different aspects of hand forces.
The HAL defined in the ACGIH documentation is a variable related to both the frequency of hand exertions and the duration of the exertions or duty cycle.12 Our results showed that HAL is fairly or moderately correlated with the frequency of all exertions, forceful exertions and the duty cycle of all exertions (table 3). HAL is relatively less well correlated to the duty cycle of forceful exertions (table 3).
As defined by the ACGIH TLV for HAL, the model only applies to steady-state, mono-task jobs.12 However, in many workplace situations multiple, complex forceful exertions exist and the relatively simple definitions for peak force and HAL allow for multiple interpretations. For this reason, in the present study, repetitiveness is defined in two different ways: (1) all exertions irrespective of hand force levels, and (2) hand forceful exertions. Our results show that there is moderate correlation between the frequency of hand forceful exertions and all exertions, but only fair correlation between the duty cycles of forceful exertions and all exertions (table 3). Tasks requiring more frequent forceful exertions may in general require workers to move faster such as in preparing the tasks using the hands without high hand forces. However, while high forceful exertions may require longer duty cycles (ie, it may take longer to complete tasks requiring high hand forces), lower force hand exertions may or may not require longer duty cycles (ie, tasks such as preparing activities that do not require high hand forces can be completed in less time if they are simple or longer time if they are complicated). These are reflected in the higher correlations between the repetitiveness and duty cycle of hand forceful exertions compared to the relatively lower correlation between repetitiveness and duty cycle of all exertions (table 3).
While awkward hand/wrist postures have been a hypothesised factor for work-related CTS, it is a variable that is extremely difficult to quantify.1 ,22 ,23 Silverstein found no significant association between percentages of cycle time observed in extreme wrist posture and CTS.24 Bao et al studied the inter-rater reliability of posture observations of different body joints and found hand/wrist posture estimates are particularly difficult to accurately quantify.22 The significant differences found in the durations of wrist extension ≥50° and wrist flexion ≥30° (figure 2G, H) may partially be due to the different task exposures across the studies, and partially due to the different methods and observers used by the different studies.
Conclusions
This pooled, large data set of the measured physical factors has greater exposure variance with likely increased statistical power to study the incidence of work-related CTS. The prospective study design and individual physical exposure assessment approaches are study strengths. The increased spectra of the physical exposure variables among the data pooled from the different studies likely improve the potential to detect associations and interactions between the physical exposure variables and incidence of CTS.
Current job exposure estimation practices may vary significantly and be responsible for prior discrepant results. This study found that work is needed to standardise physical exposure definitions, data collection, processing and reduction methods. Addressing these issues would likely assist researchers and practitioners in the future to achieve better study results comparability, ability to pool study data, and/or compare ergonomics job evaluation results.
References
Footnotes
-
Funding This study was funded, in part, by a grant from the National Institute for Occupational Safety and Health (NIOSH/CDC) 5R01OH009712, and Washington State Department of Labour and Industries, Olympia, Washington, USA.
-
Competing interests None.
-
Patient consent Obtained.
-
Ethics approval University of California IRB, Washington State IRB, etc.
-
Provenance and peer review Not commissioned; externally peer reviewed.