Article Text

Abstract
Objectives: To alleviate traffic congestion in Central London, the Mayor introduced the Congestion Charging Scheme (CCS) in February 2003. We modelled the impact of the CCS on levels of traffic pollutants, life expectancy and socioeconomic inequalities.
Methods: Annual average NO2 and PM10 were modelled using an emission-dispersion model. We assumed the meteorology and vehicle fleet remained constant during the pre- and post-CCS periods to isolate changes due to traffic flow. Air pollution concentrations were linked to small area socioeconomic, population and mortality data. Associated changes in life expectancy were predicted using life table analysis and exposure-response coefficients from the literature.
Results: Before the introduction of the CCS, annual average NO2 was 39.9 μg/m3 and PM10 was 26.2 μg/m3 across Greater London. Concentrations were 54.7 μg/m3 for NO2 and 30.3 μg/m3 for PM10 among census wards within or adjacent to the charging zone. Absolute and relative reductions in concentrations following the introduction of the CCS were greater among charging zone wards compared to remaining wards. Predicted benefits in the charging zone wards were 183 years of life per 100 000 population compared to 18 years among the remaining wards. In London overall, 1888 years of life were gained. More deprived areas had higher air pollution concentrations; these areas also experienced greater air pollution reductions and mortality benefits compared to the least deprived areas.
Conclusions: The CCS, a localised scheme targeting traffic congestion, appears to have modest benefit on air pollution levels and associated life expectancy. Greater reductions in air pollution in more deprived areas are likely to make a small contribution to reducing socioeconomic inequalities in air pollution impacts.
Statistics from Altmetric.com
To alleviate traffic congestion in Central London, the Mayor introduced the Congestion Charging Scheme (CCS) in February 2003. Currently, drivers are charged £8 (approximately US$16) a day for driving into a designated zone during working hours. To date, evidence indicates congestion has improved: excess delay per kilometre during charging hours is 26% lower than in 2002, and the volume of traffic circulating within the charging zone has remained lower than before the introduction of the scheme.1 However, the CCS may have additional impacts on levels of traffic related air pollution and associated health outcomes, which have not been previously assessed.
Evidence from epidemiological research indicates exposure to traffic is associated with a number of adverse health impacts including mortality,2 3 myocardial infarction4 5 and impaired lung development in children.6 While the observed associations are small, in metropolitan areas like London, exposure is pervasive giving rise to large population attributable risks.7 Moreover, spatial variation in traffic pollution may contribute to socioeconomic inequalities in exposure and associated health effects.8
There is considerable international interest in the potential air pollution and mortality impacts of the CCS, a policy designed to reduce traffic congestion in a major world city. We report the first model-based analysis of these impacts and their socioeconomic variation.
METHODS
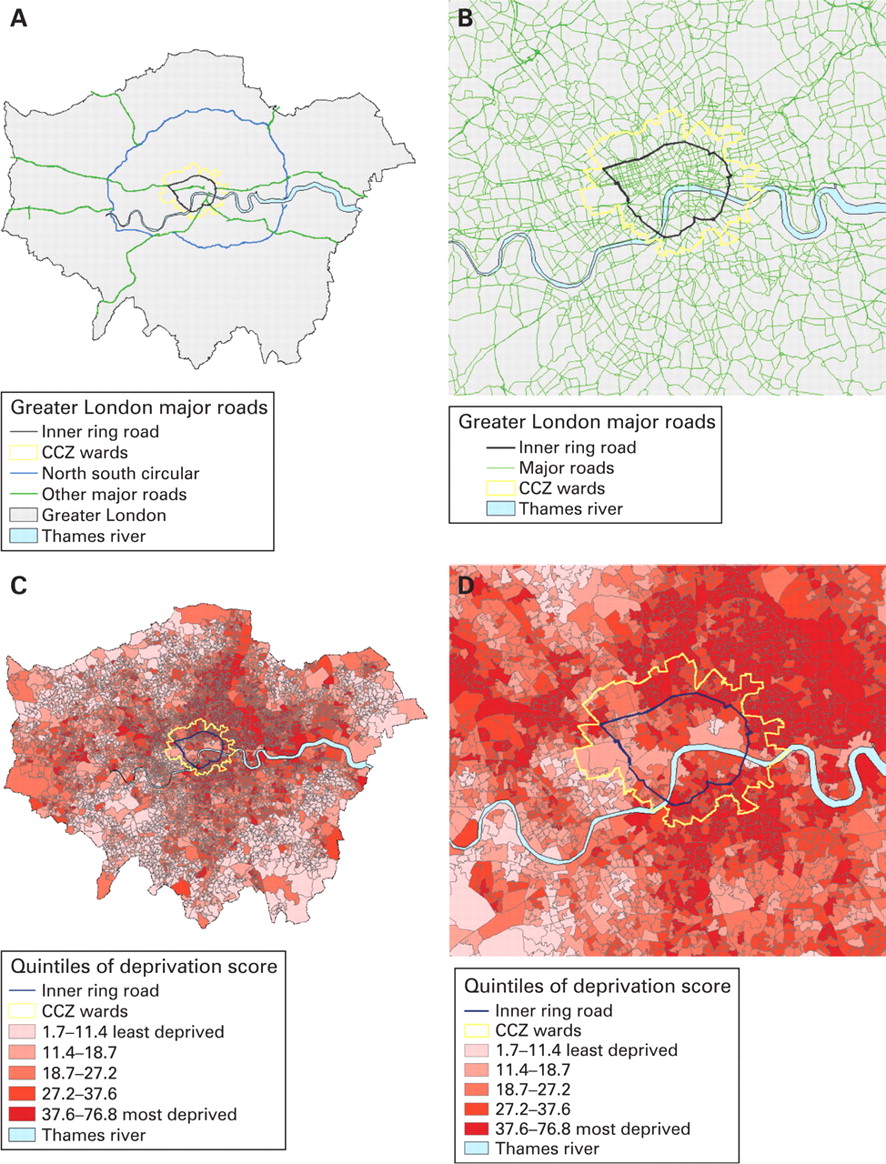
From its introduction on 17 February 2003 until 19 February 2007, the Congestion Charging Zone (CCZ) included a small area of Central London delineated as the area within, but not including, the Inner Ring Road (IRR), as shown in fig 1. It covered approximately 21 km2 and contained a resident population of 200 000 compared with the over 7 million residents of Greater London (a Government Office Region). In 2007, the charging zone was extended westward to include a substantially larger area and population; however, this extension is not included here. To facilitate the analysis of mortality benefits and to allow for impacts of changes in traffic flow on air pollution levels slightly beyond the IRR, we defined census wards within or immediately adjacent to the CCZ boundary as “CCZ wards”, and all other wards of Greater London as “non-CCZ wards”.
Air pollution modelling
Concentrations of NO2 and PM10 were estimated using a combined emission-dispersion and regression modelling approach. Emission-dispersion modelling was used to model the NOx contribution of two source types: roadways and urban background. Firstly, roads within a 500 m buffer of a prediction point were modelled using ADMS Roads (CERC, Cambridge, UK) with additional modelling of street canyons using OSPM (National Environmental Research Institute, Roskilde, Denmark).9 Secondly, all other sources including road traffic beyond the 500 m buffer were modelled as the urban background using ADMS 3 (CERC). A regression modelling approach was then used to calibrate the results from the emission-dispersion model by scaling the roadway and urban background contributions to measurements of annual mean NOx at 31 monitoring sites. The contribution of regional sources of NOx from outside London was estimated as the model intercept. Specifically, regression modelling was used to estimate coefficients for the roadway, urban background and regional source types (R2 for 2003 = 0.83). These coefficients were then used to predict NOx concentrations at prediction points on a uniform 20 m×20 m grid. Primary PM10 was modelled using the same regression coefficients as for NOx. Primary PM10 was then combined with secondary PM10 to estimate total PM10 concentrations using the approach described by Fuller and colleagues.10 Secondary PM10 was assumed to be the fraction of measured PM which was not correlated with NOx.10 NO2 was derived from NOx concentrations using the methods described by Carslaw et al.11 Model inputs include meteorological data collected at Heathrow Airport and detailed data on traffic flow (ie, vehicle kilometres), speeds and vehicle type contained in the London Atmospheric Emissions Inventory.12 Percentage changes in traffic flow by vehicle type on the IRR and within the charging zone were based on monitored traffic reported by Transport for London.13 Because changes in traffic flow were modelled as relative changes, major roads with large traffic flows generally changed more than smaller roads. Changes between 2002 and 2003 in traffic speed, which strongly influences vehicle emissions, were accounted for along each major and some minor road segments in the road network using methods described elsewhere.14 Model predictions were validated against ambient measurements at 25 NOx monitoring sites that were not included in the calibration step and a total of 43 PM10 monitoring sites.15 For 2003, the R2 regressing predicted annual mean on measured concentrations was 0.76 (RRMSE = 14%) for NO2 and 0.73 for PM10 (RRMSE = 11%).
Because meteorology and time trends in the vehicle fleet composition influence ambient air pollution concentrations, we compared two modelling scenarios designed to isolate changes in pollution due only to changes in traffic flow and speed. Specifically, we modelled the pre-CCS scenario, which included the meteorology and vehicle fleet from 2003 but used traffic flow and speed data from 2002. This was compared to the post-CCS scenario, which was run using meteorology and vehicle fleet from 2003 as well as traffic flow and speed data from the period of 2003 following the introduction of the CCS. We therefore assumed (1) meteorology was the same in both periods and (2) no downward trend in vehicle emissions as newer vehicles replaced older ones.
Sensitivity analyses
Some changes in traffic flow and speed between the pre- and post-CCS periods occurred for reasons other than the CCS; therefore, we modelled the post-CCS scenario where the only changes in traffic flow and speed were on the IRR and within the charging zone. Since some vehicles were exempted from the charge,16 changes in fleet composition between the pre- and post-CCS scenarios may have been, to some degree, attributable to the CCS. In a second sensitivity analysis, we therefore held meteorology constant but allowed the composition of the vehicle fleet to change over time to investigate the relative importance of time trends in vehicle fleet composition and to account for any changes in the fleet due to the introduction of the CCS. Census wards reflect administrative boundaries; consequently, identifying the residential population most affected by the charging zone using census ward level data requires the formation of an arbitrary boundary, such as that of the CCZ wards. To identify the sensitivity of our results to the boundary of the CCZ wards, we conducted a third sensitivity analysis in which the CCZ wards area was redefined as wards with centroids within the IRR.
Quantification of mortality impacts
Mortality impacts of the CCS were estimated in terms of years of life gained (YLG) using a quantitative risk assessment approach, in which the modelled changes in pollution concentrations were combined with pollution-mortality relationships derived from published epidemiological studies. Population exposures to NO2 and PM10 stratified by quintile of socioeconomic deprivation were obtained by overlaying within a GIS (ArcGIS; ESRI, Redlands, CA, USA) the modelled pollution concentrations for the pre- and post-CCS scenarios with data for the 4765 Lower Layer Super Output Areas (a census area with an average of 1500 residents)17 within Greater London. Super output areas were classified into quintiles of deprivation using the 2003 Index of Multiple Deprivation (IMD)18 (fig 1). The IMD is an area-based aggregation of dimensions of deprivation including: income; employment; health deprivation and disability; education, skills and training; housing; barriers to housing and services; crime; and living environment.18
We combined available estimates of the association between long-term exposure to NO22 19–21 or PM1019 21and all-cause mortality observed in European and US populations (table 1). Estimates were averaged using a fixed effects inverse-variance weighted method.22 The combined estimates resulted in a relative risk of all-cause mortality of 1.10 (95% CI 1.06 to 1.14) associated with a 10 μg/m3 increase in NO2 and 1.10 (95% CI 1.04 to 1.16) for an equivalent increase in PM10. The combined estimate was applied to the population aged between 30 and 90 years of age; we assumed no effect of air pollution for other age groups. Baseline mortality rates by 5-year age groups and quintiles of IMD were calculated using all-cause mortality data (2001–2003) among census wards within Greater London. Deaths and ward level IMD were obtained from the Office for National Statistics,23 24 and ward population counts were obtained from the 2001 Census.25
YLG attributable to modelled change in exposure were predicted using standard life table analysis26 with AirQ software (version 2.2.3; WHO, Bonn, Germany). YLG is a measure of the average extension of lifespan in a given population due to a decrease in mortality rate associated with reduced air pollution exposure. Specifically, YLG was calculated as the absolute difference in years of life between the survival functions of the population exposed to the concentrations in the pre- and post-CCS scenarios. For the purposes of comparison across areas and deprivation groups, YLG per 100 000 population over 10 years following the introduction of the CCS were calculated.
RESULTS
Air pollution exposure patterns
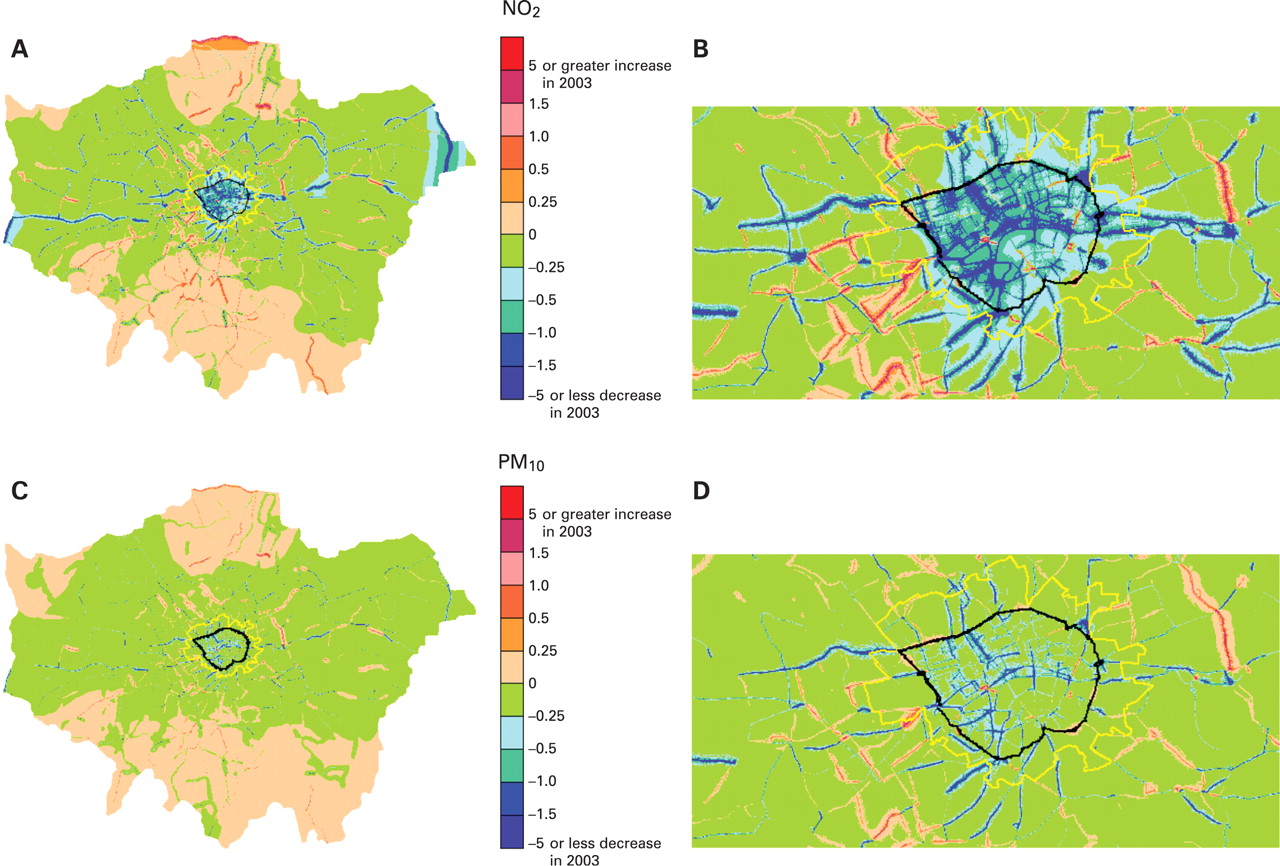
Modelled concentrations of NO2 and PM10 during the pre- and post-CCS scenarios were substantially higher in the CCS wards compared to the rest of London (table 2). Figure 2 and table 2 present the difference in modelled concentrations between the pre- and post-CCS scenarios. Across Greater London, there was relatively little change in annual average concentration. However, more substantial decreases in concentrations were estimated within the IRR and along radial roadways approaching the zone (fig 2). For each pollutant, modelled concentrations increased with increasing deprivation (table 2). The socioeconomic gradient in concentration was smaller for PM10, a pollutant with many non-vehicle sources and with relatively little spatial variation.27

Mortality
The Greater London population was predicted to gain 26 years of life per 100 000 population from the modelled reduction in NO2 (table 2). Within the CCZ wards, the predicted YLG per 100 000 population was 183, while the benefit was only 18 in the remaining wards. The CCZ wards had a smaller population however; and total predicted YLG within the CCZ wards was smaller compared to the remaining wards. Although predicted YLG were modest in magnitude, there was a consistent socioeconomic patterning of benefits.
Sensitivity analyses
When changes in traffic flow were restricted to only the IRR and within the charging zone, modelled changes in air pollution and predicted mortality benefits were smaller than in the primary analysis (table 3). Concentrations and reductions in NO2 were smaller even within the CCZ wards, reflecting the influence of changes in traffic flow outside the IRR (eg, radial roads) on air pollution levels within the CCZ wards. When both traffic flow and vehicle fleet composition changed, benefits were more widespread across Greater London: YLG per 100 000 population were three times larger than in the primary analysis within the CCZ wards, but were 14 times larger for the non-CCZ wards. The population of the CCZ wards in table 3C was considerably smaller (202 500) than in the primary analysis leading to smaller total YLG. However, on a per population basis, the alternative boundary resulted in a 30% increase in YLG for the CCZ wards. The predicted YLG for the surrounding wards was essentially unchanged from the primary analysis.
DISCUSSION
The London Congestion Charge is one of the largest, most ambitious traffic congestion schemes globally. As such, the scheme has attracted widespread interest among decision makers as well as the public. Similar traffic management schemes have been implemented or are being considered in other cities worldwide.28 29 To our knowledge, this is the first effort to estimate the magnitude of impacts of the scheme on air pollution associated changes in life expectancy. Furthermore, this analysis provides an indication of the extent to which a localised traffic intervention may influence socioeconomic inequalities in exposure to traffic pollutants and associated health effects.
A number of conclusions can be drawn from this analysis. Changes in concentrations of NO2 and PM10 due to traffic reductions were modest across Greater London. Both absolute and relative reductions in concentrations were greatest within the CCZ wards reflecting the localised nature of the scheme. Traffic monitoring indicates an appreciable decrease in annual average daily traffic for cars (26%) and heavy goods vehicles (7%) between the pre- and post-CCS periods within the charging zone, a small increase in redirected traffic along the IRR, and no systematic change in traffic on local roadways surrounding the zone.1 13 Reductions in NO2 concentrations were greater than for PM10, a pollutant with many non-traffic sources, which would have remained unaffected by the scheme. Based on our model, road traffic contributes roughly 25% of NO2 concentrations across Greater London, but less than 10% of PM10, although the road traffic contribution is greater for both pollutants in Central London where vehicle emissions are dominant sources. There was a consistent socioeconomic gradient in concentrations of NO2 and PM10 such that higher concentrations occurred in more deprived areas. The gradient was smaller for PM10, as expected given its relatively homogenous spatial distribution.27 A more pronounced socioeconomic gradient in YLG was predicted, reflecting the greater reduction in exposure and higher baseline mortality among more deprived groups. While the total predicted health benefits were largest for Greater London, the life expectancy gained per 100 000 population was greatest within the CCZ wards. Although small in magnitude, this analysis suggests there would be an extension of life expectancy due to reduced traffic related air pollution from the introduction of the CCS. Furthermore, the scheme appears to have led to a modest reduction in socioeconomic inequalities in air pollution exposures and associated mortality.
The use of modelling to determine health impacts is an indirect approach. However, this approach provided a number of advantages over more direct epidemiological methods using routinely collected data. Time trends in meteorology, traffic patterns and vehicle fleet composition strongly influence ambient air pollution concentrations and thus population exposures. For example, ambient concentrations and exposures to PM10 were unusually high in London in 2003 due to increased long-range transport.30 Our modelling approach allowed for changes between pre- and post-CCS concentrations to be estimated effectively holding the influence of meteorology and vehicle fleet composition constant, allowing us to better isolate the influence of changes in traffic flow and speed. Furthermore, changes in air pollution concentrations between the pre- and post-CCS periods were small; associated changes in mortality rates would have been difficult to detect using routinely collected data.
There are a number of sources of uncertainty in this analysis including, but not limited to, modelled changes in air pollution, the population exposed and the exposure-response estimates. Firstly, modelled changes in concentrations were modest, particularly for PM10. These changes are very likely to be smaller than the overall uncertainty in the air pollution model, which at present is not well quantified. However, we assessed the influence of various assumptions about changes in traffic flow and vehicle fleet through sensitivity analyses. Traffic flow data are not updated on each road segment every year but are instead updated on a rotating basis. To the extent that traffic flow decreased after 17 February 2003 at locations unaffected by the CCS, the primary analysis overestimates the impact of the CCS on traffic emissions and air pollution concentrations. We therefore conducted a sensitivity analysis using only traffic changes on the IRR and within the charging zone to provide a lower bound of estimated impacts. However, this sensitivity analysis may underestimate impacts if the CCS also reduced traffic flows on radial roadways approaching the charging zone. As a second sensitivity analysis, we calculated impacts allowing the vehicle fleet to change between the pre- and post-CCS scenarios. Although this sensitivity analysis makes the unrealistic assumption that all improvements in efficiency of the vehicle fleet were attributable to the CCS, it provides a useful upper bound estimate and indication of the importance of the vehicle fleet composition relative to changes in traffic flow.
Secondly, we assessed the air pollution and mortality impacts only among the resident population of Greater London and the CCZ wards since data were not readily available to include the population working in these areas. This population may differ substantially from the resident population, particularly in areas within the charging zone which have a high concentration of businesses and relatively small resident population. The charging zone contains unique areas such as the City of London, a centre for financial services, which had a resident population of only 8000 but 312 000 jobs in 2003.31 Moreover, the socioeconomic characteristics of people working within the charging zone could differ from those of the resident population. The distribution of benefits with respect to deprivation in an analysis considering both the resident and working populations could be substantially different from our prediction.
Thirdly, no estimates of the association between long-term exposure to NO2 or PM10 and mortality were available for the London population; thus we used estimates from external populations. Rather than rely on an estimate observed in a single population, which may have limited generalisability to the London population, we combined estimates from studies of long-term exposure to NO2 or PM10 and all-cause mortality among European or US populations. We chose effect estimates from cohort studies since time series studies do not provide direct information on the amount of lifetime lost and likely underestimate the impact of exposure on average life expectancy.32 33 This approach assumes there were no important differences in the distribution of factors influencing susceptibility or toxicity of PM10 across studies, and the exposure assessment in the other studies (table 1) are comparable to our modelling approach. None of the studies used the same modelling approach to assess exposure to air pollutants as we did. Of the studies included in the averaged estimate, the study by Hoek et al2 is likely to be the most comparable to ours with respect to exposure assessment since it explicitly accounted for spatial variation in exposure due to traffic sources. We chose not to use this estimate alone because it had a relatively large standard error. Furthermore, individual study estimates did not differ widely despite differences between studies in design, population characteristics and exposure assessment: per μg/m3, estimates (SE) ranged from 0.007 (0.003) to 0.013 (0.005) for NO2, and 0.009 (0.003) to 0.017 (0.010) for PM10. None of the three studies which observed general populations reported evidence that sex modified the effect of air pollution exposure on mortality; therefore we also included the Gehring et al21 study, which observed only women, in our average estimate. We assumed the combined estimates applied only to the population between 30 and 90 years of age since this included the age ranges observed across studies. We modelled population exposures to PM10 rather than PM2.5 although more robust exposure-response estimates are available for PM2.5,34 since more comprehensive ambient monitoring data were available for validation of PM10 predictions. Moreover, PM10 has long been the emphasis of regulation of particulates in the UK. We chose not to include confidence intervals around predicted YLG, since the only quantified source of uncertainly was sampling error of the exposure-response estimates. To include confidence intervals based on sampling error alone, which is unlikely to be the most important source of uncertainly, could be misleading.
The life table approach used to calculate YLG also relies on a number of assumptions.26 Our life table analysis assumed future mortality rates experienced over the population’s lifetime would be identical to current rates; however, this is unlikely given trends in risk factors for premature mortality, treatments and prevention strategies. Similarly, a sustained change in concentration due to lower traffic flow was assumed to apply over 10 years. This may not be the case as the vehicle fleet becomes more efficient, such that a given reduction in traffic flow leads to a smaller proportionate reduction in emissions. The analysis also assumed immediate and complete reversal of the effects of air pollution on mortality rates. The time interval necessary for changes in long-term exposure to air pollution to influence mortality rates remains uncertain but is unlikely to be immediate.35
Main messages
Absolute and relative reductions in NO2 and PM10 were greatest within the Congestion Charging Zone wards.
Reductions in NO2 were greater than for PM10.
There was a consistent socioeconomic gradient in NO2 and PM10 concentrations with higher concentrations in more deprived areas and an even stronger socioeconomic gradient in predicted benefits.
The Congestion Charging Scheme (CCS) has had only a modest impact on concentrations of traffic related air pollution and life expectancy.
CCS appears to have resulted in a modest reduction in socioeconomic inequalities in exposure to traffic related air pollution and mortality rates.
Policy implications
Policies affecting a larger geographical area and residential population, and which aim to directly reduce vehicle emissions, are likely to have larger public health impacts.
While this analysis accounts for larger reductions in exposures to traffic related pollution among residents of more deprived areas, as well as their higher baseline mortality rates, it does not account for potential differences in susceptibility. Deprived individuals may be more susceptible to adverse health effects of air pollution due to their relative disadvantage or predisposing health conditions or behaviours.8 A recent review reported that five of six cohort studies observed stronger associations between long-term exposure to air pollution and mortality among lower socioeconomic groups.36 However very few of the results were statistically significant, and the review highlighted a number of difficulties in making definitive conclusions about which dimensions of deprivation may modify the association. Of the studies we included in the average estimate, Gehring,21 Hoek2 and Krewski et al19 observed non-significantly elevated relative risks among less educated subpopulations. None reported education specific effect estimates for NO2 or PM10 that could be used in this analysis. Therefore, we applied population average exposure-response estimates for all deprivation groups. If the association between long-term exposure to air pollution and mortality is greater for more deprived groups, our analysis underestimates the life expectancy benefit experienced by more deprived groups and the reduction in inequalities in mortality rates.
Exposure to ambient air pollution is associated with a broad spectrum of adverse health effects.37 In this analysis, we considered only the impact of exposure on all-cause mortality in adults. In addition to mortality, evidence supports associations between air pollution and lung cancer38 and cardiovascular morbidity in adults.39 Furthermore, considerable evidence supports an association between air pollution exposures and respiratory outcomes in children6 40 as well as pregnancy and infant health outcomes.41 The total benefit of a reduction in air pollution exposure on all probable adverse health outcomes is likely to be much greater than we have estimated.42
This analysis considered two pollutants, which are temporally and spatially correlated with one another as well as with other pollutants emitted from vehicles. It remains unclear whether observed associations between NO2 and many health outcomes reflect the effect of NO2 itself or the correlation between NO2 and traffic particles.35 Therefore, the impacts on life expectancy derived from a pollutant specific exposure-response function cannot be summed across pollutants to reflect exposure to multiple pollutants.43 Rather, pollution specific impacts on life expectancy should be considered separately and interpreted as capturing partially overlapping aspects of exposure to the mixture of traffic related pollution.
To date there have been few investigations of the health effects of reduced air pollution resulting from policy interventions.44–46 Following the restriction of high sulphur fuel in Hong Kong, lower exposure to SO2 over 2 years was associated with an estimated 31 days of lifetime gained for each individual.45 Cardiovascular deaths decreased by 10% (95% CI 8 to 13) following the banning of bituminous coal in Dublin and consequent reduction in air pollution.46 However, no similar intervention studies have focused on traffic management programs, and essentially no direct evidence currently exists quantifying the reduction in mortality rates associated with reduced traffic pollutants. Defra has estimated 39 million years of life (64 800 per 100 000 population) would be lost among the UK population due to exposure to man-made fine particles over a 100-year period.47 Although not directly comparable to our results, this estimate provides an indication of the mortality burden of particulate air pollution in the UK that could potentially be reduced through pollution control strategies.
In conclusion, the CCS is a localised intervention designed to reduce traffic congestion rather than vehicle emissions or ambient concentrations. Consequently, the modelled impact on concentrations of traffic related air pollution and life expectancy was modest. Nonetheless, this model based analysis suggests the CCS resulted in a small reduction in socioeconomic inequalities in exposure to traffic related air pollution and mortality rates. Policies affecting a larger geographical area and residential population, and which directly aim to reduce vehicle emissions, are likely to have larger public health impacts.
REFERENCES
Footnotes
Funding: Funding was provided by the Health Effects Institute and grant F32ES015432 from the US National Institute of Environmental Health Sciences. The funding sources had no role in the study design, analysis, presentation or interpretation of data. The content is solely the responsibility of the authors and does not necessarily represent the views of the funding sources.
Competing interests: SB has received funding from Transport for London for ongoing research.
Ethics approval: Ethical approval was not required for this research.