Article Text

Abstract
Objective: To develop a method for estimating fibre size-specific exposures to airborne asbestos dust for use in epidemiological investigations of exposure-response relations.
Methods: Archived membrane filter samples collected at a Charleston, South Carolina asbestos textile plant during 1964–8 were analysed by transmission electron microscopy (TEM) to determine the bivariate diameter/length distribution of airborne fibres by plant operation. The protocol used for these analyses was based on the direct transfer method published by the International Standards Organization (ISO), modified to enhance fibre size determinations, especially for long fibres. Procedures to adjust standard phase contrast microscopy (PCM) fibre concentration measures using the TEM data in a job-exposure matrix (JEM) were developed in order to estimate fibre size-specific exposures.
Results: A total of 84 airborne dust samples were used to measure diameter and length for over 18 000 fibres or fibre bundles. Consistent with previous studies, a small proportion of airborne fibres were longer than >5 μm in length, but the proportion varied considerably by plant operation (range 6.9% to 20.8%). The bivariate diameter/length distribution of airborne fibres was expressed as the proportion of fibres in 20 size-specific cells and this distribution demonstrated a relatively high degree of variability by plant operation. PCM adjustment factors also varied substantially across plant operations.
Conclusions: These data provide new information concerning the airborne fibre characteristics for a previously studied textile facility. The TEM data demonstrate that the vast majority of airborne fibres inhaled by the workers were shorter than 5 μm in length, and thus not included in the PCM-based fibre counts. The TEM data were used to develop a new fibre size-specific JEM for use in an updated cohort mortality study to investigate the role of fibre dimension in the development of asbestos-related lung diseases.
Statistics from Altmetric.com
While a causal association between exposure to asbestos and the risk of lung cancer, mesothelioma, and non-malignant pulmonary diseases in humans has been well established, the relative contribution of airborne fibres of different dimensions is not well defined. Asbestos fibre inhalation, implantation, and injection studies in experimental animals have generally shown long, thin fibres to be more biologically active in the production of lung cancers and mesotheliomas.1–3 Additionally, some data suggest that the risk for lung cancer, mesothelioma, and asbestosis may vary by both fibre type and fibre dimensions.4
Epidemiological studies have not directly addressed fibre size-specific risks because of limited data that characterise the joint diameter and length distributions of asbestos aerosols. Exposure concentrations determined by phase contrast microscopy (PCM) and integrated over a working lifetime are strong predictors of asbestosis and cancer risks within a given industry; however, differences in risks between industry sectors (for example, chrysotile mining versus textiles) have not been reconciled by the PCM method. The PCM method measures only a limited portion of the aerosol (that is, fibres >5 μm in length) and has a limit of resolution of approximately 0.25 μm, which means that many airborne asbestos fibres will not be counted, even though many of those with diameters <0.25 μm are longer than 5 μm (length of fibres counted by PCM). Limitations of the PCM method suggest that a more predictive exposure-response relation might be observed in epidemiological studies using a fibre size-specific exposure metric based on transmission electron microscopy (TEM), which can measure the entire asbestos aerosol.
TEM analyses of airborne chrysotile fibres in different industries have shown reasonably large differences in fibre length and diameter distributions.5 Airborne chrysotile fibres in mining and milling demonstrate a significantly greater percentage of fibres (95–98%) less than 5 μm in length compared to data from textile facilities using chrysotile.5–7 TEM data also show considerable variation in fibre size distributions among different operations within the same industry.5 7 8 Data for asbestos textile plants using chrysotile have shown initial operations such as fibre preparation and carding to produce airborne fibres with a greater proportion of the fibres >0.25 μm in diameter and >5 μm length compared to subsequent operations such as spinning, twisting and weaving.5 This is expected as fibre preparation and carding remove much of the debris and shorter fibres and subsequent operations impart energy to open fibre bundles. Consistent with variability in fibre size by textile operation, our previous analyses have suggested differences in lung cancer risks by textile department after controlling for cumulative exposures by PCM.9
The current research aims to expand upon our previous studies by using TEM data to develop a fibre size-specific job-exposure matrix (JEM) for use in epidemiological studies of Charleston, South Carolina, asbestos textile workers.9 10 Samples for these TEM studies were obtained from an archive of membrane filter samples collected in these plants by the US Public Health Service (USPHS).
REVIEW OF ALTERNATIVE EXPOSURE METRICS
The impinger method for measurement of airborne dusts, including asbestos, was developed by the USPHS in the 1920s and measured all particles less than 10 μm in diameter (that is, those considered respirable) by low power, optical microscopy and expressed dust concentrations as millions of particles per cubic foot of air (mppcf).11 In the 1960s the impinger began to be replaced by the membrane filter sampling method with counts of fibres longer than 5 μm being done by PCM and with fibre concentrations being reported as fibres longer than 5 μm per cubic centimetre of air (fibres/cm3).12–15 The PCM method is considered a better predictor of disease risks compared to concentrations of all airborne particles by the impinger method15 and serves as the basis for current risk assessments for occupational asbestos exposures, as well as for sampling for compliance with US occupational and environment regulations.
Animal data strongly suggest that longer, thinner asbestos fibres may be more biologically active and that risks may vary by disease end point.16–19 Lippmann19 reviewed published data and concluded that asbestosis is most closely related to the surface area of retained fibres that are between >0.15 μm and <2.0 μm in diameter, that mesothelioma is most closely associated with numbers of fibres longer than approximately 5 μm and thinner than approximately 0.1 μm, and that lung cancer is most closely associated with fibres longer than approximately 10 μm and thicker than approximately 0.15 μm. Berman et al18 and Berman and Crump20 reanalysed data from inhalation studies in AF/HAN rats and concluded that structures most predictive of lung tumour risk appeared to be long (>5 μm) thin (<0.3 μm) fibres and bundles, with a possible contribution by very long (>40 μm) and very thick (>5 μm) complex clusters and matrices. However, their statistical model assigned weights to some fibre size categories (that is, >5 μm in diameter) that would have a very low probability of deposition in rat lungs.21 22
Quinn et al23 suggested alternative fibre exposure metrics based on fibre size and composition for man-made vitreous fibres. These indices were collectively called the “hypothetically active fibre (HAF) indices”. These authors calculated various HAF indices based on biologically important fibre sizes suggested by Pott et al,16 Stanton and Wrench17 and Lippmann,19 as well as their own and compared these to PCM fibre measures. No consistent relation among these measures was observed and the index of fibres hypothesised to be relevant for a study of lung cancer risk was not found to equate to the standard fibre PCM concentration measures. Quinn et al developed and applied a method to adjust standard fibre concentration measures to the biologically relevant HAF concentrations using proportions from bivariate diameter/length fibre size distributions.23 24
METHODS
TEM size-specific JEM conceptual model
Dement et al8 25 26 developed a JEM for a Charleston, South Carolina asbestos textile plant based on fibre concentrations determined by PCM. Airborne dust samples (n = 5952) covering the period 1930–75, were used to fit parameters of statistical models to predict mean PCM concentrations by department, job and calendar time period. For purposes of model development, the plant was divided into 10 exposure zones that corresponded closely to textile departments (for example, fibre preparation, carding, spinning, twisting, weaving, finishing, etc) based on the similarity of processes and characteristics of exposures. Within each exposure zone jobs were further divided into four or more uniform job categories (UJC) in order to capture differences in PCM concentrations by job tasks within zones. Changes in concentrations by calendar time were accounted for in the models by inclusion of covariates for changes in processes or engineering controls based on plant records. The resulting JEM demonstrated substantial differences in airborne fibre concentrations by exposure zone, job and calendar time period and has been used extensively in previous risk assessments in this plant.8–10 An example of the JEM for mean PCM concentrations and confidence intervals by job category and time period for zone 1 (fibre preparation) is shown in table 1.26
The airborne fibre size-specific JEM developed for the current project was based on the previous JEM published by Dement et al8 26 for the Charleston plant and incorporated the same exposure zones and UJCs. Our fibre size-specific JEM is based on the “adjustment factor” method proposed by Quinn et al,23 which “adjusts” standard fibre concentration measures determined by PCM to the biologically relevant size-specific fibre concentrations using proportions from bivariate fibre size distributions. Within a given plant exposure zone, TEM airborne fibre diameter/length distributions for UJCs within the zone were similar; therefore, TEM samples within a given exposure zone were combined to arrive at an overall estimate of the zone-specific bivariate diameter/length distribution.8 9 26 The decision to combine samples within zones was also based on the limited number of archived samples by job within zones and available resources for TEM analyses.
Based on the adjustment factor method for PCM concentrations developed by Quinn et al,23 PCM adjustment factors by fibre diameter and length category can be expressed as follows for a given plant exposure zone:
PCM factorijz = [(Fijz)/(FPCMi)]
where:
PCM factorijz = PCM to TEM conversion factor for exposure zone “i”, fibre diameter category “j” and length category “z”. This factor, when multiplied by the estimated mean PCM concentration for a given zone, job and time,26 results in a fibre size-specific exposure estimate;
FPCMi = proportion of all airborne fibres measured by TEM that are actually counted by PCM (>0.25 μm in diameter and >5.0 μm in length) for exposure zone “i”;
Fijz = proportion of all TEM fibres in exposure zone “i” that fall into fibre diameter category “j”, and length category “z”.
The proportion of all airborne fibres of a specific size determined by TEM (Fijz) was estimated from the final TEM bivariate diameter/length matrix for each exposure zone. The model parameter FPCMi was calculated from the diameter/length matrix using estimates of the proportion of all airborne fibres measured by TEM that are actually counted by PCM (>0.25 μm in diameter and >5.0 μm in length). In order to derive a summary exposure metric such as the one proposed by Stanton17 (that is, fibres <0.25 μm in diameter and >8.0 μm in length) for a given exposure zone “i”, the PCM factors for the desired TEM size categories are multiplied by the estimated PCM concentrations and summed.8 26 Similar procedures can be used to derive exposures metrics based on multiple combinations of TEM fibre length and diameter, the size-specific JEM thus allows considerable flexibility in defining fibres size categories of interest.
Membrane filter samples
In order to develop the fibre size-specific JEM, TEM data were used to define the bivariate diameter/length distribution of fibres using archived air samples. Historical membrane filter dust samples collected by the USPHS during industrial hygiene studies of the Charleston plant were used. A total of 203 archived samples were located for the present study. These were collected over the time period 1964–8; therefore, an inherent assumption in development of the JEM is that airborne fibre size characteristics have remained substantially the same over a study period covering the late 1930s through to the end of asbestos textile production in approximately 1977. This assumption is reasonable since production methods and equipment remained essentially unchanged over this time and engineering controls for asbestos dust were first installed in the 1930s.8 26 Additionally, the major chrysotile asbestos fibre source (Canada) remained unchanged during this period. In contrast, the airborne fibre concentrations were shown to vary by calendar time, and workers’ PCM-based exposure estimates were based on several thousand industrial hygiene samples collected from 1930s to 1975.26
All archived membrane filter samples were matched to their original field data sheets in order to assign samples to the same exposure zones and uniform job categories developed by Dement et al.8 26 Based on available resources and available archived samples, a stratified random sample of 86 membrane filters was selected with sampling strata defined by the 10 exposure zones. When only a few archived samples were available for a specific exposure zone, all usable samples for that zone were used for TEM analysis.
TEM methods
Published TEM analysis and structure counting protocols were reviewed in order to select the protocol most suitable for the current study.27–30 Criteria established for evaluation and selection of methods were as follows:
Preservation of airborne size characteristics: The method must preserve the characteristics of the asbestos fibre aerosol present in the facility sampled and deposited on the membrane filter. Direct transfer preparation methods better preserve the original airborne fibre characteristics.27
Enumeration of fibres and structures by morphology: The method should allow airborne fibres to be characterised as to individual fibres, fibre bundles and more complex entities, such as matrices and clusters.
Previous use in risk assessments: Use of the TEM method for human or animal study risk assessments was considered desirable but not a required criterion.
Published TEM methods differ in the procedures incorporated for sample preparation and the manner in which asbestos structures are counted. The ISO direct transfer method represents progressive improvements in the earlier TEM methods for enumerating asbestos structures and their morphology. Moreover, this method has been used in fibre size-specific risk assessments of animal bioassay data.18 The ISO method thus represented the best choice for the current investigations based on the criteria outlined above.
Our analyses used the ISO allowed minimum aspect ratio of 3:1 to define fibres and structures for consistency with PCM methods. Several modifications to and enhancements of the ISO method were made for this study.31 These changes were needed to accommodate use of historical samples, with relatively high dust loadings, and to enhance estimation of the bivariate diameter/length distribution of the airborne aerosol, especially for longer fibres (which represent a relatively small proportion of the fibre size distribution). These modifications and enhancements were as follows:
In order to accommodate sizing of the large number of fibres needed for this study, diameter and length were recorded into discrete categories (rather than exact measurements of each fibre dimension) to increase the efficiency and reduce the cost of analyses. Fibre length was recorded into category with width increments of 0.5 μm for the count of all structures (20 000× magnification) and in 1 μm increments for the >5 μm and >15 μm structure counts (10 000× magnification). Fibre diameter was recorded in size categories with increments of 0.25 μm for all sample strata. These categories were later collapsed into larger categories for the JEM.
The ISO stopping rule for dispersed matrices and dispersed clusters was not used and all visible fibres and fibre bundles within these structures were enumerated and sized. This enhancement allowed us to better define the true diameter/length distribution.
For each sample, three separate analyses were performed, based on fibre length, in order to increase the count of the less prevalent longer fibres and therefore achieve greater statistical precision of the bivariate size distributions. These analyses consisted of counting all structures, structures >5 μm and structures >15 μm. The stopping rules (that is, minimum number of primary structures to be sized and recorded) were:
all structures: 50
structures longer than 5 μm: 80
structures longer than 15 μm: 50.
A primary structure is a fibre or connected group of fibres (with or without other particles) that is a separate entity in the TEM image.27 In developing this JEM, the individual fibre or fibre bundle data were used, whether these were present as components of complex primary structures or as individual primary structures.18 For each counting stratum, the number of grid openings used to obtain the desired structure count was recorded. The TEM data for each sample were recorded in Microsoft Excel worksheets based on the ISO method27 but designed for this study and imported into SAS Version 8.232 for statistical analyses.
TEM data reduction and analyses
TEM samples within a given exposure zone were combined to arrive at an overall estimate of the zone-specific bivariate diameter/length distribution. Samples within each zone were combined based on pooling the fibres counted within TEM counting strata (all structures, structures >5 μm and structures >15 μm). TEM fibres with a minimum aspect ratio of 3 to 1 were reduced to a matrix containing 20 categories based on diameter and length, including fibre diameters of <0.25 μm, 0.25–1 μm, 1–3 μm and >3 μm and fibre lengths of <1.5 μm, 1.5–3 μm, 3–5 μm, 5–15 μm, 15–40 μm and >40 μm. The smallest diameter category measured by TEM varied slightly owing to small fluctuations in TEM calibration, with a nominal value of 0.25 μm. These size categories were selected a priori based on consideration of both biological and measurement/analysis factors, including critical sizes for PCM (0.25 μm width, 5 μm length), fibre deposition in human lungs (∼3 μm width),33 34 lung clearance (∼15 μm),35 previous risk analysis (40 μm),18 and additional cut-points to divide the width and length distributions into reasonably populated cells, given the distribution known to be skewed toward shorter fibres based on previous studies (<1 μm width; <1.5 μm and 3 μm lengths). However, data analyses methods developed for this study allow researchers to specify different choices for diameter and length depending on the research question.
Within each TEM counting stratum (all structures, structures >5 μm, and structures >15 μm), the fibre counts were combined and the proportional distribution by diameter/length category calculated directly as a simple proportion. The bivariate diameter/length proportion was calculated as the sum of the cell counts divided by the total number of fibres counted within the TEM counting stratum. The all structure stratum thus provides an estimate of the overall bivariate diameter/length distribution whereas proportions calculated from the >5 μm, and >15 μm strata can be viewed as conditional or truncated distributions, conditioned on first meeting the minimum fibre length to be counted. Overall bivariate diameter/length cell proportions were calculated using the expression below. These calculations were used for all fibre diameters within a given strata based on products of conditional probabilities derived from the pooled data for each exposure zone.
For fibres ⩽5 μm in length:
Cell proportion = cell proportion calculated using the pooled all-structures TEM counting stratum.
For fibres >5 μm in length and up to 15 μm in length:
Cell proportion = (proportion >5 μm in length calculated from the pooled all-structures TEM counting stratum) × (cell proportion >5 μm but <15 μm in length calculated from the pooled >5 μm TEM counting stratum).
For fibres >15 μm in length:
Cell proportion = (proportion >5 μm in length calculated from the pooled all structures TEM counting stratum) × (proportion >15 μm in length calculated from the pooled >5 μm TEM counting stratum) × (cell proportion calculated from the pooled >15 μm TEM counting stratum).
This method efficiently used each successive TEM counting stratum to better estimate the bivariate proportion of longer fibres without restrictive distributional assumptions. Bootstrapping was used to estimate statistical variability for the proportion of airborne fibres in each diameter/length category and the PCM adjustment factor (Fi/FPCMi) for each cell. For each pooled stratum (all structures, structures >5 μm and structures >15 μm) we randomly selected structures from each TEM counting stratum, with replacement, with the stratum sampling frequency being equal to the pooled structure count for the exposure zone. This re-sampling procedure was replicated 500 times for each zone. For each replicate, an estimate of the proportion of all TEM structures countable by PCM (>0.25 μm diameter and >5 μm in length), the mean proportion of fibres in each diameter/length category of the matrix, and the size-specific PCM adjustment factor (Fijz/FPCMi) were calculated. Using the data from each of the 500 replications, the mean proportion of fibres and the PCM adjustment factor (Fijz/FPCMi) were calculated for each diameter/length category of the matrix as well as lower 5% and upper 95% confidence intervals using the bootstrap percentile method.36 An exposure metric based on approximations of fibre surface areas was developed in a like manner. For this metric, we assumed that fibres and fibre bundles could be considered right cylinders and calculated the surface area (μm2) for each structure counted. For each of the 500 replications described above, we calculated the mean surface area for each diameter/length category and a PCM to surface area adjustment factor. The distribution of the parameter estimates from the 500 replications was used to estimate the standard deviations of the surface area factor by diameter/length category and to construct lower 5% and upper 95% confidence intervals. The PCM surface area adjustment factor represents a multiplier to be used with PCM concentrations to express concentrations in terms of surface area (μm2/cm3). This should be viewed as a relative rather than absolute surface area measure, useful for internal comparisons within this cohort, because of the simplifying assumption that fibres were right cylinders.
Analyses presented in this report are based on fibres and fibre bundles identified as individual structures or as components of larger structures. Precise measurement of chrysotile fibre diameter is challenging, especially for fibres bundles with varying diameter along their length and for fibres identified as components of more complex matrices. However, our quality control analyses demonstrated good reproducibility with regard to assignment of these structures into the diameter and length categories used for this study.
RESULTS
Two of the 86 samples were determined not to be usable because of extremely low fibre densities, resulting in very few structures being counted and sized based on stopping rules for the TEM method, so TEM data were obtained from 84 filters. The distribution of samples included in the study by exposure zones and associated plant departments is shown in table 2. The number of samples available for TEM analyses ranged from 3 to 11 by exposure zone. A total of 18 824 fibres or fibre bundles were enumerated and included in the analyses.
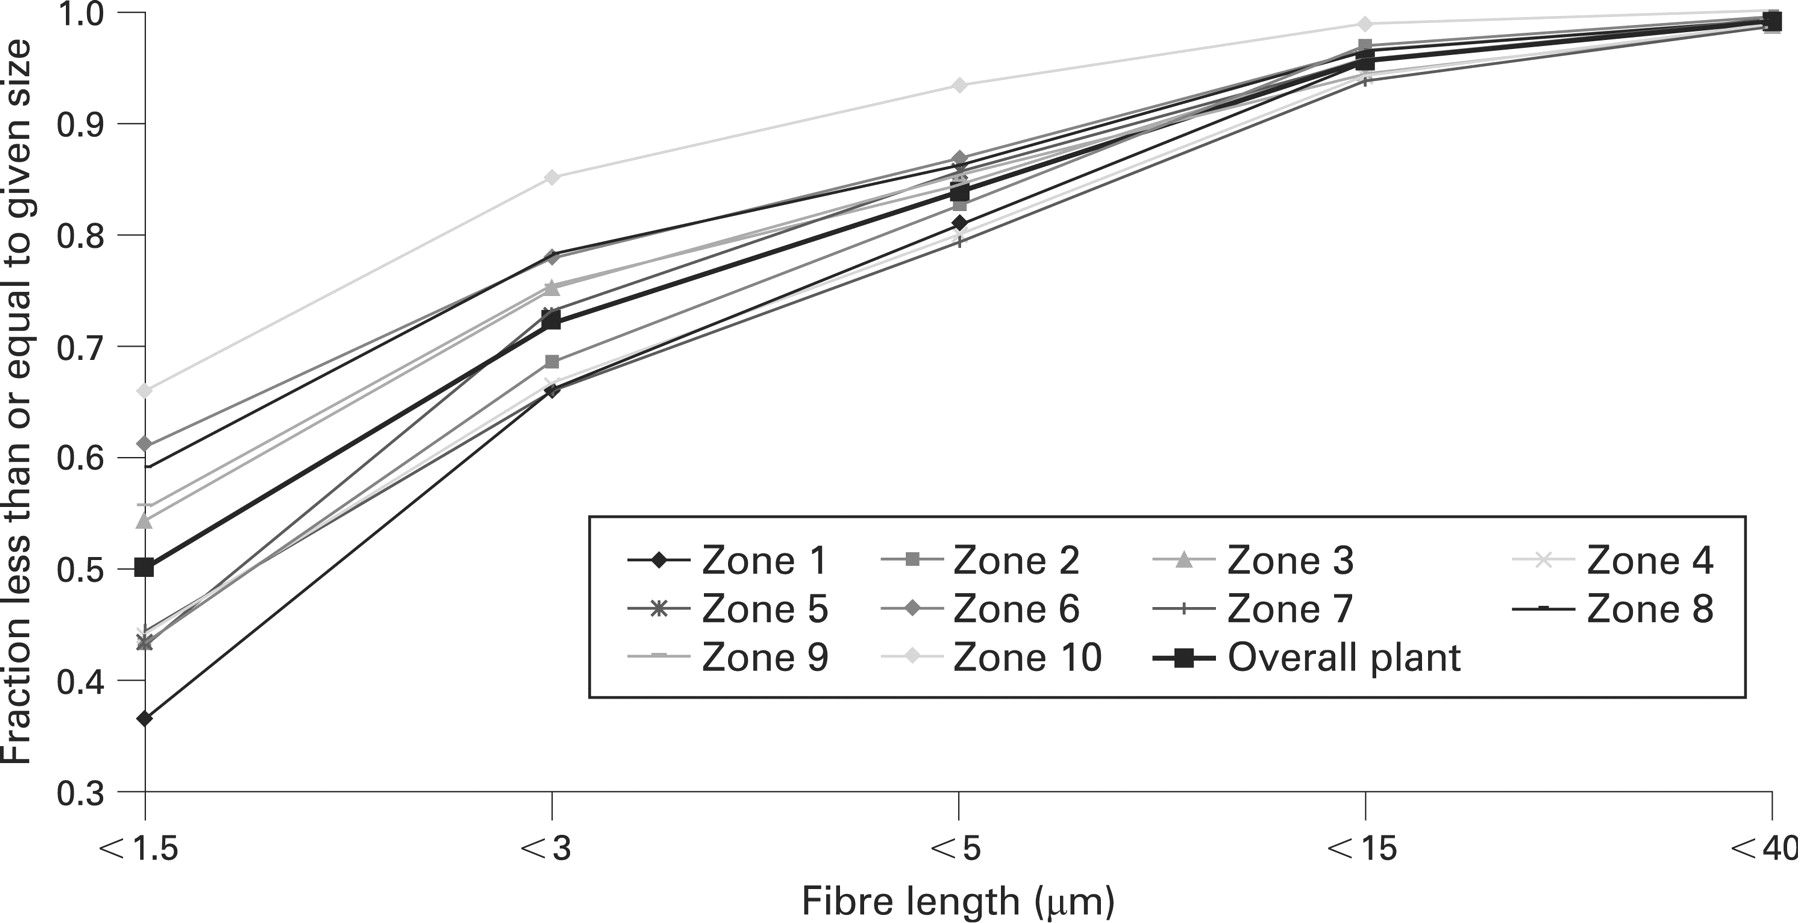
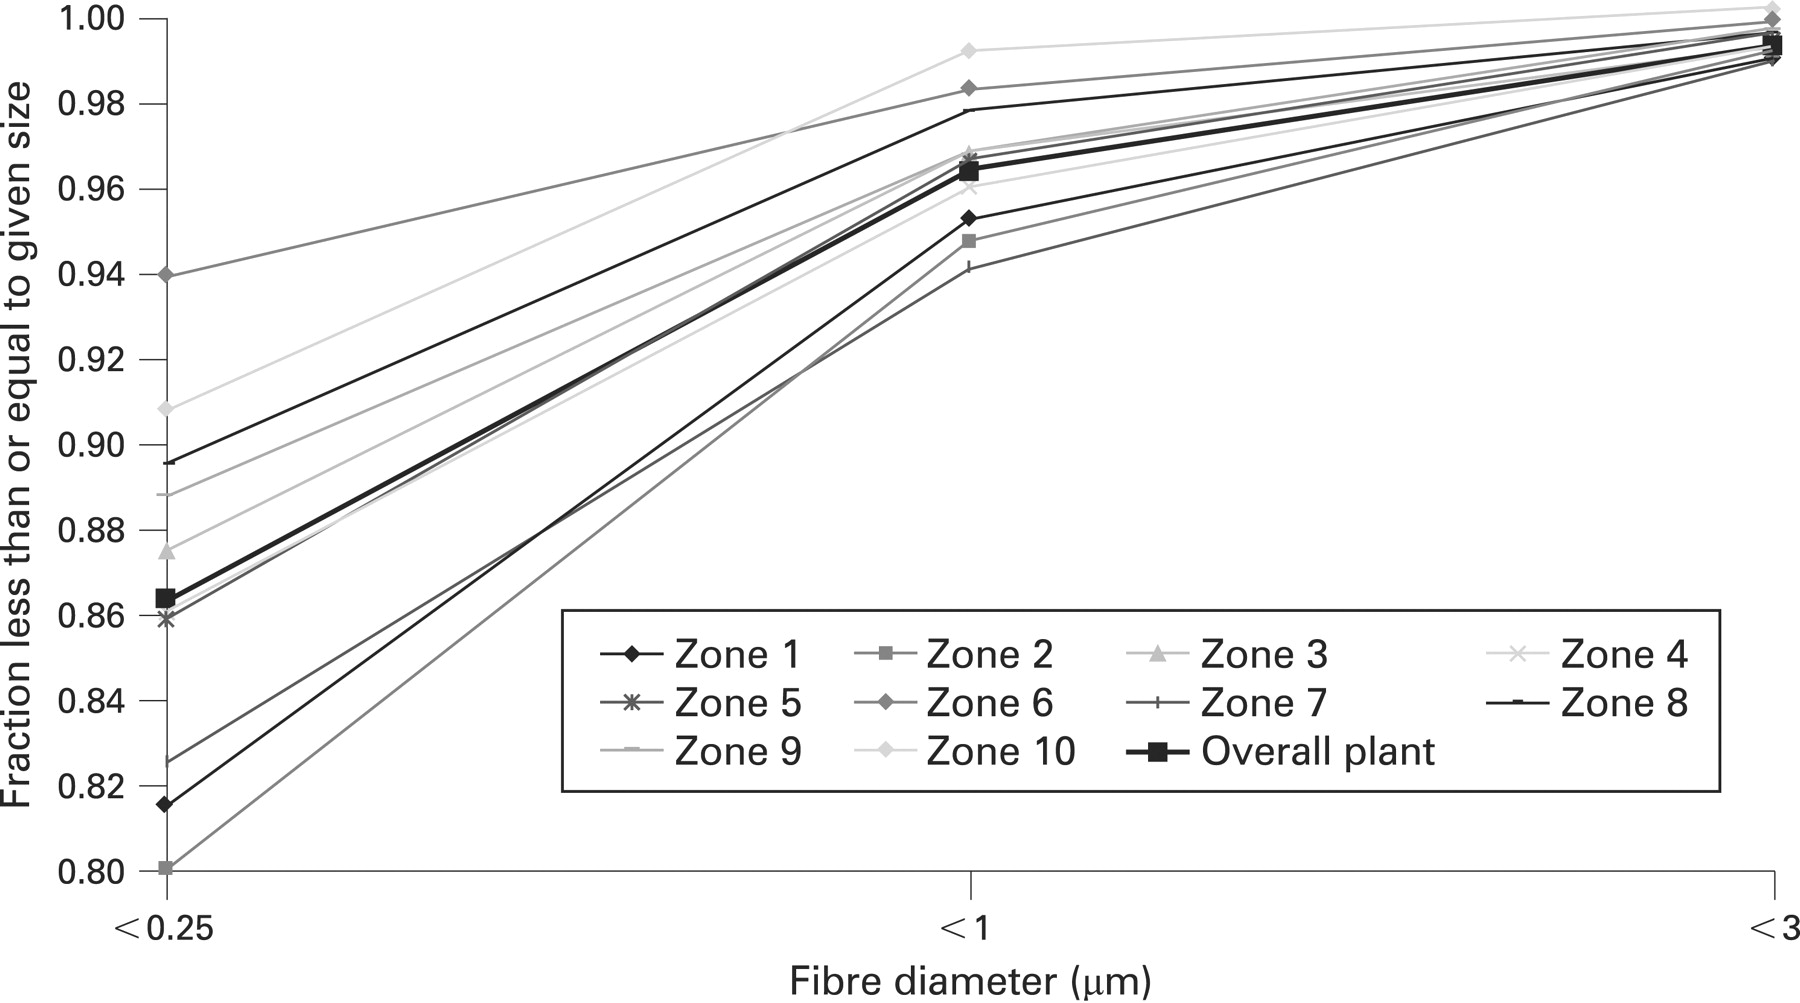
Considerable differences in the fibre length and diameter distributions were observed by exposure zone (figs 1 and 2). The proportion of fibres longer then 5 μm ranged from 6.9% (95% CI = 3.9% to 9.8%) in zone 10 (finishing) to 20.8% (95% CI = 18.7% to 22.8%) in zone 7 (universal winding). The proportion of fibres <0.25 μm in diameter but with lengths >5 μm, and not generally detectable by PCM, was found to range from 4.5% (95% CI = 6.7% to 12.8%) in zone 10 (finishing) to 11.4% (95% CI = 10.1% to 12.5%) in zone 4 (mule spinning). In most plant exposure zones, only a small proportion of airborne fibres were longer than 15 μm, with a range of 1.7% (95% CI = 0.8% to 2.7%) in finishing operations to 6.2% (95% CI = 5.3% to 7.2%) in universal winding.
The overall bivariate fibre diameter/length distribution for the Charleston plant is given in table 3. This table provides the proportion of all airborne fibres within each cell of the diameter/length matrix, the PCM adjustment factor (Fijz/FPCMi) and statistical confidence intervals for these parameters. These same estimates were generated for each exposure zone (not shown).
A comparison of zone-specific PCM adjustment factors by diameter and length category is presented in table 4. While many of the bivariate diameter/length cells show similar PCM adjustment factors for the different zones, some potentially important differences are noted. Some zones demonstrated a greater preponderance of short, thin fibres whereas others demonstrated longer, thinner fibres (table 4), which could substantially alter cumulative fibre exposure estimates for workers included in the mortality analyses.
Table 5 provides an example using the PCM adjustment factors in table 4 to generate estimated mean exposures to long, thin fibres (<0.25 μm in diameter and >5 μm in length and not counted by PCM). This example is for UJC-A (general area personnel) in calendar year 1965 by exposure zone. The PCM adjustment factors for fibres <0.25 μm in diameter and >5 μm in length (table 4) were multiplied by the mean PCM concentrations in each exposure zone26 to estimate the TEM concentration of long, thin fibres. This example shows that PCM adjustment factors for long, thin fibres vary substantially by textile department, with smaller factors for initial textile operations (for example, fibre preparation and carding). Should exposures to these longer and thinner fibres be more predictive of disease risks, table 5 demonstrates the potential for considerable exposure misclassification based on PCM exposure estimates.
In addition to these estimates of fibre number concentrations, surface area conversion factors (not shown) were used to derive approximate surface area exposure measurements, expressed as μm2/cm3, based on the same fibre size categories shown in tables 3 and 4, for comparison of exposure metrics in an epidemiological study of this textile cohort.37
DISCUSSION
Results of current TEM analyses are consistent with previous TEM studies of samples from this plant,8 9 demonstrating a preponderance of short fibres in airborne aerosols. The TEM fibre size data, combined with the previous PCM fibre concentration estimates by zone, job and time period, provide the ability to define new metrics based on single bivariate size categories or any combination of size categories. The new JEM provides unique data for the study of cancer and non-cancer end points among the Charleston cohort and for comparisons with other plants and facilities. Strengths of the data include use of multiple TEM samples (range 3–11) for each exposure zone with additional efforts in the TEM analyses to better capture the entire fibre size spectrum, including fibres as thin as <0.25 μm in diameter and as long as >40 μm. A limitation is the unavailability of samples and resources to further study differences by job groups within each zone. However, based on our a priori knowledge of plant processes, jobs and fibre characteristics within each zone, the assumption that jobs within a given exposure zone share similar airborne fibre size characteristics appears justified.8 9 26
Given that the samples for TEM analyses do not cover the entire period for which PCM estimates are available, only a single point estimate for the PCM adjustment factors could be developed for each exposure zone. The implicit assumption is stability of the airborne fibre size distribution over calendar time within each exposure zone (while changes in the airborne fibre concentration over time in each exposure zone were based on industrial hygiene sampling data over time). The process of making asbestos textiles at this plant changed relatively little over the study period, both with regard to the sources of asbestos fibre used and processing equipment. Additionally, engineering controls such as local exhaust ventilation were implemented in this plant on a large scale starting before 194038; therefore, potential effects of ventilation on airborne fibre size characteristics should be minimised. Quinn et al24 demonstrated that bulk material factors for fibrous glass are important determinants of the airborne fibre size distribution, supporting the assumption that similar production processes applied to similar bulk fibrous material are likely to produce similar airborne fibre size distributions. Our assumption of stability of airborne fibre characteristics within a given plant operation over calendar time therefore seems reasonable and appropriate; however, we cannot completely rule out some changes in airborne fibre characteristics over time.
Our results have significant implications for epidemiological studies that seek to estimate fibre exposure-response relations. While PCM exposure estimates provide data useful for risk assessments, the PCM method is relatively insensitive to differences in airborne fibre characteristics across and within industries and does not allow for analyses of fibre size-specific risks. Our aim is to use methods developed by this study in conjunction with ongoing epidemiological studies to better assess risks by fibre size for chrysotile.37
CONCLUSION
While animal studies have suggested that longer and thinner fibres are more biologically active in the production of disease, few human data exist to support or refute these findings. Occupational cohorts are exposed to a wide range of airborne asbestos fibres, with the vast majority being shorter than 5 μm in length. While asbestos textile operations typically used grades of chrysotile with longer fibre lengths, the resulting aerosol to which workers were exposed was primarily composed of short fibres. The fibre size distributions and the PCM adjustment factors were shown to vary considerably across plant operations. The methods used in this study for developing the fibre-size specific JEM are applicable in other situations where TEM data or archived samples may be available to generate bivariate size distributions and to study the role of fibre dimension in predicting asbestos-related lung diseases.
Acknowledgments
We express our appreciation to Kenneth Wallingford of NIOSH for his invaluable assistance in locating the archived filters and the field sample data recording sheets. We thank Anna Marie Ristich of DataChem Laboratories for the long and laborious hours spent doing the TEM analyses and we gratefully acknowledge Jim Bena (formerly at NIOSH) for his assistance in developing the sample selection strategy for the TEM analyses.
REFERENCES
Footnotes
Funding: The National Institute for Occupational Safety and Health (NIOSH) supported this research (purchase order number 0000158283 and grant number R01 OH007803).
Competing interests: None.