Article Text

Abstract
Objectives: As exposures to airborne particulates in the European rubber industry might still be causing genotoxic risks, it is important to assess trends in levels of inhalable dust and its cyclohexane soluble fraction (CSF) between the 1970s and 2003.
Methods: 13 380 inhalable and 816 respirable dust and 5657 CSF measurements, collected within the framework of the European Union Concerted Action EXASRUB, were analysed. Hierarchical mixed effects models were applied to assess exposure trends, taking into account between-factory, between-worker/location and day-to-day variances.
Results: Geometric mean levels of inhalable dust and CSF exposure changed by −4 (range −5.8 to +2.9) and −3 (range −8.6 to 0) per year, respectively. Significant reductions in inhalable dust concentrations were found in all countries for handling of crude materials and mixing and milling (−7 to −4 per year), as well as for miscellaneous workers (−11 to −5 per year), while significant CSF exposure reductions were found in curing (−8.6 per year) and maintenance and engineering departments (−5.4 per year).
Conclusion: These analyses suggest that on average exposure levels of inhalable dust and its CSF in the European rubber manufacturing industry have steadily declined. Most likely genotoxic risks have also lessened over time since exposure levels have decreased and the most toxic chemicals have been replaced. In addition to differences in exposure reductions and levels among various stages of the production process, large differences across countries were noted. These patterns should be taken into account in retrospective assessment of exposure for epidemiological studies assessing cancer risk in the rubber industry.
Statistics from Altmetric.com
The International Agency for Research on Cancer (IARC) reviewed the evidence for carcinogenic risk in the rubber manufacturing industry in 1982.1 The working group concluded that there was sufficient evidence for a causal association between exposures in the rubber industry and urinary bladder cancer and leukaemia, and excess occurrence of lung and stomach cancers. Overall, the rubber manufacturing industry was classified as “entailing exposures that are carcinogenic to humans (Group 1)”.2 Kogevinas et al3 reviewed more recent epidemiological studies published after the 1982 IARC monograph. They supported the original findings, although the magnitude of the observed risks varied considerably between studies. An excess risk of laryngeal cancer was found to be consistent between studies, which was not seen in the data available during the initial evaluation by IARC.
To decrease the risk of occupational cancers, exposure control measures, such as the substitution of hazardous chemicals in the production process4 5 and measures to reduce exposure, have been introduced by the industry in the past decades.6–9 Vermeulen et al7 showed a considerable reduction of almost 50 in inhalable dust concentrations over a 9-year period in the Dutch rubber industry (1988–1997).
Kogevinas et al3 speculated that preventive measures taken in the rubber industry might have decreased cancer risks, but, since only a few epidemiological studies with limited statistical power have focused on the modern rubber industry, any decrease in cancer risks could not yet be demonstrated. Due to the long latency time between carcinogen exposure and the manifestation of solid tumours for instance, the observed excess risk for urinary bladder cancer may still be related to exposure conditions encountered in the past, especially when β-naphthylamine was still used in the production process,5 and not to exposures experienced today.10 Conversely, any (remaining) cancer risks due to contemporary exposure would not be observed until a suitable latency period had elapsed.
The mutagenic activity of airborne particles generated in rubber manufacture was demonstrated in the late 1980s,11 and recent biomarker studies have consistently detected mutagenic activity in airborne particles, fume and dermal contamination samples in the industry, and in the urine of exposed rubber workers.12–14 Also, elevated levels of DNA adducts were found in the exfoliated bladder cells of current rubber industry workers.15 These studies suggest the possibility of genotoxic risks in the modern rubber industry.
The analyses presented in this paper describe the time trends of personal occupational exposure to inhalable dust and its cyclohexane soluble fraction (CSF)16 in the rubber industry between the 1970s and 2003 in the Netherlands, Germany, the UK, Poland and Sweden. Exposure data were collected within the framework of a European Union Concerted Action.17
METHODS
Source of data
Measurements of inhalable and respirable dust and its CSF from the EU-EXASRUB database17 were used in these analyses. This database has been described in detail by de Vocht et al18 and an overview on inhalable and respirable dust and its CSF is presented in table 1.
In summary, the EU-EXASRUB database included 13 380 inhalable and 816 respirable (rubber) dust measurements collected between 1969 and 2003, and 5657 CSF measurements collected between 1977 and 2003. The rationale for including respirable dust measurements was to increase the number of available measurements in specific departments where predominantly respirable, instead of inhalable, dust measurements were collected. Individuals or locations with repeated sampling were identified whenever possible. Measurements were collected in each country by research centres from available exposure surveys carried out either by their own institutes, occupational health services, or industry- or government-based organisations, and thus were collected for different purposes (ie, research, evaluation of controls, compliance testing, a concern, or a follow-up of a complaint). As such, these surveys included measurements collected in a representative sample of all rubber manufacturing companies in the participating countries. For each survey, the limit of detection (LOD) was established and reported concentrations lower than survey-specific LODs (range 0.10–0.50 mg/m3 for inhalable dust) were replaced by LOD/√2.19 When information about the survey-specific LOD was lacking (71 of surveys), a default LOD of 0.10 mg/m3 was used because this was the most commonly (33–66 of surveys with reported LOD per country) reported LOD. In total, 763 inhalable dust measurements (5.4 of the data) and 501 CSF measurements (8.9) were non-detectable.
Departments in the rubber manufacturing industry were classified according to the system developed by the British Rubber Manufacturer’ Association (BRMA), which divides all tasks in the production of rubber products into clusters grouped into 11 departments (see online supplementary data). Given the large heterogeneity between countries and surveys in location and the time period of the measurements, departments were further grouped into crude materials, pre-treating, curing, post-treating, engineering and maintenance, and miscellaneous departments, based on a priori consensus assumptions among members of the EXASRUB consortium on similarities in processes. Additionally, BRMA-coded processes were used to a priori define high-exposure processes within certain departments. Hence, this subdivision is different for exposures to rubber dust compared to CSF.
Statistical analyses
The database was split (randomly, weighted by survey) into a dataset used to create the statistical exposure models (80 of the data) and into a dataset to validate these models (20 of the data). After the most appropriate statistical model was selected and bias and precision of the models had been assessed, both datasets were combined to derive final estimates of model parameters.
Three-level hierarchical mixed models with random intercepts at each level20 were used. In this approach, the between-factory, between-worker/location and day-to-day variances of the loge-transformed measured concentrations of inhalable dust or its CSF were estimated as random effects. In this model, day-to-day variance can be regarded as a measure of the variability of different measurements within individual employees within a year, while time trends deal with the overall trend over years within a specific country. None of the measurement series, however, were longer than a few weeks. Several structures of the covariance matrix were tested using Akaike’s information criteria (AIC). An unstructured covariance matrix for the random effects and a compound symmetric matrix for total variance were used. An empty model,20 or intercept-only model without any explanatory variables, was calculated (model 1) to estimate baseline variance components using the restricted maximum likelihood method (REML) algorithm.
Variables (table 2) were added to the empty model in a forward modelling procedure using maximum likelihood (ML) estimation. After obtaining the most appropriate multivariate model, the model parameter estimates were calculated using REML algorithms. Statistically significant explanatory variables (p<0.05) were kept in the multivariate model starting with the variables that showed the largest decrease in the AIC in univariate analyses. In addition, fixed effect adjustments for respirable dust were estimated from the data in all statistical analyses. A fixed adjustment was also explicitly estimated from the data for the average difference in concentrations between measurements obtained in the UK from surveys performed by the BRMA and from surveys performed by the Health & Safety Executive (HSE). Other potential confounding variables were not kept in the multivariate model because they were (a) not statistically significant in the models and (b) did not change the other parameters in the models when included. The variables considered as fixed effects in the final multivariate statistical models are presented in table 2. As shown, best model fit was achieved by modelling different effects in different aggregated departments, which was achieved by adding variables to the final statistical models as interaction terms.
Although different sampling devices and filter types were used in this study, specific adjustments to account for any differences originating from this could not be made in the statistical models because sampling devices and filter types were limited to a particular country or based on only very small sample sizes. Hence, “country” in the models is a proxy for a number of underlying factors, including the sampling device, filter type and analytical method used.
The quality of the model estimators, which can be biased in sparse or unbalanced data, or as a results of patterns in missing data, was assessed by calculating average bias and relative bias, as well as the variability, or precision, of the values.21 22 Average bias of the statistical models was calculated as the mean of the model residuals (in log-space) and precision is defined as the standard deviation of bias. Relative bias is calculated using (ebias−1)×100, equivalent to (predicted−measured)/measured×100.19 Furthermore, explained between-factory, between-worker/location and day-to-day variances were determined.
Using the statistical models presented above, monotonic trends in inhalable dust and CSF levels were estimated for each country and BRMA group. Additional country-specific analyses using monotonic trends as well as 5-year periods to assess the shape of trends in the individual countries in this study showed that (based on −2 residual log-likelihood tests) trends in all countries did not deviate significantly from monotonic trends.
Because measured inhalable dust and CSF concentrations have been loge transformed in these models, average levels of exposure presented in this manuscript refer to geometric means (GM) of individual measurements. Although all collected (personal and stationary) measurements were used to estimate these trends, only the trends for personal inhalable dust and CSF exposure are presented. Furthermore, only trends based on a reasonable number of evenly spread measurements (a priori set to 20 observations) will be used to estimate “overall” trends, which excluded miscellaneous workers in Poland (n 7) and post-treating (n 13) and maintenance and engineering (n 16) workers in Sweden.
RESULTS
The distributions of the personal and stationary measurements, stratified by country, are shown in table 3. Average (geometric) personal exposure to inhalable dust ranged from 0.72 mg/m3 in the Netherlands to 1.97 mg/m3 in Germany, while stationary measurements ranged from 0.25 mg/m3 in the Netherlands to 5.04 mg/m3 in Poland. However, the distributions of personal inhalable dust largely overlapped between countries, while larger differences were found in the distributions of stationary measurements. Personal measurements were on average 2–4 times higher than stationary measurements in all countries, except Poland (65 lower), although the latter was based on a very limited (∼0.01 of all measurements) number of personal measurements (n 75).
CSF was not measured in Germany. Table 3 suggests largely overlapping distributions between countries, although the measured CSF concentrations in the Netherlands were somewhat lower and in Poland higher than those in the UK and Sweden. Average personal exposure levels ranged from 98 μg/m3 in the Netherlands to 1130 μg/m3 in Poland, while average stationary measurements ranged from 45 μg/m3 (the Netherlands) to 446 μg/m3 (Poland). Similarly to the dust measurements, personal CSF measurements were a factor of 2–5 higher than stationary measurements.
Internal validation of statistical models
Average relative bias for the inhalable dust statistical model was 28 in the model building dataset, which was comparable to that in the validation dataset (24). Precision was also comparable for both datasets (ie, 1.00 and 0.99, respectively). Pearson correlations (rP) of predicted with measured concentrations were 0.77 and 0.83 for both datasets, respectively. However, the residuals of the model were marginally correlated with predicted concentrations (rP 0.26 and 0.29) and with year of sampling (rP −0.20 and −0.21), which suggests a residual trend due to other factors not accounted for in the statistical models. Table 4 shows that the variables in the statistical models explained some between-factory (39) as well as temporal (47) variance, but these variables explained only a limited amount (9) of the between-worker/location variance within a factory.
A moderate correlation was found between predicted CSF concentrations and measured concentrations (rP 0.62 and 0.59 in the model building and in the validation dataset). On average, the models underestimated true exposure by 5.5 in the model building dataset and by 4.4 in the validation dataset. Average precisions were also comparable (ie, 1.09 in the model building dataset and 1.13 in the validation dataset). No correlation between the residuals and predicted concentrations was found (rP −0.01 (p 0.54) and rP −0.03 (p 0.22), respectively) and only a marginal correlation was observed with year of sampling (rP −0.09 (p<0.01) and rP −0.06 (p 0.01)).
Similar to the inhalable dust model, the CSF statistical model explained a considerable portion of between-factory variance (50) (table 4). The CSF model however, explained only 23 of the between-worker/location variance within a factory and did not explain temporal variance.
Time trends in inhalable dust concentrations
Time trends since the 1970s in the European rubber industry predicted by the statistical models are presented in table 5. Overall, average personal exposure to inhalable dust between 1970 and 2003 decreased by 4.3 per year (unweighted average).
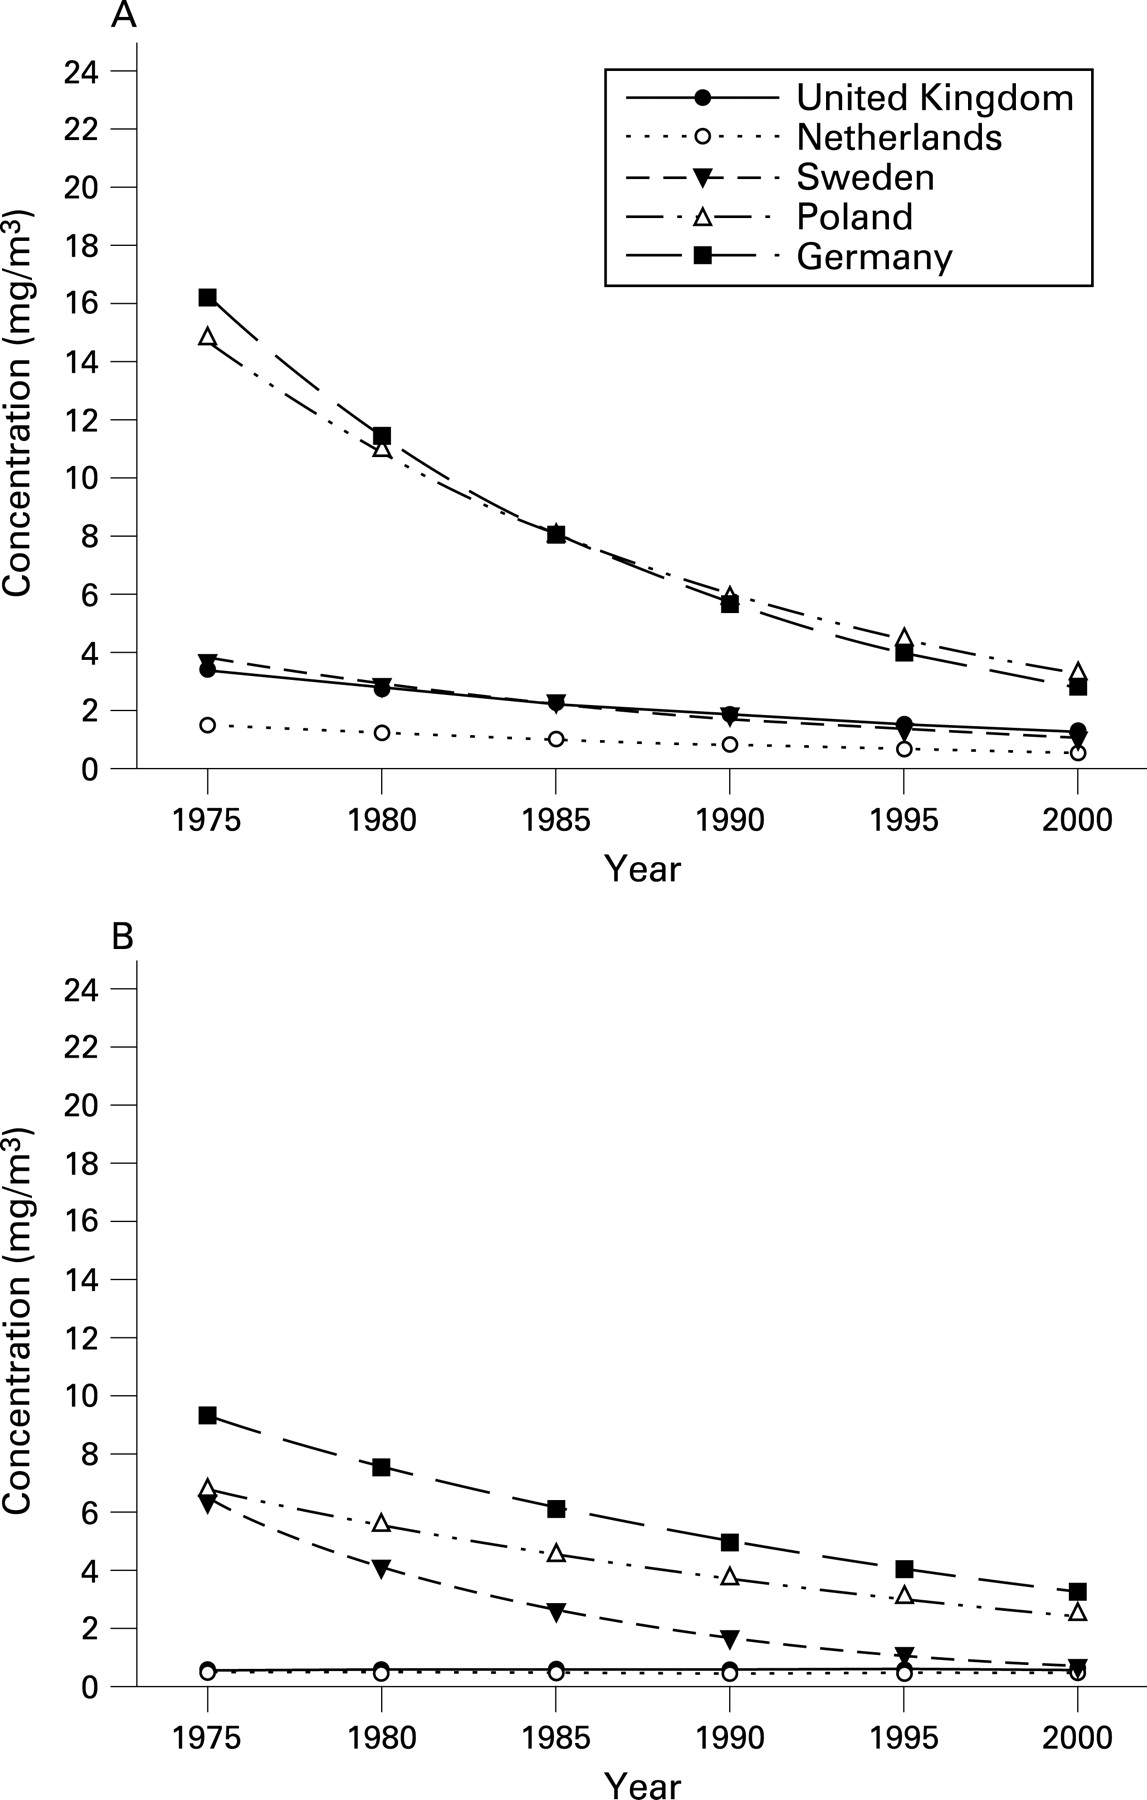
Differences in exposure trends between aggregated departments ranged from −10.9 per year in miscellaneous departments in Sweden to +4.8 per year in the maintenance and engineering departments in Germany. Statistically significant (p<0.05) reductions in exposure were found in all countries in the crude materials and mixing and milling departments (−7 to −4), but also among miscellaneous workers in the general factory environment (−5 to −11). Average (GM) exposures in the compounding and mixing and in the pre-treating departments (specifically defined as rubber process dust6) are shown graphically in fig 1A,B. The highest geometric mean exposures were found in the late 1970s and early 1980s in Germany (∼16 mg/m3) and Poland (∼14 mg/m3), although it should be noted that in Germany relatively few, mainly respirable dust, measurements were available, with a shorter (2 h) sampling time, compared to the other countries. The annual reduction ranging from −5.8 in Poland, followed by Germany (−4.1 per year), Sweden (−4.0 per year), the Netherlands (−3.8 per year) and the UK (−2.9 per year) resulted in a reduction to 25–50 of inhalable dust exposure levels in 2000 (1–4 mg/m3) compared with the levels in the 1970s. Geometric mean exposure levels in the a priori defined high exposure processes (data not shown) were approximately 1.5 times higher than in other processes in the compounding and mixing departments.
Time trends in CSF concentrations
Time trends in CSF concentrations could be estimated based on the statistical models for the Netherlands (1980–2005) and the UK (1975–2005), and for curing departments in Sweden between 1990 and 2000 (table 5). CSF measurements in Poland were part of a 2-year (1987–1988) intervention study and were therefore not considered in the assessment of time trends.
Overall, personal exposure to CSF was reduced by 3.3 per year since 1975 (unweighted average). Statistically significant (p<0.05) reductions were found in curing departments (−8.6 per year) and in maintenance and engineering departments (−5.4 per year) in the Netherlands and in crude materials and mixing and milling (−4.5 per year) and curing departments (−2.0 per year) in the UK. Average concentrations did not decline between 1990 and 2000 in curing departments in Sweden (+0.4 per year, p 0.96).
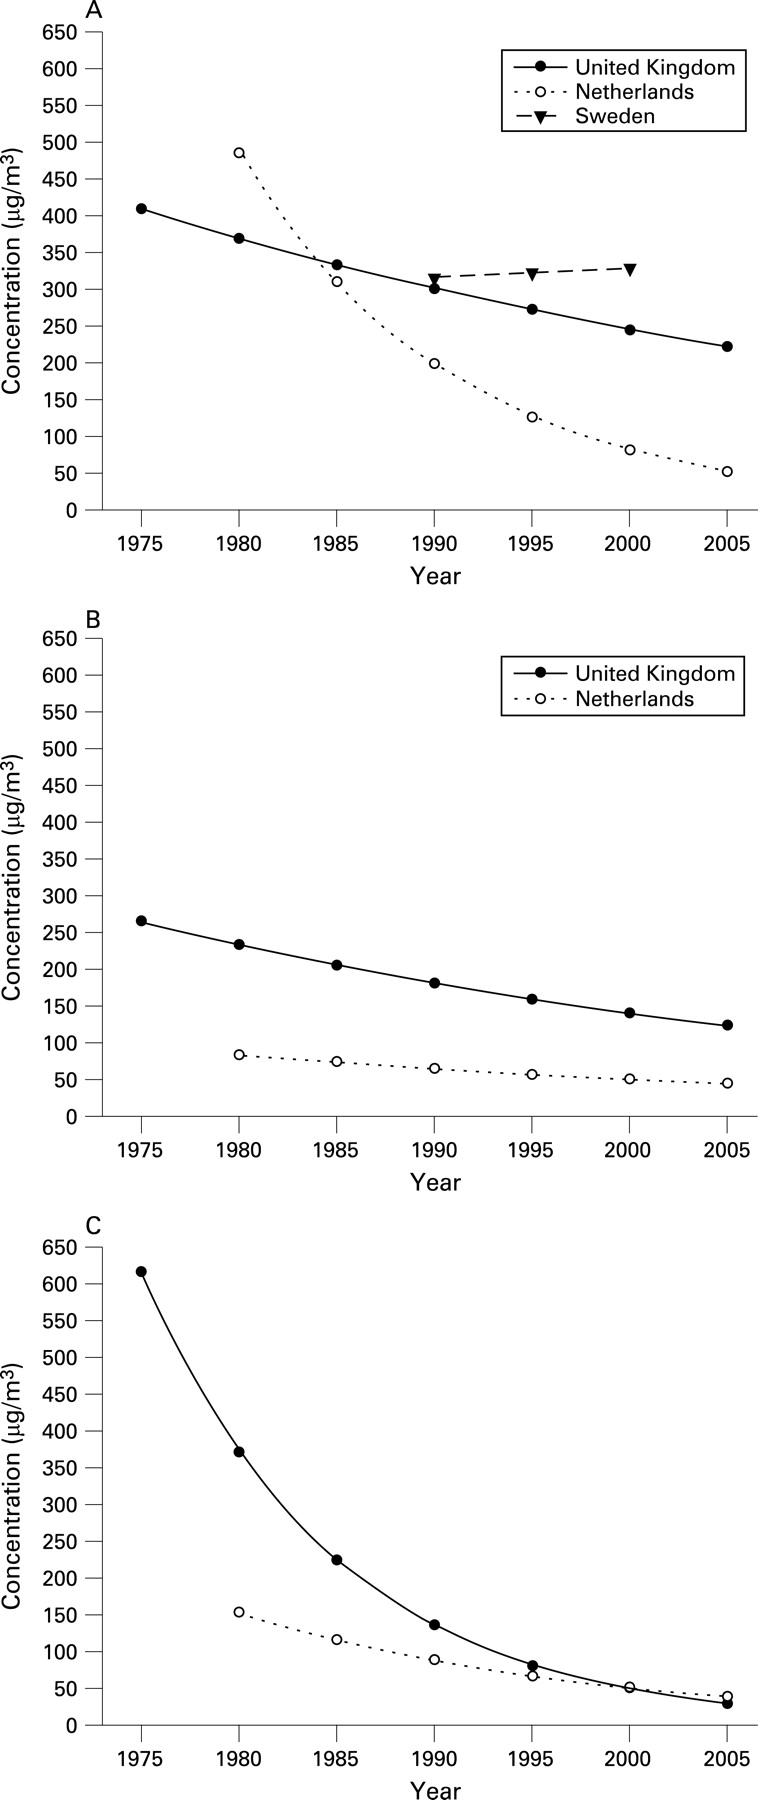
Average personal exposures to CSF since 1975 in the curing and post-treating departments (specifically defined as rubber fumes6) as well as in the maintenance and engineering departments are shown in fig 2A–C. While fig 2A only shows exposure levels for compression, transfer and injection curing (a priori defined as high exposed processes), exposure during other processes in these departments was lower by a factor of approximately 1.2. In the 1980s, average personal exposure in the curing departments was approximately 100 μg/m3 (∼20) higher in the Netherlands than in the UK, but due to a steeper reduction (−8.6 compared to −2.0 per year) geometric mean exposure levels in the Netherlands have been lower than those in the UK since the mid-1980s. The most recent data suggest that average (GM) exposures in the Netherlands are approximately one-third of those in the UK. Geometric mean exposure in Swedish curing departments was comparable to that in the UK in the 1990s, but no significant reduction in exposure levels was found between 1990 and 2000.
In post-treating departments, the average CSF exposure was higher by a factor of 2.5 in the UK compared to the Netherlands, and this difference has persisted throughout the studied period. A large difference in GM exposure levels between the Netherlands and the UK was found in the early 1980s in the maintenance and engineering departments (620 vs 150 μg/m3 in the UK and the Netherlands, respectively). However, since the 1990s these levels are comparable in both countries and similar to those found in other departments.
In Poland, CSF concentrations were only measured as part of an intervention study in which local exhaust ventilation was installed (1987−1988). This resulted in a 1-year reduction in average personal exposures during handling and mixing of compound ingredients and during pre-treating processes of 45 and 69, respectively. Surprisingly, geometric mean exposure during curing increased by 23 at the same time. Nonetheless, the levels in Poland were comparable to those found in the Netherlands and the UK (300–400 μg/m3) in the late 1980s.
DISCUSSION AND CONCLUSIONS
We described average levels of exposure to rubber inhalable dust and its CSF between the mid-1970s and 2000. Several studies have shown that airborne exposures from occupational sources have decreased in previous decades.23–25 Our observations indicate that the same trend exists in the European rubber manufacturing industry. We described an annual average reduction in exposure to inhalable dust and its CSF of 4.3 and 3.3, respectively. More specifically, exposure to inhalable dust in the crude materials and mixing and milling departments (defined as rubber process dust) decreased by 3–7 per year, while CSF exposure in curing departments (defined as rubber fumes) declined by 9 per year in the Netherlands and 2 per year in the UK. However, it should be noted that it has been shown that the CSF content of inhalable dust can vary considerably with the method of vulcanisation and other production factors.26 27
While average inhalable dust concentrations could differ by as much as a factor of 4 to 5 between countries in the 1980s, differences in the CSF content of inhalable dust were less than a factor of 2.5. Currently, however, the differences in average levels of inhalable dust and its CSF between the studied countries are much smaller. In a recent field study, de Vocht et al28 assessed the performance of inhalable aerosol sampling devices used in each country which contributed data to the EXASRUB database. It was shown that differences between countries might in fact be larger than described here because the sampling devices used in each country performed differently compared to a reference sampling device developed to measure inhalable dust according to the ISO-ACGIH-CEN inhalability convention, and ratios relative to the reference sampling device ranged from 1.12 for the IOM sampler used in the UK to 0.51 for the sampling device used in Poland.29–31 Although this study suggested that average differences could be as large as 50, this was based on only a limited number of parallel measurements. Consequently, the results (eg, correction factors for sampling devices) were not incorporated into analyses presented here. Similarly, different filter types (eg, glass fibre, Teflon) that may affect observed CSF exposure levels were used to collect particles and fumes in different studies pooled for analysis in this paper. Additional analyses (data not shown) were conducted based on a small subsample in the Netherlands and the UK, since in these countries both glass fibre and Teflon filters were used. These suggested that although filter type could have influenced the estimates of average CSF exposure, with measured concentrations using Teflon filters approximately 40 higher than when glass fibre filters were used, this did not affect the estimates of time trends.
Adjustment factors (specific for each BRMA group) were implemented to account for differences in measured respirable relative to inhalable measurements. These showed that inhalable dust measurements were on average a factor of 4–7 higher in all departments except curing. In curing departments, respirable and inhalable dust exposure levels were comparable (inhalable dust only 30 higher), which can be attributed to the fact that during the curing of products generally smaller particles are generated as a result of the vulcanisation process.28
An adjustment factor was also added to the models to account for the two sources of data in the UK (ie, measurement collected either by the HSE or the BRMA). Our results suggest that on average the dust measurements collected in BRMA surveys were a factor of 1.8 lower, while CSF measurements were on average a factor of 1.9–5.9 lower, depending on the department. This can (to some extent) be explained by the fact that BRMA measurements have primarily been taken in the larger and more modern tyre factories compared to HSE measurements. Average (GM) exposure levels in the UK were standardised to levels seen in BRMA surveys, which implies that the presented average inhalable dust and CSF levels would have been higher had the HSE been used as a reference, and that for some UK rubber plants (typical of the HSE survey) our models are likely to produce negatively biased exposure predictions. Similar differences might have occurred in other countries where data were collected by different organisations, using different strategies and equipment. This could to some extent have biased the estimates of absolute exposure levels and consequently of the differences between countries in these analyses in unknown direction. Unfortunately, this could not be assessed in more detail in our study.
Generally, differences in measurement strategies might have introduced bias into our estimates of time trends and contrasts in exposure levels. The magnitude of this bias is unknown, but we did not observe significant differences in exposure levels between surveys collected for research purposes, evaluation of controls, follow-up of a complaint, because of a general concern, or for compliance testing. This might indicate that systematic differences in our data between surveys conducted for different purposes were marginal, although it should be noted that for the UK data, where all data were collected by either the BRMA or the HSE and hence a large number of measurements were available from each institute, significant differences in measured levels were found. Also, the definition of measurement purpose and strategy is not straightforward and this information might have contained additional intrinsic error.
Bias and precision of the statistical models for inhalable dust showed that the models were somewhat relatively imprecise and tended to over-estimate exposure by 23–28. The models for CSF exposure where similarly imprecise, but the exposure was on average underestimated by only 4–6. A similar assessment has been used previously in a study of bitumen fume and benzo(a)pyrene in the asphalt paving industry.32 Bias was larger (−70 and −51 for bitumen fume and benzo(a)pyrene, respectively) and precision worse (1.35 and 1.72) than in the present study. However, Burstyn et al32 used external measurement data to validate the statistical models, whereas we used internal validation only.
Main messages
-
Personal exposures to inhalable dust and its cyclohexane soluble fraction in the European rubber manufacturing industry have steadily declined by 4 and 3 per year, respectively, from the 1970s onwards.
-
Differences in time trends and exposure levels across countries exist, as well as among various stages of the production process. These differences should be taken into account in future studies assessing current cancer risk in the contemporary rubber industry.
Policy implications
-
The steady decrease in average exposure levels of inhalable dust and its cyclohexane soluble fraction since the 1970s may have resulted in a decreased cancer risk in the contemporary rubber manufacturing industry in Europe.
-
Prospective, coordinated international exposure surveys may help in understanding between-country differences in exposure and provide opportunities for early interventions using the best available technology.
-
Prospective cohort studies of rubber manufacturing workers will be able to make use of the wealth of exposure data collected within the EU-EXASRUB project.
Our hierarchical linear mixed models assume that trends in time were monotonic in time and that there were no major changes in measurement strategies or techniques within countries other than those included in this dataset. However, it is more realistic to consider that in each workplace reduction of exposures took place in a number of distinct steps when new exposure control measures were implemented.7 Exploring the shape of the time trends using country-specific analyses with 5-year periods and a continuous time variable, as well as exploring the shape of the time trends in the complete dataset using quadratic cubic splines (data not shown), did not suggest that time trends differed significantly from those assumed in our models. This can be ascribed to the fact that the moment when these measures were introduced differed across countries, across companies and even within companies, related to the start of industry-based programs, front-runners, etc. These results are supported by studies in the metal (lead) industry33 and in the paper and pulp industries,34 which demonstrate that the implementation of new exposure limits does not seem to be associated with sudden changes in exposure levels. However, this is not always the case, as was shown in a recent study of n-nitrosamine exposures in the European rubber industry,35 where a drop in average exposure levels in Germany was associated with the introduction of a new exposure limit.
In conclusion, our results show that average geometric mean exposure levels of inhalable dust and its CSF in the European rubber manufacturing industry have steadily declined by 4 and 3 per year from 1975 onwards. Significant reductions in inhalable dust concentrations were found in crude materials, mixing and milling and miscellaneous workers, while significant CSF exposure reductions were found during curing and maintenance and engineering. Although we did not assess current genotoxic risk in the rubber industry in these analyses, it is plausible that these (and other) health risks have decreased over time since exposure levels have declined as shown in this study and because the most toxic (carcinogenic) chemicals have been replaced.8 Finally, we showed that relatively large differences in time trends and average levels of exposure exist across countries, in addition to differences in exposure among various stages of the production process. These patterns should be taken into account in retrospective assessment of exposure for epidemiological studies assessing cancer risk in the current rubber industry.
Acknowledgments
On behalf of the EU-EXASRUB consortium: F Baarslag† (Nederlandse Vereniging van Rubber- en Kunststoffabrikanten), KH Bedemann (Berufsgenossenschaft der Chemischen Industrie), U Bergendorf (Lund University Hospital), I Burstyn (IRAS), A Dost (British Rubber Manufacturers’ Association Ltd), L Hagmar† (Lund University Hospital), M Heise (Universitaetsklinikum Muenster), K Jakobsson (Lund University Hospital), H Kromhout (IRAS), L Nichols (University of Birmingham), B Peplonska (Nofer Institute), W Sobala (Nofer Institute), T Sorahan (University of Birmingham), K Straif (Universitaetsklinikum Muenster), K Straughan, P Swuste (Technical University Delft), N Szeszenia-Dabrowska (Nofer Institute), D Taeger (Universitaetsklinikum Muenster), R Vermeulen (IRAS) and F de Vocht (IRAS).† These members are deceased.
REFERENCES
Footnotes
-
Funding: This study was funded by a grant of the Quality of Life and Management of Living Resources Programme in the European Union 6th framework (contract no. QLK4-CT-2001-00160 and QLRT-2001-02786)
-
Competing interests: None.