Article Text

Abstract
Objectives: This report provides an update of the mortality experience of a cohort of South Carolina asbestos textile workers.
Methods: A cohort of 3072 workers exposed to chrysotile in a South Carolina asbestos textile plant (1916–77) was followed up for mortality through 2001. Standardised mortality ratios (SMRs) were computed using US and South Carolina mortality rates. A job exposure matrix provided calendar time dependent estimates of chrysotile exposure concentrations. Poisson regression models were fitted for lung cancer and asbestosis. Covariates considered included sex, race, age, calendar time, birth cohort and time since first exposure. Cumulative exposure lags of 5 and 10 years were considered by disregarding exposure in the most recent 5 and 10 years, respectively.
Results: A majority of the cohort was deceased (64%) and 702 of the 1961 deaths occurred since the previous update. Mortality was elevated based on US referent rates for a priori causes of interest including all causes combined (SMR 1.33, 95% CI 1.28 to 1.39); all cancers (SMR 1.27, 95% CI 1.16 to 1.39); oesophageal cancer (SMR 1.87, 95% CI 1.09 to 2.99); lung cancer (SMR 1.95, 95% CI 1.68 to 2.24); ischaemic heart disease (SMR 1.20, 95% CI 1.10 to 1.32); and pneumoconiosis and other respiratory diseases (SMR 4.81, 95% CI 3.84 to 5.94). Mortality remained elevated for these causes when South Carolina referent rates were used. Three cases of mesothelioma were observed among cohort members. Exposure-response modelling for lung cancer, using a linear relative risk model, produced a slope coefficient of 0.0198 (fibre-years/ml) (standard error 0.00496), when cumulative exposure was lagged 10 years. Poisson regression modelling confirmed significant positive relations between estimated chrysotile exposure and lung cancer and asbestosis mortality observed in previous updates of this cohort.
Conclusions: This study confirms the findings from previous investigations of excess mortality from lung cancer and asbestosis and a strong exposure-response relation between estimated exposure to chrysotile and mortality from lung cancer and asbestosis.
- JEM, job exposure matrix
- NDI, National Death Index
- SMR, standardised mortality ratio
- TSFE, time since first exposure
Statistics from Altmetric.com
- JEM, job exposure matrix
- NDI, National Death Index
- SMR, standardised mortality ratio
- TSFE, time since first exposure
Asbestos is well recognised to be a cause of malignant and non-malignant respiratory diseases. However, a continuing debate exists over whether or not, and if so to what extent, the chrysotile form of asbestos is a cause of these diseases. Some have suggested that “pure” chrysotile may not in fact be carcinogenic and that respiratory cancer excesses that have been observed in studies of chrysotile exposed workers may be explained by trace tremolite contamination in commercially used chrysotile.1 This speculation has been referred by some as the “amphibole hypothesis”. Others have argued against this hypothesis.2,3
A recent study, which provides evidence against the amphibole hypothesis, is a 25-year longitudinal study of male workers (n = 515) at an asbestos plant in China, where exposure was to chrysotile with little tremolite contamination (<0.001%).4 An age- and smoking-adjusted relative risk of 8.1 (95% CI 1.8 to 36.1) was observed for lung cancer among highly exposed workers (workers in poorly ventilated raw material and textile sections) relative to workers with low exposure to asbestos (office workers and workers in the well-ventilated asbestos cement section) and two cases of malignant mesothelioma were observed.4
Another line of evidence against the amphibole hypothesis is the strong relation between lung cancer and chrysotile observed in a cohort of textile workers in South Carolina.5 The strong exposure-response relations between chrysotile and lung cancer, in addition to pneumoconiosis and other respiratory diseases (including asbestosis), have persisted in updates of this cohort.6–8 In addition, a case-control analysis of this cohort indicated that the relation between chrysotile exposure and lung cancer was not confounded by exposures to mineral oil.7 Predicted lifetime excess risks of lung cancer and asbestosis from exposure to chrysotile, based on extensive exposure-response modelling of this cohort, were estimated by Stayner et al.8 Vital status follow-up was recently extended through 2001 for the cohort of South Carolina textile workers. The primary objectives of this study were to update mortality and exposure-response relations between chrysotile and lung cancer and asbestosis mortality. This study was approved by the National Institute for Occupational Safety and Health Human Subjects Review Board.
METHODS
The study plant, located in South Carolina, produced asbestos products beginning in 1896 and asbestos textile products beginning in 1909.9 The plant exclusively used chrysotile fibres obtained from Quebec, British Columbia and Rhodesia; however, small amounts of crocidolite yarn were used to make woven tape or braided packing from the 1950s until 1975. The total quantity of crocidolite used was approximately 2000 pounds compared to 6–8 million pounds per year of chrysotile during the same time period. As the crocidolite was never carded, spun or twisted, and all weaving of crocidolite tapes was done wet on a single loom, the predominant exposure at the plant was to chrysotile. The cohort definition included all textile production departments including preparation, carding, spinning (ring and gang, mule), spooling, twisting, winding, braiding, rope, wick and cord, weaving, finishing and quality control. The plant stopped using asbestos material by the end of 1977.
Cohort description
The original cohort (n = 1261) was defined as all white male workers employed in textile production operations for at least one month between 1 January 1940 and 31 December 1965, with vital status follow-up through 1975.5 The cohort was expanded to include white and non-white males and white females (n = 3022) and vital status follow-up was extended through 1990.6,7 For the current study, 21 non-white females were added to the cohort. Updated demographic information was available for 29 workers who were previously excluded from analysis. Therefore, the current study updates mortality for 3072 workers with vital status follow-up through 2001.
Cohort mortality
Follow-up methods in the original study and previous update of this cohort were applied to all workers, regardless of race or sex. For the present update, names of cohort members were submitted to the National Death Index (NDI) for determination of vital status from 1 January 1991 through 2001. The NDI Plus provided underlying and contributing causes of death for deceased workers identified by the NDI. All deaths were coded according to the revision of the International Classification of Diseases (ICD) in effect at the time of death. Workers that were confirmed alive on 1 January 1979, with a valid (within assigned range) Social Security number and not shown to be deceased on the NDI were considered to be alive as of the study end date. Those lost to follow-up before 1 January 1979, with invalid Social Security numbers, and thus not able to be matched with the NDI, were considered “lost to follow-up”.
The mortality experience of the cohort was analysed using the National Institute for Occupational Safety and Health modified life table analysis system.10,11 Under this system, each cohort member accumulated person-years at risk (PYAR) for each year of life after 1 January 1940 or completion of the one-month eligibility period (whichever was later) until the earliest of the following: the date of death for deceased cohort members, the date last observed for persons lost to follow-up or the study end date (31 December 2001).
Rate files created for the life table analysis system identify 92 cause of death categories for which rates begin in 1940 and extend through 2001.12 The PYAR were stratified into five-year intervals by age and calendar time and then multiplied by the appropriate US sex-, race- and cause-specific mortality rates to calculate the expected number of deaths. The ratio of observed to expected number of deaths was expressed as the standardised mortality ratio (SMR). Expanded rate files that identify 119 cause of death categories, including asbestosis, were created for both US and South Carolina referent populations.12 In analyses using 119 cause of death categories, PYAR and observed deaths started to accumulate on 1 January 1960, when the rates were first available, or completion of the one-month eligibility period, whichever was later.
We considered mortality from the following causes to be of a priori interest: mesothelioma; cancers of the digestive system, larynx, trachea/bronchus/lung, peritoneum, and pleura; non-malignant respiratory diseases including pneumoconiosis and asbestosis; and ischaemic heart disease. As a specific code for mesothelioma did not exist before the 10th revision of the ICD, we reviewed death certificates for any mention of mesothelioma in order to identify pleural and peritoneal mesothelioma deaths during 1991–8. Mesothelioma deaths occurring after 1998 were identified by ICD-10 code C45 in the NDI cause of death file.
Exposure assessment
Detailed work histories listing beginning and ending dates in departments and operations were available for each member of the cohort. A department-, operation-, and calendar year-specific job exposure matrix (JEM) was available to link with the detailed work histories to calculate cumulative exposure to chrysotile.9 Chrysotile exposure concentrations (expressed as fibres longer than 5 micrometers per millilitre of air) were estimated using statistical modelling of nearly 6000 industrial hygiene sampling measurements taken over the period 1930–75 and analysed using phase contrast microscopy. Exposure concentrations were considerably higher before 1940, before engineering dust control measures were put into place. This JEM has been used in previous mortality studies and exposure-response analyses of this cohort.5–8,13
Each day in the work history was assigned an exposure level based on the JEM and cumulative exposure was defined as the sum of the assigned exposure concentrations over all days worked. SMRs were calculated by cumulative exposure for cancer of the trachea, bronchus, and lung (hereafter referred to as lung cancer) and pneumoconiosis and other respiratory diseases. Cutpoints of cumulative exposure were selected to give six exposure strata with approximately equal numbers of deaths (cause-specific).
Internal exposure-response modelling
Since stratified SMRs are not directly comparable, rate ratios (RRs) for each cumulative exposure category relative to the lowest group, adjusted for sex, race, age (<50, 50–54 … 75–79, and ⩾80 years), and calendar year (<1970, 1970–9, 1980–9, and ⩾1990) were obtained by Poisson regression. Exposure lags of 5 and 10 years were considered by disregarding exposures in the most recent 5 and 10 years, respectively.
More detailed Poisson regression analyses were conducted by treating cumulative exposure as a continuous variable. In these analyses, cumulative exposure was partitioned into 30 categories with approximately equal numbers of deaths (cause-specific) and modelled as a continuous variable using the mean exposure, weighted by PYAR, in each exposure category.14 Birth cohort (<1900, 1900–9, 1910–19, 1920–9, and ⩾1930) was used, in the absence of smoking information for all cohort members, as a surrogate for smoking. Additional covariates considered included sex, race, age, calendar year and time since first exposure (TSFE; <20, 20–39, and ⩾40 years).
For lung cancer, the underlying cause of death was used to define the response and the model form was based on a linear relative risk model that was similar to the 1986 US Environmental Protection Agency lung cancer model.15 In a previous analysis of this cohort, this model was found to best fit the lung cancer exposure-response.8 Background incidence was modelled as a log (ln) linear function of the covariates (sex, race, birth cohort, age and calendar year). Second-order interactions were assessed among the covariates in the baseline function. The predicted incidence rate (λ) was modelled as the product of the background incidence (λ0) and a linear function of cumulative exposure, that is: λ = λ0 × (1 + βE10), where E10 represents cumulative exposure to chrysotile (fibre-years/ml, as measured by phase contrast microscopy) omitting any exposure in the most recent 10 years (that is, a lag of 10 years). Interactions between exposure and the baseline covariates were considered along with the interaction between exposure and TSFE.
For asbestosis, both underlying and contributing causes were used to define the response and background incidence was similarly modelled, but a power model (λ = λ0 × (E + α) β) was employed. In the power model, alpha (α) was solved iteratively by minimising the model deviance. The power model was found to best fit the asbestosis exposure-response in a previous analysis of this cohort.8 Cumulative exposure lags of 5 and 10 years were also considered. Interactions between exposure and the baseline covariates were considered along with the interaction between exposure and TSFE.
Restricted cubic spline and categorical models, the model deviance, and Akaike’s Information Criterion were used to informally evaluate the continuous models.16 Models with the smallest values of Akaike’s Information Criterion were considered to be the best fitting models. Poisson regression models were fit using Epicure (version 2.11, Hirosoft Corporation, Seattle, Washington, USA).
RESULTS
Cohort mortality
The cohort of 3072 workers has been followed for 118 513 PYAR (table 1). The additional 11 years of follow-up and the inclusion of non-white females to the cohort added 702 deaths and more than 13 000 PYAR. More than half of the cohort (63.8%) had died through 2001. Nearly 10% of the cohort, however, was considered lost to follow-up, mostly because of high rates of loss to follow-up among females. One hundred and twenty workers known to be dead as of 31 December 2001 were missing cause of death information. An additional 426 workers who died or were lost to follow-up before 1 January 1960 were excluded from analyses using South Carolina referent rates because rates were not available before 1960. As the observed person-time and deaths among non-white females were too few to provide stable estimates for any cause of death, results for non-white females are only reported in analyses combining all females or all workers.
Characteristics of the South Carolina asbestos textile workers cohort
The distribution of duration of employment was strongly right skewed with approximately half of the workers employed for one year or less (“short-term workers”). Short-term workers were more likely to have been hired during the World War II years of 1939–45. Most of the short-term and many of the long-term workers hired during these years did not continue working at the plant after the war.
Table 2 gives the results of the mortality analysis by race and sex based on the use of US mortality rates. Mortality was elevated for all causes combined and all cancers. Among the a priori causes of interest, mortality from cancers of the digestive organs was not elevated, with the exception of excess mortality from oesophageal cancer; mortality from cancers of the respiratory system was elevated, largely due to excess mortality from lung cancer; mortality from ischaemic heart disease was elevated; and mortality from diseases of the respiratory system was elevated, particularly chronic obstructive pulmonary disease and pneumoconiosis and other respiratory diseases. These elevations persisted in subsequent analyses (not shown) in which South Carolina referent rates were used to generate expected numbers of deaths. When short-term workers were excluded, elevations in mortality from lung cancer (SMR 2.44, 95% CI 2.04 to 2.90) and pneumoconiosis and other respiratory diseases (SMR 7.07, 95% CI 5.49 to 8.97) persisted.
Mortality through 2001 based on US mortality rates for selected causes of death among workers in the South Carolina asbestos textile workers cohort
Mortality was elevated from diabetes mellitus and diseases of the digestive system; these elevations persisted when South Carolina referent rates were used. Mortality was elevated based on US, but not South Carolina, referent rates for other diseases of the heart, other diseases of the circulatory system including cerebrovascular disease, and accidents. Reduced mortality was observed for cancer of the intestine (excluding the rectum) and suicide. Among white males, excess mortality was also observed for cirrhosis and other chronic liver diseases, particularly when South Carolina referent rates were used (SMR 1.88, 95% CI 1.15 to 2.91).
Mortality from asbestosis was highly elevated based on US referent rates (observed 36, expected 0.15, SMR 232.5, 95% CI 162.8 to 321.9) and remained highly elevated based on South Carolina referent rates (expected 0.33, SMR 108.2, 95% CI 75.8 to 149.8). A manual review of the death certificates identified three mesothelioma deaths, all among white males. Two of these have been described in a previous update of this cohort (Dement et al, 1994). The third mesothelioma death occurred in 1995, nearly 50 years after the employee began working in the mule spinning department for approximately 2.5 years. None of the deaths under the 10th revision of the ICD were due to mesothelioma.
A mortality analysis among workers actively employed, which considered person-time and deaths from the person-year begin date through termination of employment at the plant, indicated reduced mortality overall (63 deaths, SMR 0.59, 95% CI 0.46 to 0.76), however, excess mortality was observed for pneumoconiosis and other respiratory diseases (7 deaths, SMR 8.14, 95% CI 3.26 to 16.8). Mortality in the first year post termination of employment was elevated overall (59 deaths, SMR 4.36, 95% CI 3.32 to 5.63) and for all cancers combined (18 deaths, SMR 7.87, 95% CI 4.66 to 12.4) with much of the elevation was due to cancers of the digestive organs (4 deaths, SMR 6.63, 95% CI 1.81 to 17.0), lung cancer (11 deaths, SMR 21.6, 95% CI 10.8 to 38.7), and pneumoconiosis and other respiratory diseases (6 deaths, SMR 46.4, 95% CI 17.0 to 101); all of these deaths were among workers with cumulative exposure to chrysotile in excess of 10 000 fibre-days/ml. All of the lung cancer and pneumoconiosis deaths in the first year after termination of employment occurred more than 10 years since first exposure and 3 (out of 4) digestive organ cancer deaths occurred more than 20 years since first exposure.
The results of the mortality analysis for lung cancer by cumulative exposure to chrysotile fibres are provided in table 3. A majority (96%) of the 198 lung cancer deaths occurred 20 years or more after first exposure. Increasing trends in lung cancer SMRs with increasing cumulative exposure were observed for white males, non-white males, females and overall. Increasing and highly significant trends were also observed for lung cancer mortality in internal analyses using Poisson regression, which adjusted for sex, race, age and calendar-year. Results were similar and there was no improvement in model fit when a five- or 10-year lag was employed. Rate ratios relative to the lowest cumulative exposure group were particularly elevated in the highest cumulative exposure category. The trend persisted when short-term workers were excluded from the analysis.
Lung cancer mortality (underlying cause) through 2001 by cumulative exposure to chrysotile among workers in the South Carolina asbestos textile workers cohort
Results of the mortality analysis for the cause of death category “pneumoconiosis and other respiratory diseases” (which includes asbestosis) by cumulative exposure to chrysotile fibres are provided in table 4. Of the 85 observed deaths in this category, 42 were from asbestosis. Increasing trends in pneumoconiosis SMRs with increasing cumulative exposure were observed for white males, non-white males, females and overall. Increasing and highly significant trends were also observed for pneumoconiosis mortality in internal analyses using Poisson regression. Results were similar and there was no improvement in model fit when a five- or 10-year lag was employed. Rare ratios relative to the lowest cumulative exposure group were particularly elevated in the highest cumulative exposure category. The trend persisted when short-term workers were excluded from the analysis.
Pneumoconiosis and other respiratory diseases mortality (underlying cause) through 2001 by cumulative exposure to chrysotile among workers in the South Carolina asbestos textile workers cohort
Exposure-response modelling
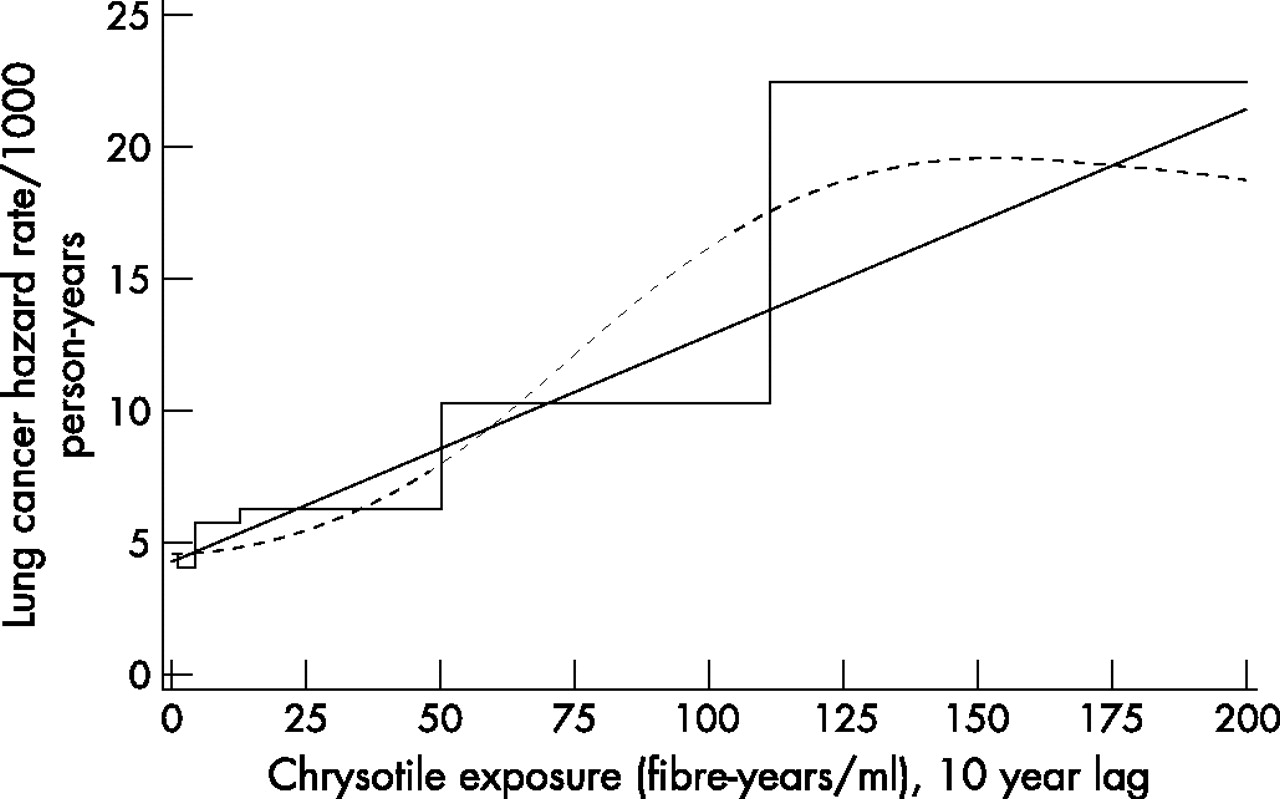
Lung cancer mortality (198 observed deaths) was modelled as a continuous function of exposure using the linear relative risk model. When covariates were included one-at-a-time in the background function, mortality was lower for females and non-whites, increased with age and calendar time, but decreased with birth cohort (not shown). Model fit was improved when sex, race, and age were included in the baseline function, but not when either calendar time or birth cohort was additionally included in the model. Interactions among covariates in the baseline model did not improve model fit; consequently, the baseline function included terms for sex, race, and age. Cumulative exposure, lagged 10 years, was highly significant based on the likelihood ratio test. Interactions with cumulative exposure and the baseline covariates did not improve model fit; likewise, an interaction with cumulative exposure and TSFE also did not improve model fit. The model for lung cancer mortality is described in table 5 and graphically displayed, along with the categorical and restricted cubic spline models, in figure 1. As the baseline function included categorical terms for sex, race and age, the graph depicts the predicted mortality rate for, as an example, white males 60–64 years of age. Predicted curves for other groups can be constructed using the estimated parameters in table 5. While the model was developed using the entire cohort, the graph only displays cumulative exposures through 200 fibre-years/ml, rather than the maximum of 700 fibre-years/ml because only 1% of the observed person-time is above 200 fibre-years/ml. With very little person-time and, furthermore, very few people with person-time in the range of 200–700 fibre-years/ml, modelling cannot provide much information about the shape of the exposure-response in this range, particularly for a specific cause of death. The coefficient of cumulative exposure was 0.0198 (fibre-years/ml) based on a 10-year lag; coefficients were similar, but slightly reduced, when cumulative exposure was not lagged (0.0165) or lagged by only five years (0.0176). Cumulative exposure was positively and significantly associated with lung cancer mortality in all models tested.
Model for lung cancer mortality as an underlying cause of death among workers in the South Carolina asbestos textile workers cohort*

Estimated lung cancer mortality for white males, 60–64 years of age as a function of cumulative exposure to chrysotile (10-year lag) based on the model described in table 5 (linear relative risk model, solid curve; restricted cubic spline model, dashed curve; categorical model, step function).
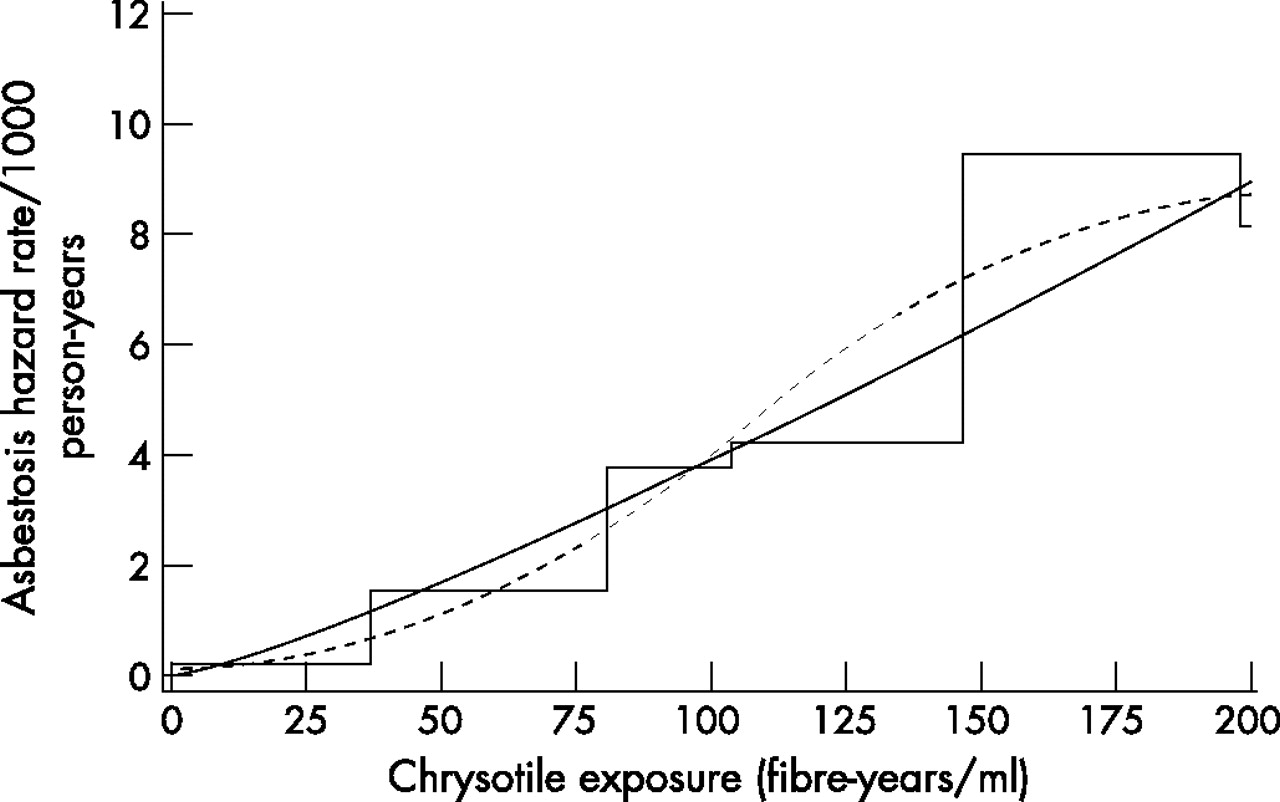
Asbestosis mortality (62 observed deaths) was modelled using the power model. Model fit was improved when sex, race, age and birth cohort were included in the baseline function, but not when calendar time was additionally included in the model. Age and birth cohort categories with similar estimates were combined resulting in four age categories (<50 years, 50–59 years, 60–74 years, and 75+ years) and two birth cohort categories (<1920, 1920+). Mortality was lower for females and non-whites, higher for workers born before 1920, and increased with age. With sex, race, age and birth cohort in the baseline function, the relative rate for cumulative exposure (E, fibre-years/ml) was given by (E+0.9)1.07/(0.9)1.07. Interactions among the baseline covariates did not improve the model, nor did interactions with cumulative exposure and TSFE; however, a statistically significant interaction between cumulative exposure and age category was observed (p value = 0.026). Including this interaction term in the model results in estimates of the relative rate for cumulative exposure that depend upon age. This model for asbestosis mortality is described in table 6 and graphically displayed, along with the categorical and restricted cubic spline models, in figure 2 for, as an example, white males 60–74 years of age born in 1920 or later. Under this model, the relative rate for asbestosis as a function of cumulative exposure was given by (E+0.9)1.52/(0.9)1.52 for persons under 50 years of age, (E+0.9)1.50/(0.9)1.50 for workers 50–59 years of age, (E+0.9)1.20/(0.9)1.20 for persons 60–74 years of age, and (E+0.9)0.62/(0.9)0.62 for persons 75+ years of age. Similar results were obtained when cumulative exposure was lagged by five or 10 years (not shown). Cumulative exposure was positively and significantly associated with asbestosis mortality in all models tested.
Model for asbestosis mortality as an underlying or contributing cause of death among workers in the South Carolina asbestos textile workers cohort*

Estimated asbestosis mortality for white males, 60–74 years of age, and born in 1920 or later as a function of cumulative exposure to chrysotile based on the model described in table 6 (power model, solid curve; restricted cubic spline model, dashed curve; categorical model, step function).
DISCUSSION
The primary focus of this update was to re-examine both mortality and the exposure-response relationships between cumulative exposure to chrysotile and mortality from lung cancer and asbestosis in the South Carolina asbestos textile workers cohort with an additional 11 years of follow-up. All cause mortality remained elevated, as was mortality from all cancers including oesophageal and lung cancer, ischaemic heart disease, pneumoconiosis and other respiratory diseases, diabetes, chronic obstructive pulmonary disease, and diseases of the digestive system. The number of deaths from mesothelioma is consistent with the results of other cohort mortality studies where workers were predominantly exposed to the chrysotile form of asbestos.2,17
Increasing and highly statistically significant trends with increasing cumulative exposure were observed for both lung cancer and asbestosis, with 72 and 17 additional deaths since the last update, respectively. Standardised mortality ratios were elevated for lung cancer and pneumoconiosis and other respiratory diseases even among the lowest exposure group. Previous analyses of the exposure-response relation between chrysotile and lung cancer mortality in this cohort selected the linear relative risk model over other model forms and estimated the relative rate for cumulative chrysotile exposure (E, fibre-years/ml) to be (1 + 0.022 E) for a worker with 15–29 years of TSFE, (1 + 0.037 E) for a worker with 30–39 years of TSFE and (1 + 0.011 E) for a worker with 40 or more years of TSFE.8 Using the updated data, and employing a 10-year lag on cumulative exposure, the relative rate was estimated to be (1 + 0.020 E10); however, there was no evidence of an interaction between TSFE and exposure.
Previous analysis of the exposure-response relation between chrysotile and mortality from asbestosis in this cohort selected the power model over other model forms and estimated the relative rate for cumulative chrysotile exposure (E, fibre-years/ml) to be equal to (E + 0.5)1.3/(0.5)1.3.8 The power model, which fit the data better than other models tested (results not shown), is still a reasonable model for asbestosis mortality in this cohort, but was improved by adding an interaction with age.
Smoking information on the cohort is limited. The US Public Health Service administered surveys to active workers in 1964 and again to active workers in 1971. These surveys indicated that, compared to the US population in 1965, smoking prevalence among white males (n = 292) was similar to the prevalence among US white males; however, prevalence among non-white males (n = 113) was lower than the prevalence among US non-white males and prevalence among white females (n = 124) was higher than the prevalence among US white females.7 The strong exposure-response patterns observed for lung cancer is unlikely to be fully explained by uncontrolled confounding by smoking because these analyses were conducted within the cohort and smoking is unlikely to vary by level of asbestos exposure. In a study examining the potential for tobacco and alcohol to confound the relation between laryngeal cancer and metal working fluids, Kriebel et al concluded that, for large studies, systematic or chance differences in smoking and drinking habits among the exposure groups are unlikely to cause more than a 17% change in the relative risk.18 Smoking prevalence in the US is related to sex, race, education and birth cohort.19,20 In the absence of smoking information, others have used birth year or birth cohort as a surrogate for smoking.21 Birth cohort, however, was neither an effect modifier nor a confounder in our models of lung cancer with cumulative exposure. In our models of asbestosis mortality, the addition of a term to identify workers born before 1920 in the baseline function significantly improved model fit, but an interaction term between birth cohort and cumulative chrysotile exposure did not.
There is some evidence of the healthy worker survival effect in that reduced mortality was observed among actively employed workers and highly elevated mortality—mostly lung cancer and pneumoconiosis and other respiratory diseases—was observed in the first year following termination of employment. Time since termination of employment has been shown to confound exposure-response relationships in occupational cohorts.22 In supplemental analyses (not shown), time since last employment at the plant (used as a surrogate for time since termination of overall employment) did not confound the exposure-response relationship between chrysotile and lung cancer.
The cohort included many “short-term” workers with nearly half of the workers employed for less than one year at the plant. Since higher than expected death rates among short-term employees have been observed in a number of occupational mortality studies, hypotheses have been developed that short-term workers might have certain characteristics that distinguish them from long-term workers.23,24 In this cohort, a high percentage (71%) of the short-term workforce was only employed during the World War II years and the nature of their short-term employment was more likely related to the reduction of war-time demand as opposed to possible socioeconomic, lifestyle or occupational factors. Furthermore, mortality from lung cancer and pneumoconiosis and other respiratory diseases was still elevated and positively associated with estimated cumulative exposure to chrysotile in supplemental analyses excluding short-term workers.
Main messages
-
Workers exposed to chrysotile in textile manufacturing were observed to have excess mortality from several causes of death including oesophageal cancer, lung cancer, ischaemic heart disease, and pneumoconiosis and other respiratory diseases, including asbestosis.
-
Positive relationships between estimated chrysotile exposure and mortality from lung cancer and asbestosis observed in previous updates of this cohort were confirmed with the addition of 11 years of follow-up.
-
Limited smoking data indicated similar or reduced smoking prevalence compared to the US population for white and non-white males, respectively; however, smoking prevalence was higher for white females.
-
Three mesothelioma deaths were observed.
In addition to a lack of smoking histories for all of the cohort members, the findings reported herein are subject to additional limitations including incomplete lifetime work histories and high rates of loss to follow-up, especially among female workers. The detailed exposure-response modelling is not without limitations in that estimates of risk are based on a single model and are somewhat dependent on the form of the model, the cutpoints used to stratify exposure and the lag period selected. Cumulative exposure, however, was positively and highly statistically significantly associated with lung cancer and asbestosis mortality when additional model forms were considered (not shown). The use of a large number of cutpoints and the treatment of exposure as a continuous variable in these models lessens the dependence of the results on the selected cutpoints.14 Exposure lag periods of five and 10 years were considered in addition to unlagged analyses. Results were similar in lagged and unlagged analyses, however, in this cohort, many years have passed since exposure ceased, so this was not too surprising.
In spite of these limitations, there are many strengths of the analysis, including a long follow-up time, a large number of observed deaths due to lung cancer and asbestosis, detailed work histories and a well-defined JEM. The JEM used here characterises exposure to chrysotile in terms of the number of fibres longer than 5 micrometers per millilitre of air. Exposure concentrations were estimated using statistical modelling of nearly 6000 industrial hygiene sampling measurements taken over the period 1930–75 and analysed using phase contrast microscopy. There is evidence that fibre size (diameter and length) may play an important role in characterising the exposure-response relation between chrysotile exposure and mortality from lung cancer and asbestosis.25 Plans are underway for the re-analysis of this cohort using an updated JEM based on a transmission electron microscopy analysis of the air samples that considers the size distribution of the fibres in addition to the number of fibres.
In conclusion, this study confirms the findings from previous investigations of excess mortality from lung cancer and asbestosis and a strong exposure-response relation between exposure to chrysotile and mortality from lung cancer and asbestosis.
Acknowledgments
The authors express their appreciation to Ms Christine M Gersic for her assistance with the data files.
REFERENCES
Footnotes
-
Published Online First 20 April 2007
-
Competing interests: None declared.
-
The findings and conclusions in this report are those of the authors and do not necessarily represent the views of the National Institute for Occupational Safety and Health.