Article Text

Abstract
Objective: To examine the validity and potential biases in self-reports of computer, mouse and keyboard usage times, compared with objective recordings.
Methods: A study population of 1211 people was asked in a questionnaire to estimate the average time they had worked with computer, mouse and keyboard during the past four working weeks. During the same period, a software program recorded these activities objectively. The study was part of a one-year follow-up study from 2000–1 of musculoskeletal outcomes among Danish computer workers.
Results: Self-reports on computer, mouse and keyboard usage times were positively associated with objectively measured activity, but the validity was low. Self-reports explained only between a quarter and a third of the variance of objectively measured activity, and were even lower for one measure (keyboard time). Self-reports overestimated usage times. Overestimation was large at low levels and declined with increasing levels of objectively measured activity. Mouse usage time proportion was an exception with a near 1:1 relation. Variability in objectively measured activity, arm pain, gender and age influenced self-reports in a systematic way, but the effects were modest and sometimes in different directions.
Conclusion: Self-reported durations of computer activities are positively associated with objective measures but they are quite inaccurate. Studies using self-reports to establish relations between computer work times and musculoskeletal pain could be biased and lead to falsely increased or decreased risk estimates.
- NUDATA, Neck and Upper extremity Disorders Among Technical Assistants
- WPR, WorkPace Recorder
Statistics from Altmetric.com
During the last few decades personal computers have become one of the most common working tools in developed countries. In Denmark it has been estimated that by 2001 approximately 20% of the working population used a computer for at least 75% of their working time.1 Data entry and work with visual display units in relation to musculoskeletal pain and disorders have been studied intensively, mostly in cross-sectional studies,2–6 and in recent years results from large longitudinal studies have appeared.7,8,9,10,11,12,13,14,15,16 Several of these studies indicate that musculoskeletal pain, especially in the distal arm regions, increases with increasing daily or weekly duration of computer work and that the increased risk of musculoskeletal pain may appear at even short daily or weekly computer work times and without any obvious threshold level. From a biological point of view, such an exposure-response pattern seems unlikely, indicating that the relations may be biased. Different types of biases may influence the observed relations between musculoskeletal pain and computer work, including information bias with respect to self-reports on computer work times. Almost all previous epidemiological studies have relied on self-reported data on the duration of computer work time, yet the validity of such self-reports has only been studied in a few smaller studies with a one-day recording period,17–19 and in one study with a recording period of 15 work days.20 The present paper deals with validity and potential sources of information bias in self-reported computer, mouse and keyboard work times during a four-week period, based on self-reports and objective activity data from 1211 people.
MATERIAL AND METHODS
The NUDATA study (Neck and Upper extremity Disorders Among Technical Assistants) is a one-year prospective study of 6943 technical assistants, examining associations between computer work and musculoskeletal pain and clinical disorders of the neck and upper extremities. A pilot questionnaire before the study confirmed a wide distribution of computer work in the material. The material has been thoroughly described elsewhere.11–14
At baseline participants were asked to install a software program (WorkPace Recorder, Niche Software, New Zealand) which, in the background, would record any computer usage related to the activation of the keyboard or mouse (hitting the keys, clicking or dragging the mouse). Summary statistics were made on a daily basis and the data were stored in the computer. Those who installed the software were not informed about any aspects of their recorded computer work data during the one-year registration period. After 52 weeks of registration, the participants were instructed to copy and return the data. In all, 2146 participants (38% of participants at follow-up) returned recorded data.
In the one-year follow-up questionnaire participants were asked to estimate their average weekly computer work in hours per week (h/w) during the past four working weeks and to indicate the date they had filled the questionnaire. Participants who also had WorkPace Recorder (WPR) data during all four weeks prior to this date were extracted for the purpose of the present study, leaving out participants who for some reason (for example, no work with a computer, vacation, education or sick leave) had weeks without WPR computer activity in any of the four weeks before the date of filling out the questionnaire. 1216 participants fulfilled these criteria (106 had not filled the questionnaire date, 384 had questionnaire dates later than the last WPR recording week, and 440 had weeks without WPR computer activity during the four weeks before the questionnaire date). Five were excluded due to inconsistent or missing data in the questionnaire, leaving 1211 participants with comparable questionnaire and WPR data as the material for this study.
Participation in the study, installing the WPR software and returning the recorded data were voluntary. The NUDATA study was approved by the National Scientific Ethics Committee.
Questionnaire data
The questionnaire contained a one-page schedule with suggested work tasks, divided into work with and without a computer. Respondents were asked to estimate their average weekly hours during the past four weeks doing these tasks. Suggested tasks for non-computer work were “ordinary office work” with examples (reading ordinary mail, conversations, reading, getting and storing hard copy files, copying, hand writing, drawing and calculating, telephone calls), “work site visits”, “meetings” and “other work without a computer”. Suggested work tasks for computer work were “computer aided design (CAD) work”, “layout, graphics”, “Geographical Information System (GIS) work”, “stock lists”, “other data entry work incl figures or text from another source” and “other work with a computer” with examples (making calculations, writing texts, programming, information retrieval, emails and similar work). Respondents were asked to sum hours for all work tasks and make any necessary corrections in order to ensure the sum was equal to their average weekly work time during the previous four working weeks. They were instructed to include overtime and to exclude lunch breaks.
The sum of hours doing specified computer tasks is our measure of self-reported weekly computer usage time (h/w).
We also included the questions “How large a proportion of your work time do you work at a computer screen?”; “When you work with a computer, how large a proportion of the time do you actively work with the mouse (clicking, dragging and holding the mouse)?”; and “When you work with a computer, how large a proportion of the time do you actively work with the keyboard (hitting the keys)?” Response options were “almost all of the time”, “approximately ¾ of the time”, “approximately ½ of the time”, “approximately ¼ of the time”, “approximately 1/10 of the time” and “never/almost never”. Response options were given the weights 1.0, 0.75, 0.50, 0.25, 0.10 and 0.0. If the sum of mouse and keyboard proportions exceeded unity they were proportionately reduced. Mouse and keyboard proportions were multiplied with computer usage time (h/w), resulting in estimates of mouse usage time (h/w) and keyboard usage time (h/w). Finally, the respondents were asked whether they used their right, left or both hands when using the mouse.
Psychosocial work characteristics were recorded by a standardised Danish modification of the Job Content Questionnaire.21,22 Three dichotomised variables were created from three scales concerning job demands, job control and social support at work.
Four global questions on personality aspects were used to estimate trait anxiety, type-A behaviour, self-efficacy and being worried about one’s health, using a seven-point ordinal response scale.11–14 Scales were dichotomised into high and low levels of these traits.
Regional pain during the seven days before filling out the questionnaire were recorded for the neck and the right and left shoulder, elbow, forearm and hand/wrist. Response categories were “no pain”, “very mild”, “mild”, “mild to moderate”, “moderate”, “moderate to severe”, “severe” and “very severe pain”, scored from 0 to 7.
WorkPace Recorder data
The WPR software records the time of any input events from the keyboard (keystrokes) or mouse (clicks and movements) to the computer. Intervals between input events were used to estimate computer usage time, mouse usage time and keyboard usage time. Mouse and keyboard event-series with intervals of less than 5 seconds between events were summed on a daily basis and formed the measure of mouse and keyboard usage times, respectively. For computer usage time an interval of 30 seconds was used as a criterion, allowing for reading from the screen and thinking about the next input move to be included in the measure of computer usage time. In order to reduce a huge amount of data, we summed daily statistics to weekly values to form WPR computer time (hours per week (h/w)), WPR mouse time (h/w) and WPR keyboard time (h/w). For comparison with the questionnaire data, a WPR computer time proportion was calculated as WPR computer time (h/w) divided by self-reported weekly work hours. WPR mouse and keyboard proportions were calculated from the corresponding WPR times (h/w) divided by WPR computer time (h/w).
Analysis
Questionnaire and WPR data on computer, mouse and keyboard times and proportions were compared by their distributions and simple correlations. The relations between WPR and questionnaire data were further examined by regression analysis with WPR data as the dependent variable and the corresponding questionnaire data as explaining variable. The 95% confidence interval of the predicted WPR value was calculated as ±2 times the standard deviation of the differences between the predicted and observed WPR values.
We also examined if questionnaire data were systematically influenced by other factors than WPR data. We hypothesised that self-reports of computer activity might be influenced by workplace psychosocial factors (job demands, control, social support and strain) and personal factors (personality traits, age and gender) and present pain status. These hypotheses were tested in regression analyses of questionnaire data on computer, mouse and keyboard times and proportions as outcome variables and the following covariates as explaining variables: the corresponding WPR data variable, present pain status, job demand, job control, social support at work, work-related strain (interaction term between high demands and low control), age, gender and the four personality trait variables.
The standard deviation (SD) of the four weeks of recordings of the WPR-variables was also included in the model. The SD is high if the four weeks are composed of weeks with little and weeks with much computer work. Thus, a positive effect of the SD may indicate that the questionnaire four-week average was inflated by weeks with computer work above the average.
Two aspects of pain were included in separate analyses; one was arm pain status, the other neck-shoulder pain status. Arm pain status was defined as the maximum of 7-day pain scores (0–7) for the elbow, forearm and hand/wrist regions, and neck-shoulder pain status as the similar maximum pain score for the neck and shoulder regions. In the analyses of computer and keyboard variables both the right and left side regions were included. In the analyses of mouse time variables only the regions on the side that operated the mouse were included. The pain variables were included as continuous variables.
To account for non-linear effects of WPR variables we further included the squares of these variables into the models. Preliminary analyses did not indicate non-linear effects of other continuous variables (age and pain status). The full models were reduced by backwards stepwise elimination of covariates with no significant effect (p⩾0.10).
RESULTS
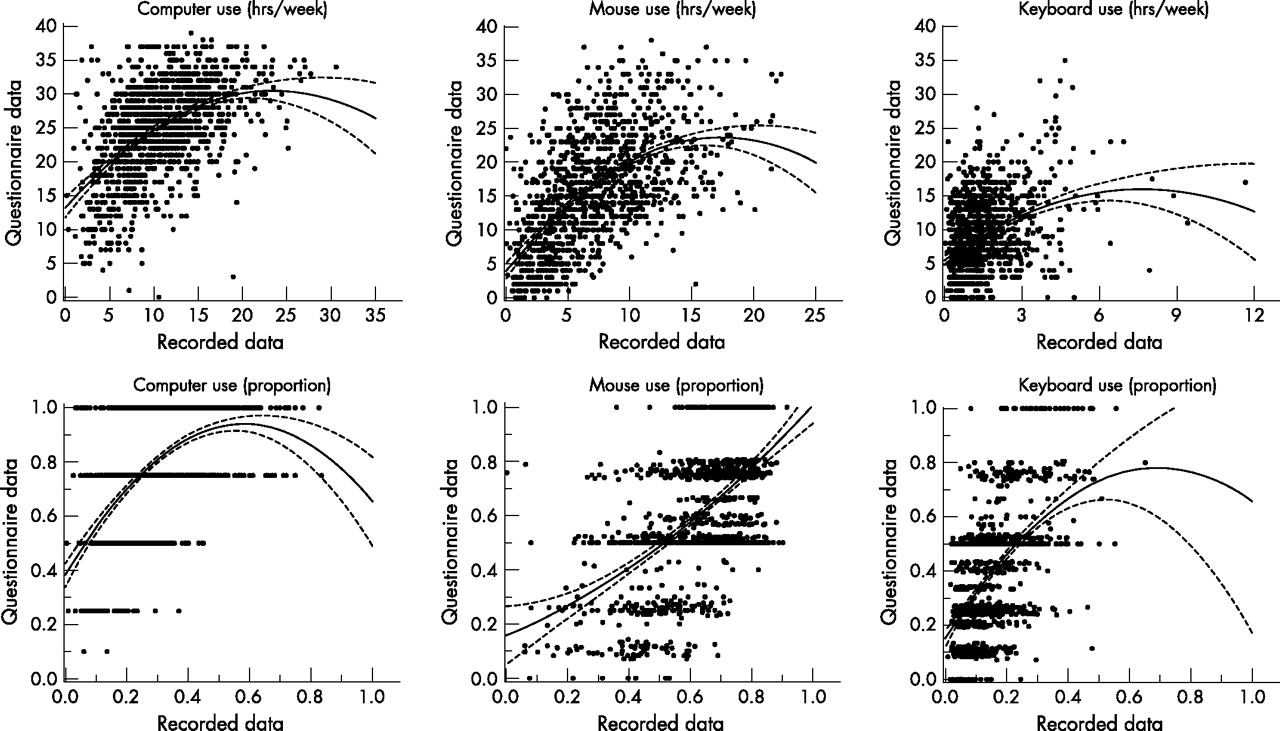
Overall, self-reported computer time averaged 25 h/w but only 11 h/w by WPR (table 1). Total computer use and mouse use were better correlated than keyboard use (fig 1).
Description of the material (n = 1211)

Scatter plots of questionnaire data versus objectively recorded data on computer, mouse and keyboard usage (hours per week and proportions, see text) during the same four-week period (n = 1211). The lines are regression lines with 95% confidence intervals (y = βx + βx2).
The mean questionnaire computer and mouse times (h/w) and computer and keyboard time proportions were approximately 2.3–2.6 times higher than the corresponding WPR variables. The mean questionnaire keyboard time (h/w) was approximately six times higher than the corresponding WPR variable, and the mean questionnaire mouse time proportion was the same as the corresponding WPR variable (table 1).
The relative overestimation of self-reported computer, mouse and keyboard times (h/w) and computer and keyboard time proportions were higher at low levels of the corresponding WPR variables than at high levels, as shown in table 2. Mean mouse time proportions were very similar for questionnaire and WPR data at low, medium and high levels of WPR mouse time proportions.
Distribution of questionnaire and WPR-data on computer, mouse and keyboard times (h/w or proportions)*
Spearman correlation coefficients for corresponding computer, mouse and keyboard times (h/w) were 0.51, 0.61 and 0.36, respectively, and for corresponding time proportions 0.52, 0.51 and 0.52, respectively.
Questionnaire data explained only a small proportion of the variance of WPR data. The adjusted R2 in the regression models varied between 0.25 and 0.34 except for keyboard time with an adjusted R2 of 0.13. The large unexplained variation in WPR data may also be expressed as the 95% confidence interval band for the difference between observed and predicted WPR times and proportions. For WPR computer time the 95% confidence interval band was estimated to be ±8.8 h/w; for WPR mouse time ±6.8 h/w; for keyboard time 2.2 h/w; for WPR computer time proportion ±0.24; for WPR mouse time proportion ±0.26; and for keyboard time proportion ±0.16. These are large unexplained variations compared to the mean values of the WPR variables (table 1).
Table 3 shows the results of the analyses that were made to examine if factors other than WPR times and proportions influenced the corresponding questionnaire variables. The largest part of the variation in questionnaire data on computer, mouse and keyboard times and proportions was unexplained by the covariates examined. The adjusted R2 varied between 0.30 and 0.38, except for the keyboard time (h/w) model (0.16). Almost all of the variance explained by the models was due to the effect of the WPR-variable (data not shown).
Results of multiple regression analyses of questionnaire computer, mouse and keyboard times (h/w or proportions) versus the corresponding WPR-variables, arm pain status, gender, age, psychosocial work place factors and personality factors
In the regression analyses the pattern of decreasing self-report overestimates with increasing WPR times was reflected in significant negative effects of the squared terms of the WPR variables, except for mouse time proportion. The squared term of WPR mouse time proportion had a significant positive effect on the corresponding questionnaire variable but the effect was weak, as reflected by the regression line for mouse time proportion in figure 1.
The effects of the standard deviations of computer, mouse and keyboard times (h/w) were all positive and significant, indicating that the corresponding questionnaire data could be inflated by weeks with more than average computer usage (or vice versa). This was also the case for computer time proportion, but not for mouse and keyboard time proportions. The effects were modest. Based on the distributions of the standard deviations shown in table 1 and the effects of a one-hour increase in the standard deviations shown in table 3, one can calculate that only a small minority in the material would have their average four-week questionnaire times inflated by more than a few hours owing to their inappropriate weighting of weeks with more than average computer work.
Maximum arm pain had a significant effect on all time and proportion variables. The effects were positive for computer time (h/w), mouse time (h/w) and computer and mouse time proportions, but negative for keyboard time (h/w) and keyboard time proportion. The largest effect for time variables was that for mouse time, 0.34 h/w of a one unit increase in pain score. Since the maximum pain score was 7, the maximum effect would be 2.4 h/w. Only a few had more than mild pain (table 1). Thus, the bias in questionnaire computer time variables owing to arm pain was small.
The results for the corresponding analyses including neck-shoulder pain instead of arm pain showed similar effects but they were not significant (data not shown).
Female gender increased questionnaire computer, mouse and keyboard times (h/w) and computer time proportion, but not mouse and keyboard time proportions. The effects were small (0.8–1.5 h/w). Increasing age was associated with a decrease in self-reported computer and mouse times (h/w) and proportions, and an increase in keyboard time (h/w) and keyboard time proportion. The effect was small. The largest effect of a 10-year increase in age for the time variables was a decrease of 0.78 h/w for keyboard usage time.
Work place psychosocial factors had no significant effects except for high demands on computer time proportion. Personality traits had no effects except for a small negative effect of low self efficacy on keyboard variables. This effect was in the opposite direction of the expected.
DISCUSSION
The main results of this study were that self-reports of computer times and proportion were positively associated with objective recordings but explained only a rather small proportion of their variation; that self-reports overestimate times and proportions (except for mouse time proportion); that the relative overestimation is largest at low objective activity levels and declines with increasing objective activity (except for mouse time proportion); and that variability in objective activity, arm pain status, gender and age could influence self-reports in a systematic way.
Thus, on one hand our results indicate that self-reports on computer activity, excluding keyboard time (h/w), could be used in epidemiological studies; on the other hand the systematic deviations of self-reports from a 1:1 relation with objective activity measures may bias the results on the relation between computer activity and musculoskeletal pain and disorders.
The NUDATA study was designed to examine computer work relations with neck and arm disorders of clinical relevance—for example, epicondylitis and tendonitis—assuming that such disorders were more likely to develop from cumulated rather than short-lasting musculoskeletal loads related to computer work. We therefore chose a “long” recall period (four weeks) to have a more representative estimate of usual computer activity than supplied by a “short” period (for example, one day or a week).
By specifying hours with different computer and non-computer work tasks, summing up to weekly work hours, we hoped that self-reported hours working with computer tasks might be reliably assessed by the respondents. We considered that this might not be the case for generic aspects of computer work, such as mouse and keyboard hours, and therefore only asked the respondents to estimate the proportions in coarse categories of mouse and keyboard usage when using the computer. Mouse usage time and keyboard usage time were then estimated from this information. Thus, inaccuracies in self-reported computer usage time may be transferred to the estimates of mouse and keyboard times even if the proportion assessments were precise. Our poor results for keyboard time (h/w) may reflect the combined effect of inaccuracies in computer time (h/w) and keyboard time proportion.
When using the WPR data as the “gold” standard by which the validity of questionnaire data is judged, one has to be aware, however, that the WPR rules for computer, mouse and keyboard usage times are somewhat arbitrary. They are based on educated guesses that periods of no recorded activity for more than 30 seconds imply that the subject is not working with the computer, and similarly that no recorded keyboard or mouse activity for more than five seconds implies that the subject is not working with these input devices. It is further assumed that if these time limits are not exceeded, the subject is working with the computer, mouse or keyboard.
WPR computer usage time, using a 30-second activity criterion, has been validated by one-hour observations of subjects doing ordinary office work, including computer work, using video films and subsequent stopwatch recordings of periods with computer work. The WPR and observed computer times showed a very high degree of accordance between the two methods.23 In a recent study, Homan and Armstrong19 measured keyboard and mouse times during a working day by electronic activity monitoring, using the same five second activity criterion as we used, and by a work sampling visual observation method. They found that the two measurement methods were in very good accordance for mouse times as well as keyboard times. Thus, our WPR time definitions seem to correspond well to systematically recorded visual observations of computer, mouse and keyboard work.
A few other studies have examined the relation between self-reports and objective measures of computer usage.17–20 Three of these studies compared objective computer usage measures with corresponding end-of-day self-reports,17–19 and one study compared self-reported “mean” computer, mouse and keyboard times, recorded as percentages of working time, with objective computer, mouse and keyboard times recorded by WPR for 15 working days, starting a few weeks after filling the questionnaire.20
We found moderate correlations (0.51–0.61) between computer times (h/w), mouse times (h/w), and computer, mouse and keyboard time proportions. The correlation between keyboard times (h/w) was poor (0.36). Previously reported correlations between self-reported and objective computer times (h/w) were 0.50, 0.78 and 0.46.18,1929 Keyboard and mouse time (h/w) correlations have only been reported by Homan and Armstrong.19 They found a keyboard time correlation of 0.78 and a mouse time correlation of 0.71. Our corresponding results were 0.36 and 0.61. The higher correlations in the study of Homan and Armstrong19 could be expected as they used a self-report recall period of only one day, whereas we used a recall period of four weeks. Our especially low correlation of keyboard times (h/w) may be further explained by a much lower and narrower keyboard time distribution than in the study by Homan and Armstrong.19 Our moderate correlation coefficients correspond to the low degree of variation of WPR data that was explained by questionnaire data. In questionnaire studies on the relation between musculoskeletal disorders and computer work, the errors in questionnaire data will reduce the statistical power of the study, but if they are randomly distributed around the true computer activity levels (± a constant) and independent of the outcome, they will not distort estimates of the relation between exposure and outcome.
Our mean questionnaire computer and mouse times (h/w) and proportions, and keyboard time proportion were overestimated by a factor of 2.3–2.6, and keyboard time (h/w) by a factor of 6 compared to the corresponding WPR variables. This overestimation was more pronounced at low levels of WPR activity and decreased with increasing WPR activity, except for questionnaire mouse time proportion which was almost identical to the WPR mouse time proportion irrespective of the WPR activity level. Other studies quite consistently show that self-reports on computer work times (h/w) are overestimated compared to objective measures.17–20 At first glance the reported overestimations seem to vary between studies. However, when considering the objective activity level the degree of overestimation in other studies and in our study seems remarkably similar, confirming the overestimation pattern from low to high objective computer activity. One study did not find this pattern.20 This overestimation pattern could bias a true exposure-outcome relation towards the null hypothesis of no trend.
Questionnaire computer, mouse and keyboard times (h/w) and computer time proportion seemed to be modestly inflated by weeks with more than average computer work. The same effect was not found for mouse and keyboard time proportions. No other studies have reported on this phenomenon that could bias a true exposure-outcome relation towards the null hypothesis of no trend.
Arm pain had a small positive effect on all questionnaire computer and mouse times and proportions, and a small negative effect on keyboard time and proportion. Neck-shoulder pain had no significant effects. As arm pain effects were not in the same direction for all variables, we believe that these effects should be interpreted with caution. Faucett and Rempel18 and Heinrich et al20 found no effects of symptom reporting on the difference between self-reported and observed computer times. The problem of pain effects on self-reported computer work aspects is of course very important when interpreting the nature of associations between arm pain and self-reported computer work times. One problem in this context is that a pain effect on self-reported computer work times could vary between studies, depending on the setting of the study.24
Psychosocial work characteristics and personality aspects played no convincing roles in explaining the differences between questionnaire and WPR data on computer activities. We found a few scattered effects. High demands slightly increased over-reporting of the computer time proportion. Low self-efficacy was associated with less over-reporting of keyboard variables, the direction being in the opposite direction to the hypothesised. Faucett and Rempel18 found a modest positive effect of high demands on computer usage time, but no significant effects of decision latitude or social support at work, compatible with our results.
One interesting aspect of our study was that it was possible to conduct a large scale epidemiological study using objective measures of exposure. The participation rate with respect to installing and returning WPR data was rather low (38%), however, but participants who returned data did not differ very much from those who did not with respect to questionnaire data on computer work and musculoskeletal pain (data not shown). Considering that the study covered more than 3000 workplaces with different software platforms and policies for software installation, we find the participation rate quite satisfactory. Much higher participation rates in large epidemiological studies using electronic activity recordings can probably be expected in studies concentrated in a few large companies. Thus, the problems of the validity of questionnaire estimates on computer activity may soon be of only historic interest, and it is recommended that future studies on the relation between computer activities and musculoskeletal pain use electronic activity measures of computer work.
The WPR data showed that the technical assistants and machine technicians in our study mainly used the mouse as an input device, and that keyboard usage times were very low and had a narrow distribution. These differences in mouse and keyboard usage were not very marked in questionnaire self-reports on usage times. These findings may possibly be explained by the fact that some of the main work tasks of our participants (for example, computer-assisted design) include the simultaneous use of mouse and keyboard. However most inputs are made with the mouse, while keyboard inputs are less frequent and of short duration. The participant may feel that the keyboard usage time is not so much different from mouse usage time because the keyboard is used regularly during mouse work. The WPR data, however, may record a large difference. These aspects are, of course, important when considering the representativeness of our study.
Furthermore, we want to emphasise that our results are representative only of working weeks with computer activity. We excluded 440 participants with one or more weeks without WPR activitity during the four weeks prior to filling in the questionnaire. The main reason for doing so was that the questionnaire referred to working weeks, but we did not know for sure if weeks without WPR activity were working weeks or weeks of vacation, sick leave or other leave.
Main messages
-
Self-reports on computer, mouse and keyboard activity were positively associated with objectively measured activity, but the validity was low.
-
Self-reports explained only between a quarter and a third of the variance of objectively measured activity for five of six measures, and even less for the last measure.
-
Overestimation was large at low levels and declined with increasing levels of objectively measured activity for all but one measure.
-
Self-reported activity may be biased by systematic effects of arm pain, gender, age and variation in objective activity, but the effects seemed modest.
-
The results of epidemiological studies on the relation between self-reported computer work and neck and upper extremity disorders may be biased by inaccuracies in self-reported computer activity. False positive as well as false negative associations may occur and effect-exposure relations may be distorted.
Policy implications
-
Present guidelines on safe limits with respect to duration of computer work and musculoskeletal disorders may have to be re-evaluated.
-
Future research on the relation between computer work and adverse health effects should use objective recordings of computer work.
Altogether, self-reports on computer work activity have low validity. They do reflect objective computer work activity, but they are not very precise and they overestimate this activity, especially at low levels. Variations in computer activity, arm pain status, gender, and age may systematically influence self-reports, but these effects seem to be modest. They could, however, bias the results of studies on the relation between computer work activity and musculoskeletal pain and disorders. With the advance of software for electronic monitoring of computer work activities, the problem of precision and bias in self-reports on computer work activity may soon become an irrelevant problem in future studies on the relation between computer work and musculoskeletal disorders.
Acknowledgments
We want to thank Dr Lars PA Brandt, Department of Occupational and Environmental Medicine, Odense, Denmark and Dr Erik Overgaard, Århus for their contributions to the design of the study and the acquisition of data.
REFERENCES
Footnotes
-
Published Online First 26 March 2007
-
Funding: Danish Medical Research Council; grant number 9801292, Danish Ministry of Employment, via National Work Environment Authority; grant number 20000010486.
-
Competing interests: None.