Article Text

Abstract
Objectives: The Survey of Occupational Injuries and Illnesses (SOII), based on Occupational Safety and Health Administration (OSHA) logs, indicates that the number of occupational injuries and illnesses in the US has steadily declined by 35.8% between 1992–2003. However, major changes to the OSHA recordkeeping standard occurred in 1995 and 2001. The authors assessed the relation between changes in OSHA recordkeeping regulations and the trend in occupational injuries and illnesses.
Methods: SOII data available from the Bureau of Labor Statistics for years 1992–2003 were collected. The authors assessed time series data using join-point regression models.
Results: Before the first major recordkeeping change in 1995, injuries and illnesses declined annually by 0.5%. In the period 1995–2000 the slope declined by 3.1% annually (95% CI −3.7% to −2.5%), followed by another more precipitous decline occurring in 2001–2003 (−8.3%; 95% CI −10.0% to −6.6%). When stratifying the data, the authors continued to observe significant changes occurring in 1995 and 2001.
Conclusions: The substantial declines in the number of injuries and illnesses correspond directly with changes in OSHA recordkeeping rules. Changes in employment, productivity, OSHA enforcement activity and sampling error do not explain the large decline. Based on the baseline slope (join-point regression analysis, 1992–4), the authors expected a decline of 407 964 injuries and illnesses during the period of follow-up if no intervention occurred; they actually observed a decline of 2.4 million injuries and illnesses of which 2 million or 83% of the decline can be attributed to the change in the OSHA recordkeeping rules.
- BLS, Bureau of Labor Statistics
- NEISS, National Electronic Injury Surveillance System
- OSHA, Occupational Safety and Health Administration
- SOII, Survey of Occupational Injuries and Illnesses
Statistics from Altmetric.com
- BLS, Bureau of Labor Statistics
- NEISS, National Electronic Injury Surveillance System
- OSHA, Occupational Safety and Health Administration
- SOII, Survey of Occupational Injuries and Illnesses
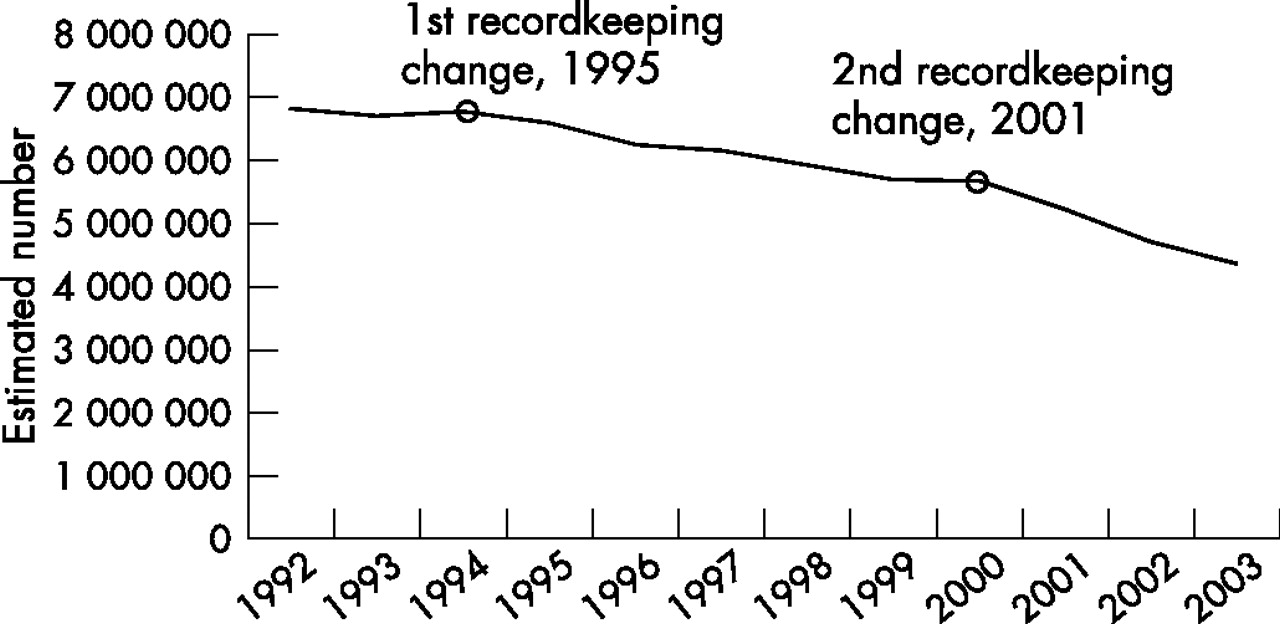
In the US, national data have shown that the number and rate of occupational injuries and illnesses has sharply declined between 1992 and 2003 (fig 1). The Bureau of Labor Statistics (BLS) and the Department of Labor have interpreted these secular trends in occupational injuries and illnesses to mean that the US workplace has been getting safer.1,2 The data for occupational injuries and illnesses are based on the Survey of Occupational Injuries and Illnesses (SOII) database, which is a national survey of employers.

Occupational injuries and illnesses in the US workforce, 1992–2003.
Alex Herman, Secretary of Labor in 1999, stated “workplace injury and illness rates declined in 1999 for the seventh straight year—nearly a 30% drop since 1992. This steady trend downward shows that employers and workers are making occupational safety and health a high priority. That’s good news for business, workers, and all Americans. Injuries and illnesses dropped 4% in 1999 even though employment rose 2%. That means 200 000 more workers went home to their families without a job related injury or illness than in 1998 (OSHA, 2000).”
However, the primary data sources for SOII are based upon OSHA injury logs maintained by employers. As employers only have to report those injuries and illnesses that are legally mandated by the OSHA recordkeeping standard, major changes in OSHA’s recordkeeping requirements and OSHA’s ability to enforce recordkeeping violations can in turn affect secular trends in injuries and illnesses.
In February 1996, OSHA proposed changes to the casualty recordkeeping procedures required of employers. A new recordkeeping rule (29 CFR 1904.17) took effect in 1997, but had already been applied to the SOII data collection procedures in 1995 and 1996 under the Office of Management and Budget Paperwork Reduction Act of 1995.3 The rule change stipulated that data collection would be conducted by mail or electronic transmissions.3,4 In 1995 OSHA requested 80 000 employers to submit 1995 injury and illness data directly to OSHA as would be required in the proposed 1997 rule. The initial request received a 92% response rate.4 However, before 1995, the recordkeeping standard specified that employers were to “permit access to” or “make available” data to OSHA during on-site visits if requested.3 OSHA’s access to employer documentation for the SOII survey became more limited under the revised 1997 regulation.3
Then in 2002, a new OSHA recordkeeping rule was adopted.5 Although the rule change for OSHA recordkeeping took effect in January 2002, the mandated annual reporting of occupational injuries and illnesses by employers occurs between February and April. Therefore, 2001 injuries and illnesses were recordable under the new 2002 rule. The new regulation dramatically changed which casualties were deemed “recordable”, and in most cases a more exclusive definition was implemented. Table 1 shows the key changes and the possible effect on reporting. In this paper we analyse the relation between changes in OSHA recordkeeping regulations occurring in 1995 and again in 2001, and the trend in occupational injuries and illnesses.
2002 OSHA rule change: defining recordable cases*
METHODS
Based on the Survey of Occupational Injuries and Illnesses (SOII), the Bureau of Labor Statistics calculates national estimates of occupational injuries and illnesses. For this analysis we used SOII data for the years 1992–2003.6 The SOII data are based on OSHA injury and illness logs. The SOII survey uses a multistage stratified sampling method and appropriate sample unit and non-response weights.7
In this analysis we include only cases and rates of injuries and illnesses occurring in the private industry sector. Employers are required to report only recordable cases of injury and illness as mandated by the OSHA recordkeeping regulation. Employers who would normally not be required to maintain OSHA logs but who are selected for SOII are contacted one year before the survey and instructed on the methods of maintaining OSHA logs. An injury or illness resulting in lost worktime, loss of consciousness, restriction of work or motion, transfer to another job, or medical treatment other than first aid are recordable.
We report on the distribution and trend in injuries involving days away from work.8 Lost workday cases are those that involve days away from work, or days of restricted work activity, or both. Restricted activity involves cases where employees are assigned to different jobs on a temporary basis, or work at their normal tasks part-time, or the employees continue to do work at their normal tasks but are limited in the ability to perform all their normal tasks.
The BLS used the Standard Industrial Classification system for identifying industries between 1992 and 2002. In 2003 the BLS switched to the North American Industry Classification System (NAICS). Because there are major differences between the two classification systems, we do not use 2003 injury and illness data in the time trend analyses of industrial sectors. We report injury and illness data for the following industrial sectors: agriculture, forestry and fishing; mining; construction; manufacturing; transportation and public utilities; wholesale and retail trade; and services. Based on BLS injury and illness data, we classify the following industries as high-risk: natural resources and mining, construction, manufacturing, utilities, transportation and warehousing. Low-risk industrial sectors included all sectors not included in the high-risk group.
Statistical methods
We evaluate the overall trend in estimated injuries and illnesses during the period of 1992–2003 using SAS (v 9.1; SAS Institute Inc, Cary, North Carolina, USA). We set up an autoregression model (PROC AUTOREG)9 and controlled for annual productivity (1992 index year), number employed in the civilian workforce, average hours of production and gross domestic product.10 Productivity is described in terms of output per hour worked. Average hours of production are the mean hours of production for non-supervisory workers on private non-farm payrolls. We used the seasonally adjusted, annualised gross domestic product in terms of billions of 2005 dollars. We used the Durbin-Watson statistic to test for first-order autocorrelation. We report a Pearson’s correlation coefficient for the relation between employment in the US workforce and estimated injuries and illnesses
We use join-point regression analysis11,12 to analyse changes in time trends in cases of injuries and illnesses. The join-point regression method is available in a software package distributed by the National Cancer Institute (v 3.0).13 The method tests the null hypothesis that no significant changes in the slope of injuries and illnesses occur during the observation period (1992–2003) against a series of alternative hypotheses. The software provides the estimated year in which a significant period of change occurs. The user does not define the years at which join-points occur. We initially tested the null hypothesis using a maximum of three changes in slope with an overall significance level of 0.05 divided by the number of join-points in the final model. The join-point regression models with a Poisson distribution were based on log-transformed data. The slope in the join-point regression model represents the estimated annual per cent change in cases or injury rates per 100 equivalent full-time workers during the period of observation. We use the global F test test derived from the join-point regression analysis to evaluate the final alternative hypothesis against the null hypothesis.
RESULTS
Trends in reported cases
In 2003, there was an estimated 4.4 million non-fatal injuries and illnesses occurring among employees of the private sector (4.1 million injuries and 0.3 million illnesses) for a rate of 5.0 cases per 100 equivalent full-time workers. This is down from an estimated 6.8 million non-fatal injuries and illnesses in 1992. Injuries make up 93.2% of the total estimated cases. Approximately 52.3% of all reported injuries and illnesses (2.3 million; 2.6 per 100 workers) in 2003 required the employee to miss days of work, transfer jobs, or limit duties at work (table 2).
Estimated number of occupational injuries in thousands, illnesses and lost workday cases, survey of occupational illnesses and injuries, private sector only 1992–2003
Time trend in injuries and illnesses
Based on a multivariable autoregression model, injuries and illnesses showed a significant decline in number between 1992–2003 (−301 714 annually; p<0.001) when controlling for productivity, gross domestic product, number employed in the civilian workforce and average hours of production per week in private sector.
The join-point regression analysis demonstrated a significant decrease in recorded injuries and illnesses occurring in 1995 and after (p<0.01). Another significant decrease in the number of injuries and illnesses occurred in 2001 and after (p<0.01) following the 2002 rule change. The annual change in slope of the injuries and illnesses during 1992–4 was −0.5% (95% CI −3.05% to 2.05%) which was followed by a greater negative slope in the period 1995–2000 (−3.1%; 95% CI −3.7% to −2.5%) and another steeper decline in 2001–3 (−8.3%; 95% CI −10.0% to −6.6%) (fig 1). The join-point regression analysis showed no statistical evidence that there existed more than two significant variations in the trend of injuries and illnesses over the decade (global F test, p<0.01).
A join-point regression model evaluating injuries alone reiterated the findings of the aggregate model with both injuries and illnesses combined. The slope of the number of estimated injuries significantly declined from a negative 0.9% (1992–4; 95% CI −3.3% to 1.5%,) to a negative 2.8% in 1995 to 2000(p<0.01; 95% CI −3.4% to −2.3%) which was followed by a second more precipitous negative decline of 8.3% in 2001–03 (p<0.01; 95% CI −9.6% to −6.9%; global F test, p<0.01).
For the estimated number of illnesses alone, we only observed a reversal in the trend in 1995 from an annual average increase of 6.6% (1992–4; 95% CI −1.2% to 14.4%) to a negative 6.8% (1995 forward; 95% CI −7.6% to −6.0%). The reversal in trend occurring in 1995 was significant (p<0.01). The join-point regression analysis did not provide evidence that more than one significant variation occurred between 1992–2003 (global F test, p<0.01).
When we evaluated the incidence rates for all injuries and illnesses combined, a significant change in slope occurred in 1995 but not 2001. Between 1992 and 1994 the rate was declining by −2.5% annually (1992–4; 95% CI −6.3% to 1.5%) and decreased further to −5.7% (1995–2003; 95% CI −5.8 to −5.2; global F test, p<0.01). A model, which identified a second join-point in 2001, was marginally significant (p = 0.069). However, when incidence rates were stratified by injuries only or illnesses only, we did not observe any significant join-points.
Cases involving lost workdays
The total estimated number of lost workday cases declined by 22.1% from 2 953 400 to 2 301 900 between 1992 and 2003 (table 2). Cases of employees away from work because of injuries and illnesses showed a continual decline of 43.6% between 1992–2003, in contrast cases of injuries and illnesses resulting in restricted work or a job transfer increased during most of the period of follow-up with a steadying off after 1997 (table 2).
The slope of the estimated cases involving lost workdays during 1992–4 was +1.1% and showed a reversal in trend in the period 1995–2000 (−1.8%; 95% CI −2.8% to −0.8%; p = 0.03) and then in 2001–3 the slope of estimated cases grew steeper (−5.1%; 95% CI −7.5% to −2.7%; p = 0.02; global F test, p = 0.01).
Within both subgroups of cases involving days away from work and restricted/transfer work, we did not observe any significant time trends. However, the case-mix changed dramatically as injured workers were more likely to be placed on some form of restricted work rather than be sent home. Despite the large change in case-mix of days away from work and restricted/transfer days during the period of follow-up, the cumulative lost days showed the consistent reporting pattern changes in 1995 and 2001 observed among all cases of injuries and illnesses. No significant changes in incidence rates based on lost work days were observed.
Trends within industries
All industrial sectors showed a decline in the number of estimated injuries and illnesses (table 3). The largest decrease in estimated number of injuries and illnesses between 1992–2002 occurred in mining (−51.3%) and the smallest decrease occurred in the services sector (−18.1%).
Estimated number of occupational injuries and illnesses in thousands by industry sector, survey of occupational illnesses and injuries, private sector only 1992–2003
Within high-risk industries the estimated injuries and illnesses during 1992–4 was increasing slightly +0.4% and showed a reversal in 1995–2000 (−3.6%; 95% CI −4.4% to −2.8%; p = 0.002) and grew steeper in 2001–2 (−12.9%; 95% CI −16.6% to −9.2%; p = 0.007; global F test, p = 0.002). Among low-risk industries, we observed only one significant change in slope occurring in 2001 from −2.3% to −4.7% (95% CI −8.0 to −1.4%; global F test, p = 0.038)
Only within the manufacturing sector did we observe two significant changes in the trend of occupational injuries and illnesses between 1992–2002. The largest proportion of injuries and illnesses occur in this sector. In the manufacturing sector, before 1995 the number of estimated injuries and illnesses were slightly increasing (slope, +0.3%; 95% CI −4.6% to 5.2%), but the trend reversed in 1995 (slope, −4.9%; 95% CI −6.1% to −3.7%; p<0.01) and grew steeper in 2001 (slope, −17.3%; 95% CI −23.6% to −11.0%; p = 0.01; global F test, p<0.001).
Only one significant change in trend occurred in the transportation and public utilities sector and the wholesale/retail trade sectors. In the transportation and public utilities sector, we observed a significant reversal in trend in 1995 (p = 0.003; global F test, p = 0.05). In the wholesale and retail trade sectors, the negative trend grew sharper in 2001 (p = 0.04; global F test, p = 0.03). No significant changes in trend occurred in the following industrial sectors: mining, construction, services, and agriculture, forestry and fishing.
When incidence rates were evaluated, a significant change in slope occurred in 2001 in the manufacturing sector (1992–2000: −4.4%, 95% CI −5.3% to −3.5%; 2001–2, −10.2%, 95% CI −18.0% to −1.7%; p = 0.017) and in 1995 in the transportation and public utilities sector (1992–4: +1.6%, 95% CI −9.1% to 13.5%; 1995–2002: −5.1%, 95% CI −6.2% to −3.9%; p = 0.036).
DISCUSSION
We have observed substantial and significant declines in the number of occupational injuries and illnesses reported by the Bureau of Labor Statistics in 1995 and 2001. These precipitous declines are associated with two major changes to the OSHA recordkeeping standard.
Possible explanations for the observed changes
Employment
Between 1992 and 2000, the total number of employees in the private sector and the average hours of production for non-supervisory workers on private non-farm payrolls increased each year.10 In 2001, corresponding with the economic recession, both declined modestly through 2003.10 Given the large rise in the workforce and increase in productivity we would expect these factors to contribute to an increase in injuries and illnesses because hours-at-risk are increasing across the population, but in fact we observed a sharp decline in injuries and illnesses through the period of follow-up.
Numerator-denominator bias
The data in this study suffer from a numerator-denominator bias,14–17 which produces downwardly biased rates and obscures changes in the trend of incidence rates during the period of follow-up, particularly the “elbows” in 1995 and 2001. For this reason, we focused our analysis on counts rather than rates. Two factors contribute to this bias: (1) the numerator is routinely undercounted over time relative to the denominator, and (2) the denominator is not affected by gross undercounting while simultaneously increasing during the period of follow-up, which results in a strong negative relation between injuries/illnesses and employment. Using statistical models of occupational fatality data, Bena and colleagues14 have shown that both of the above mentioned factors substantially bias the trend in rates.
Generally, there is an assumed relation between a numerator and a denominator. In the case of occupational injuries and illnesses, we would expect a direct relation between employment and injuries/illnesses because hours-at-risk are increasing across the population, unless there is some type of intervention such as improved safety measures, underreporting, changes in reporting, and changes in case-mix.
However, overall FTE is strongly and negatively correlated with estimated injuries and illnesses (r = −0.83, p<0.01). Employment rose throughout the 1990s and steadied off between 2000 and 2003, while injuries and illnesses steadily declined. In 1996 there was a significant increase in the slope of FTE (p<0.01; join-point analysis), while injuries and illnesses showed a greater decline in 1995. Then in 2001 there was a significant decline in slope of FTE (p = 0.005) in conjunction with a decline in injuries/illnesses. Therefore, not only is there a strong negative relation between the numerator and denominator, but also it appears that fluctuations in the denominator are not reflected in the numerator as theory would suggest. This relation between occupational injuries/illnesses and FTE contributes to the numerator-denominator bias, which has been shown to result in substantial biased estimates of the slope of rates.14 Because we are interested in general time trends and not specific rates, a recommended alternative is to use crude number of cases rather than rates,18 which is the general approach used in this study. Despite the bias in the rates, the join-point regression models continued to only show changes in 1995 and 2001 when using rates instead of counts.
Shift from more to less hazardous employment
The percentage of the US workforce employed in high-risk industries declined only 4% between 1992–2002 (1992, 29.2% to 2002, 25.2%). The recession, which began in 2001, contributed to the observed decline in employment within the high-risk industries, but we saw the large declines in injuries/illnesses beginning in 1995 not 2001. Based on the join-point regression analysis, the annual decline in injuries and illnesses after 2001 was 8.3% compared to less than −1% annually in employment within high-risk industries. In manufacturing, we observed an annual decline of 17.3% in injuries and illnesses in 2001 and afterwards. The annual decline of employment in manufacturing after 2000 was 5.8% as estimated by join-point analysis (table 4). The decline in employment was small relative to the declines in reported injuries and illnesses, and therefore cannot explain the precipitous declines in injuries/illnesses during the period of follow-up, particularly the marked changes in slope in 1995 and 2001.
Annual number of private, non-farm employees by detailed industrial sector in thousands, change in case-mix between 1992–2003 high-risk vs low-risk industries
OSHA regulatory activity and staffing
Between 1990 and 2002, OSHA’s budget rose 65.8% (not inflation adjusted), but this is far lower than the 92.3% average growth in discretionary spending by all non-defence agencies.19 Corresponding with a lower increase in funding relative to other agencies, the number of inspectors has declined slightly from approximately 1300 to 1100 between 1990 and 2003.19 In contrast with the observed significant decline in reported injuries and illnesses in 1995, OSHA inspections decreased 35% between 1994 and 1995.20 Furthermore, it is estimated that OSHA actively regulates only about 20% of the American workforce because of limited resources and a corresponding emphasis on high-risk industries.21 Therefore, any impact OSHA has on occupational safety is limited and changes within the agency would unlikely explain the sharp drop in injuries and illnesses.
Sampling errors
It is unlikely that a bias resulting from the sampling methods explains the observed changes in reported injuries and illness. The SOII surveys use similar sampling methods from year to year. However, variations in estimated injuries and illnesses can occur year to year as a result of the sampling method itself. However, the standard errors are relatively small for the aggregate data and in the stratified industrial subgroups we report in this study.
SOII data may also contain various other errors such as missing data for cases, data entry errors by employers and state/federal employees, and coding errors/inconsistencies. However, BLS survey coders undergo rigorous training in coding and data entry in order to minimise errors. The BLS also identifies questionable responses manually and requests that employers clarify any discrepancies.7
Comparison to other national databases
When we compare the trend in injury and illness data of SOII with the National Electronic Injury Surveillance System (NEISS), we see a conflicting picture as to what is happening in the workforce. The NEISS contains only injuries and illnesses for those who sought treatment in hospital emergency departments and does not include cases treated on the scene, in a doctor’s office or in an occupational medicine clinic. The NEISS represents the more acute and severe injuries which gives us an idea regarding the trend among more severe acute trauma cases. Based on the NEISS, the estimated number of occupational injuries in 1982 was 3.2 million,22 the annual number between 1982–6 was 3.6 million,23 3.3 million in 1996,24 3.6 million in 1998,24 and 3.4 million in 2003.25 In stark contrast to the precipitous decline in injuries reported by SOII, NEISS data show little change over the past 20 years in the number of hospitalisations of injured workers.
Trend in occupational fatalities as reported by the BLS Census of Fatal Occupational Injuries do not show as sharp a decline between 1992 and 2003.6 Overall, fatalities as reported by the Census declined by 8.3% between 1992–2003, but the decline was not monotonic. Before 1995, fatalities increased 8.4% from 5497 to 5959. A drop occurred in 1995 and was followed by a period of relatively little change (−2.7%). In 2001, and especially in 2002, fatalities dropped again resulting in a decline of 5.7% between 2001 and 2003. The 2001 rule change affected reporting of fatalities as well as injuries/illnesses. Another recent study evaluating a population based trauma registry in Illinois also showed no significant decline in work-related severe injuries between 1995 and 2003—in fact the data showed that the rate of injury remained relatively unchanged throughout the period of follow-up.26
Underreporting by employers
In 1986, OSHA confirmed that many employers were underreporting occupational injuries and illnesses.27 In a 1987 study of 192 employers in Massachusetts and Missouri, the BLS found that approximately 10% of employers obligated to maintain OSHA logs failed to do so at all. The 1987 study also noted that injuries were underreported by 10% and injuries involving lost workdays were underreported by 25%.5 Because of these recordkeeping problems identified during the mid-1980s, OSHA threatened to issue large penalties to employers that failed to keep adequate OSHA log files.27 However, only 48 egregious injury and illness recordkeeping citations have been issued since 1986.5
In 1990, the General Accounting Office of the US government issued a report that highlighted the problem of underreporting of occupational injuries and illnesses by employers. The General Accounting Office identified three major reasons for underreporting of injuries and illnesses: “(1) intentional underrecording in response to OSHA inspection policies or employer safety competitions; (2) unintentional underrecording because of a lack of understanding of the recording and reporting system; and (3) inaccurate recordkeeping because of the lack of priority placed on recordkeeping by employers which results in lack of appropriate supervision of recordkeepers.”27 Between 1996 and 1998, OSHA audited 250 establishments each year for recordkeeping errors. Approximately 20% of the audited companies in each year had major coding errors.5 The problem with underrecording did not appear to improve between 1987 and 1998.
However, underreporting is not uniform across all employers. Research indicates that companies with fewer than 100 employees are more likely to inadequately maintain OSHA injury and illness records. Seligman and colleagues28 found that only 60% of companies employing between 10 to 99 employees maintained OSHA log files for injuries and illnesses. Approximately 50% of the companies in the US employ fewer than 100 employees.29 Among companies with 500+ employees, 95% maintained appropriate OSHA injury and illness logs.28
CONCLUSION
The summary information on injuries and illnesses reported on the SOII form is based on OSHA logs. Employers only record injuries/illnesses that are mandated by the OSHA recordkeeping standard. Therefore, changes in the OSHA recordkeeping standard will affect OSHA logs as well as reporting to SOII. In 1995, OSHA began collecting injury/illness logs primarily by mail or electronically. Before 1995, OSHA was permitted to collect information through onsite record reviews even if it was not actualised.3,4 The change in wording alone was probably interpreted (correctly) by employers such that requests for primary documents on-site would be rare. Research shows that many employers fail to report injuries and illnesses, or improperly record them in OSHA logs. Our findings show that the cessation of on-site data collection appears to have exacerbated the underreporting by employers. There are simply too few OSHA compliance officers to ensure proper reporting by the nearly 200 000 SOII respondents while simultaneously addressing compliance issues in high-risk industries.
Then, in 2002 (but affecting 2001 reporting), OSHA revised the recordkeeping standard. Under the new standard, fewer injuries and illnesses were required to be recorded in the new OSHA 300 logs (table 1).
Given the baseline slope showing a negative 0.5% annual change in estimated occupational injuries and illnesses (join-point regression analysis, 1992–4), we expected a decline of 407 964 injuries and illnesses during the period of follow-up if no intervention occurred. But in fact we observed a decline of 2.4 million injuries and illnesses of which 2 million, or 83% of the decline, can be attributed to the change in the OSHA recordkeeeping rules. Based on the findings presented in this study, the changes to the OSHA recordkeeping standard are likely the primary causes for the precipitous decline in estimated injuries and illnesses between 1992 and 2003. Changes in employment, productivity, OSHA regulatory activity and sampling error do not explain the large decline. Researchers have demonstrated that SOII only captures 33–67% of all occupational injuries and illnesses.30,31 The changes to the OSHA recordkeeping standard probably further exacerbated the systematic propensity of certain employers to underreport injuries and illnesses to OSHA and BLS.
Main messages
-
The Survey of Occupational Injuries and Illnesses (SOII), based on OSHA logs, indicates that the number of occupational injuries and illnesses in the US have steadily declined by 35.8% between 1992–2003.
-
However, major changes to the OSHA recordkeeping standard occurred in 1995 and 2001, which substantially affected the process for reporting injuries and illnesses.
-
The large declines in the number of injuries and illnesses correspond directly with changes in the OSHA recordkeeping standard.
-
Changes in employment, productivity, OSHA enforcement activity and sampling error do not explain the large decline.
Policy implications
-
The current SOII survey has obvious limitations and the process of reporting and analysing occupational injuries and illnesses needs to be modified.
-
Government bodies responsible for the data collection should implement more vigorous auditing of companies’ recordkeeping practices and publicise these visits both before and after SOII data collection in order to maximise the impression that these data collection procedures are fair and frequent.
-
BLS should use weights to adjust for known underreporting and underestimating of injuries and illnesses.
The current SOII survey has obvious limitations. We recommend the following changes to the BLS/OSHA survey procedures:
1. OSHA/BLS personnel should randomly sample a subset of SOII respondents and collect the SOII data at the worksite.
2. BLS and OSHA should initiate a more rigorous auditing programme of a subset of SOII respondents similar to the general OSHA audit and verification programme (CPL 02-00-138) in order to better assess SOII reliability. The verification process should include multiple data sources such as workers’ compensation data, OSHA Integrated Management Information System (IMIS) data and state surveillance data.
3. OSHA visits both before and after SOII data collection should be well publicised in order to maximise the impression that these data collection procedures are fair and frequent.
4. BLS should use weights to adjust for known underreporting and underestimating of injuries and illnesses. The weights can either be determined using data from past studies, previous year audits or through a panel of experts to build consensus.
REFERENCES
Footnotes
-
Published Online First 15 February 2007
-
The research was supported in part by the National Institute of Occupational Safety and Health (NIOSH) Training Program Grant # T42/CCT522954-02.
-
Competing interests: None.