Article Text

Abstract
Aims: To analyse the impact of overtime and extended working hours on the risk of occupational injuries and illnesses among a nationally representative sample of working adults from the United States.
Methods: Responses from 10 793 Americans participating in the National Longitudinal Survey of Youth (NLSY) were used to evaluate workers’ job histories, work schedules, and occurrence of occupational injury and illness between 1987 and 2000. A total of 110 236 job records were analysed, encompassing 89 729 person-years of accumulated working time. Aggregated incidence rates in each of five exposure categories were calculated for each NLSY survey period. Multivariate analytical techniques were used to estimate the relative risk of long working hours per day, extended hours per week, long commute times, and overtime schedules on reporting a work related injury or illness, after adjusting for age, gender, occupation, industry, and region.
Results: After adjusting for those factors, working in jobs with overtime schedules was associated with a 61% higher injury hazard rate compared to jobs without overtime. Working at least 12 hours per day was associated with a 37% increased hazard rate and working at least 60 hours per week was associated with a 23% increased hazard rate. A strong dose-response effect was observed, with the injury rate (per 100 accumulated worker-years in a particular schedule) increasing in correspondence to the number of hours per day (or per week) in the workers’ customary schedule.
Conclusions: Results suggest that job schedules with long working hours are not more risky merely because they are concentrated in inherently hazardous industries or occupations, or because people working long hours spend more total time “at risk” for a work injury. Strategies to prevent work injuries should consider changes in scheduling practices, job redesign, and health protection programmes for people working in jobs involving overtime and extended hours.
- overtime
- long working hours
- occupational injuries and illnesses
- fatigue
- stress
Statistics from Altmetric.com
A growing body of evidence suggests that long working hours adversely affect the health and wellbeing of workers. Studies have associated overtime and extended work schedules with an increased risk of hypertension,1,2 cardiovascular disease,3–9 fatigue,1,10–13 stress,14–17 depression,12,18–20 musculoskeletal disorders,21–23 chronic infections,24 diabetes,25 general health complaints,26–28 and all-cause mortality.29 Several reviews and meta-analyses have been published summarising these research findings.30–38 Systematic reviews generally have concluded that long working hours are potentially dangerous to workers’ health. However, existing research is sparse and inconsistent in many areas.
Comparatively few studies have examined the impact of long work hours on workers’ risk for occupational injuries and illnesses. Some studies have detected evidence of a relation between long working hours and an increased risk of occupational injuries among workers in specific occupations and industries, including construction workers,39 nurses,40 anaesthetists,41 veterinarians,42 other healthcare professionals,43,44 miners,45 bus drivers,46 long distance truck drivers,47 fire-fighters,48 and nuclear power plant workers.49 In one of the only studies involving the manufacturing sector, an increased risk of severe hand injuries was found for Hong Kong factory workers working more than 11.5 hours per day.50 A large scale cross-industry study of 1.2 million German workers’ compensation records found that the risks of non-fatal and fatal workplace accidents increase during the latter portion (after the eighth hour) of a long work shift.51,52 Similar findings of an increased risk of work injuries during the latter portion of long shifts has also been observed in studies from Scandinavia and the United Kingdom.53,54 Other researchers have investigated the affect of successive long shifts and the length of rest breaks between shifts as possible risk determinants for industrial accidents.55
Nevertheless, researchers’ understanding of the impact of long working hours on workplace injuries remains incomplete and equivocal. Several investigations have found no evidence of an association,56–59 or have observed a protective effect.60,61 Authorities have noted that many existing studies have serious methodological shortcomings, including small sample sizes, unique industry specific circumstances that limit generalisability of the findings, and the failure to account for potential confounding factors. For example, jobs performed during long working shifts might be inherently more dangerous, or people working in extended-hour schedules might have different personal characteristics (for example, age, gender, or underlying health status) that affect their injury risk. Additionally, the vast majority of existing studies have been performed in Europe, Asia, and Scandinavia. Only a handful of studies have been conducted in the United States, and none of them have involved large sample sizes or study populations representing a mix of industries and occupations.
This article reports on a study of the impact of overtime and extended working hours on the risk of occupational injuries and illnesses among a nationally representative sample of working adults from the United States. The study spans 13 years and draws on information contained in 110 236 job records. Multivariate analyses are employed to control for the influence of workers’ age and gender, region, industry sector, and occupation. The study is based on the hypothesis that working overtime or an extended work schedule increases the likelihood of reporting an occupational injury or illness compared to workers having less demanding schedules. Moreover, we hypothesise that the risk of injury increases with increasing volume of work performed in the demanding schedule.
The conceptual basis for this study is adapted from a theoretical model proposed by Michel Shuster and Susan Rhodes in 1985.62 In this model, overtime and long hours of work are presumed to affect the risk of workplace accidents by precipitating various intermediary conditions in affected workers, such as fatigue, stress, and drowsiness. The pathway linking a demanding work schedule to the intermediary condition and ultimately to a workplace accident can be mediated by a variety of individual and environmental factors, including personal characteristics (for example, age, gender, health status, job experience), job factors (for example, intensity of work, exposure to hazards), and organisational factors (for example, overtime policy, supervision) (see fig 1). Our study analyses the association between exposure to overtime and extended work schedules and the incidence of reported work related injuries and illnesses, adjusting for the influence of several mediating factors, including age, gender, occupation, industry sector, and geographical region. The specific mechanisms by which fatigue, stress, or other intermediary conditions bring about a workplace accident are not investigated in this report.
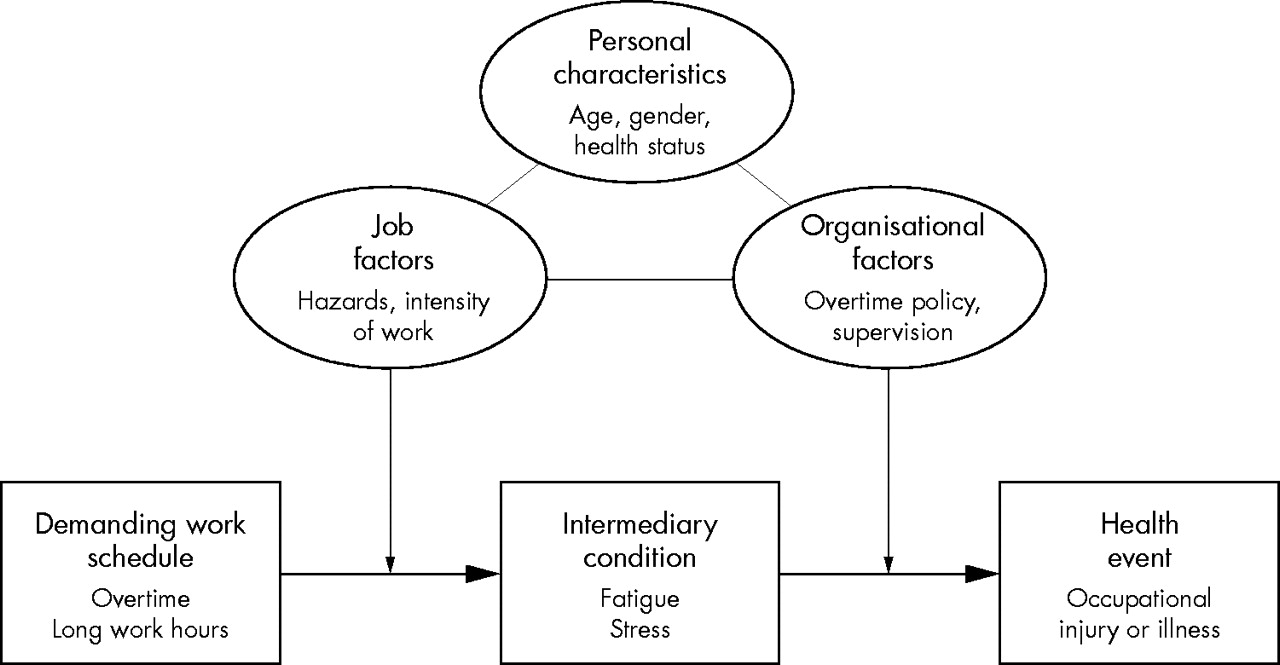
Conceptual model of the relationship between demanding work schedules and occupational injuries and illnesses (adapted from Schuster and Rhodes62).
METHODS
Data for this study comes from the National Longitudinal Survey of Youth (NLSY), which is sponsored by the US Bureau of Labor Statistics and administered by the Ohio State University Center for Human Resource Research.63 The NLSY cohort is comprised of 12 686 men and women who were 14–22 years of age when first surveyed in 1979. Follow up interviews with NLSY respondents have been conducted annually from 1979 to 1994, and biannually since 1996. Because of NLSY funding restraints, no questions concerning work related incidents were included in the 1991 survey and therefore this year of data was excluded.
The NLSY collects information on respondents’ sociodemographic characteristics, household composition, education, training, detailed work histories, job and employer characteristics, income and assets, health insurance status, incidence of work related injuries and illnesses, episodes of work disability, and respondents’ social and domestic functioning. The survey’s sampling strategy was designed to be representative of the non-institutionalised civilian segment of young people living in the United States in 1979 and born between 1 January 1957 and 31 December 1964.64 Additionally, NLSY over-sampled civilian Hispanic, black, and economically disadvantaged white youth to help detect variations in employment and health conditions according to respondents’ race, ethnicity, and socioeconomic status. Subjects for the survey were selected based on the results of 57 000 household screening interviews conducted by the National Opinion Research Center (NORC) at the University of Chicago.63 NLSY provides sampling weights for each response to reflect the national distribution of Americans in this age range.
This study examined the experience of these individuals between 1987 and 2000. Attempts were made to re-interview every remaining cohort member at each survey. Survey response rates for those years (excluding deceased respondents) ranged from 91.0% for the 1988 survey to a high of 92.5% in 1989 and a low of 83.4% in 2000. During that period, 10 793 members of the cohort reported working in at least one job. Among employed cohort members, 52.2% were male, 13.2% were black, and 6.7% were of Hispanic ethnicity (weighted percentages). A job record was created for each position held by an individual during each survey period, with a “job” defined as a cohort member being employed in a particular position for a specific employer with a position start date and (if applicable) end date provided. If an individual held more than one position at a time (for example, for different employers), another job record was created to reflect the individual’s experiences in the positions held concurrently. Changes occurring within a position (for example, changes in job activities) did not result in the creation of a new job history record, but a new record was created when a worker changed positions (for example, a machinist becoming a supervisor). A total of 110 236 job records were available for analysis, encompassing a total of 89 729 person-years of accumulated working time. Each job record contained extensive self-reported information about the characteristics of the job including the date of beginning work in the job, the end date (if applicable), job responsibilities and activities, occupational category, employer’s industry sector, job location, customary work schedule, usual daily job starting and ending times, commuting time, and information about overtime work and the receipt of overtime pay.
For the purposes of this study, five exposure categories were specified:
-
Extended hours per week: Jobs in which the respondent reported regularly working 60 or more hours per week were considered to have this exposure.
-
Extended hours per day: Jobs in which the respondent reported regularly working 12 or more hours per day were considered to have this exposure.
-
Overtime: For the 1988–93 survey years, the individual’s job was considered to have this exposure if the worker responded “yes” to the question: “Did you work overtime at this job?”. The NLSY survey did not define the meaning of “overtime”; interpretation of that term was left up to the discretion of the respondent. Owing to changes in the NLSY questionnaire, from the 1994 to 2000 survey years, the individual’s job was considered to have this exposure if the worker responded “yes” to the question: “At this job, did you usually receive overtime pay?”.
-
Extended commute time: Jobs in which the respondent reported regularly commuting two or more hours per day to and from the workplace were considered to have this exposure.
-
Overtime or extended hours: This was a derived summary exposure variable. A worker’s job was considered to have this exposure if it contained any of the preceding four exposures.
The exposure categories were not mutually exclusive and so a particular job potentially could have one or more exposures.
The primary outcome of interest in this study was the self-reported incidence of a work related injury or illness. This was based on a respondent’s affirmative response to the following question:
“I would like to ask you a few questions about any injuries or illnesses you might have received or gotten while you were working on a job. Since [date of last interview] have you had an incident at any job that resulted in an injury or illness to you?”
During the 13 year study period, 5139 work related injuries and illnesses were reported. Of those, 2799 occurred in jobs having exposure to at least one of the four exposure categories. Table 1 summarises characteristics of the effected workers and their injuries. For the purposes of this analysis, we assumed that the reported injuries were independent from one another. Also, we assumed that a distinct worker may suffer more than one injury, and in that circumstance, the worker’s characteristics (in table 1 and the subsequent analyses) would be counted more than once. These presumptions reflect typical patterns of acute injury occurrence and accident reporting in industrial settings. For example, it would not be uncommon for a particular worker to fall and sprain an ankle on one occasion and then subsequently (perhaps even in the same year) suffer a different injury (for example, a cut finger) without there being a specific causal connection between the two events.
Characteristics of the workers reporting work related injuries and illnesses, weighted data
Crude (unadjusted) occupational injury and illnesses incidence rates for each of the five exposure categories (for each survey period) were calculated by dividing the total number of work related injuries and illnesses reported in jobs having each type of exposure by the total accumulated person-time worked in those jobs. The crude incidence rates for each exposure category were plotted graphically for every NLSY survey year from 1988 to 2000 to depict trends over time and to visually portray the relative difference in rates between jobs with and without each type of exposure (that is, the relative rate ratio). Information about commuting time was only collected in NLSY survey years 1988, 1993, and 1994, and thus trend lines for that exposure category were not graphed.
Rate ratios, reflecting the relative risk of reporting the occurrence of an occupational injury or illness, were calculated by dividing the incidence rate for the accumulated person-time in jobs with an exposure by the incidence rate for accumulated person-time in jobs without that exposure. So, for example, in a particular survey period, if 300 injuries were reported to have occurred in jobs containing a total of 3000 person-years with an exposure and 200 injuries were reported to have occurred in jobs containing a total of 4000 person-years without that exposure, then the crude rate ratio would be 2.0, calculated as follows:
-
(300 injuries/3000 exposed person-years) ÷ (200 injuries/4000 unexposed person-years) = 10.0 injuries per 100 exposed person-years ÷ 5.0 injuries per 100 unexposed person-years = rate ratio of 2.0
To adjust for the influence of selected covariates, multivariate analyses were performed to calculate hazard ratios for each exposure category using Cox proportional hazards regression techniques, which are used to analyse the effect of multiple risk factors over the time preceding the occurrence of an event. The multivariate analyses included all accumulated person-time of exposure preceding the first injury in a particular job during a survey period, disregarding subsequent injuries and associated exposure time in that job during the period. Of the total number of work related injuries reported (5313), only 174 (3.3%) were the second or subsequent injury in a job during a survey period and thus were excluded from the analyses. Other job records were excluded because of insufficient information about the specific date of injury or time spent on a job, resulting in the exclusion of an additional 370 injuries, and the absence in some records of sample weights, resulting in the exclusion of an additional four injuries (and the associated exposure time). We performed a comparison of the job records with injuries used in the regression analysis (4765) to the 374 records with missing data to determine if those included and excluded were significantly different. The 174 “subsequent injury” records were not included in this comparison because by definition they had the same job characteristics as those included in the 4765 job records with first injuries. Our comparison showed that the records excluded from the analysis were very similar to those included (table 2).
Job records with reported work related injuries or illnesses that were included in the regression analysis compared to those that were excluded, weighted data
As a result of these methodological considerations, there was a total of 109 087 job records and 4765 injuries used in the Cox proportional regression analyses of hazard ratios compared to 110 236 job records and 5313 injuries used in the crude analyses of incidence rates and rate ratios. Sample weights were applied to derive nationally representative estimates for individuals in the NLSY age range (14–22 years old as of 1979; 22–43 years old during the study period from 1987 to 2000).
Each regression model included the accumulated person-time for one of the five exposure categories as the primary independent variable, the reporting of a work related injury or illness as the dependent variable, and age (continuous variable), gender (M/F), region (Northeast, South, North Central, West), occupational grouping (high risk/low risk), and industry grouping (high risk/low risk) included as covariates. “High risk” occupations included US Census (1970) Occupation Classification Codes 401–575, 601–715, and 740–785 (craftsmen, foremen, operatives, and labourers), and “high risk” industries included US Census (1970) Industrial Classification Codes 067–077 and 107–398 (construction and manufacturing sectors).65 The occupation and industry codes selected for inclusion in the “high risk” categories have traditionally higher than average occupational injury and illness incidence rates as reported by the US Bureau of Labor Statistics.66 We tested the proportional hazards assumption and it held for every variable used in the regression model with the sole exception of region. However, in our analysis, region was considered only as a potential confounder. We did not draw or report any conclusions in this study about the effect of region on the propensity for injury. Thus, based on the general applicability of the assumption for all of the primary exposure variables and the main outcomes variable (injury) used in the analyses, we applied the Cox proportional approach and reported the results accordingly.
Crude incidence rates and rate ratios were calculated with SAS (version 8.0) statistical software.67 The ProQuest software system was used to create a database of jobs and person-time exposure records,68 and Cox proportional regression analyses were performed on that database using Stata SE (version 7) statistical software.69 Because the hazard ratio calculations were based on a sample rather than the NLSY’s entire target universe (Americans aged 14–22 as of 1979), the results were subject to sampling error. To account for sampling effect, 95% confidence intervals around the hazard ratios were estimated by applying Taylor approximation techniques using SUDAAN (version 7.5) analytical software.71
RESULTS
Table 3 summarises the types of injuries and illnesses reported, among people working in jobs with and without exposure. Most reported work related conditions were either musculoskeletal disorders (34.7% of all reported injuries) or cuts and bruises (25.0%).
Types of injuries and illnesses reported by workers in jobs with and without exposure, percent distribution, weighted data
The unadjusted incidence rate for the entire duration of the study was 7.50 reported injuries per 100 worker-years for people in jobs with exposure to extended hours per week, 29% higher than the rate among those in jobs without exposure to extended hours per week (5.81 reported injuries per 100 worker-years). Similarly those in jobs with exposure to extended hours per day had an incidence rate 38% higher than those in jobs without that exposure (7.97 v 5.77 injuries per 100 worker-years), those in jobs with exposure to overtime had an incidence rate 84% higher than those in jobs without that exposure (7.49 v 4.06 injuries per 100 worker-years), and those in jobs with exposure to extended commute time had an incidence rate 7% lower than those in jobs without that exposure (6.90 v 7.46 injuries per 100 worker-years).
Incidence rates for each type of exposure varied by survey year, with a general downward trend in injury rates observed from 1988 to 2000 for all exposed and non-exposed groups (fig 2). Between 1988 and 2000, rates among the various exposure categories decreased by 54–69%. There were some fluctuations observed in the relative gap between exposed and unexposed groups during the study period, but no notable trends in the relative difference between groups over time were detected.

Trends in incidence rates of reported work related injuries and illnesses in jobs with and without exposure, by exposure category. NLSY survey periods 1988, 1989, 1990, 1992, 1993, 1994, 1996, 1998, and 2000. Note: NLSY changed the wording for the question regarding overtime in 1994, thereby potentially affecting the trend lines for “overtime” and “any overtime or extended hours”.
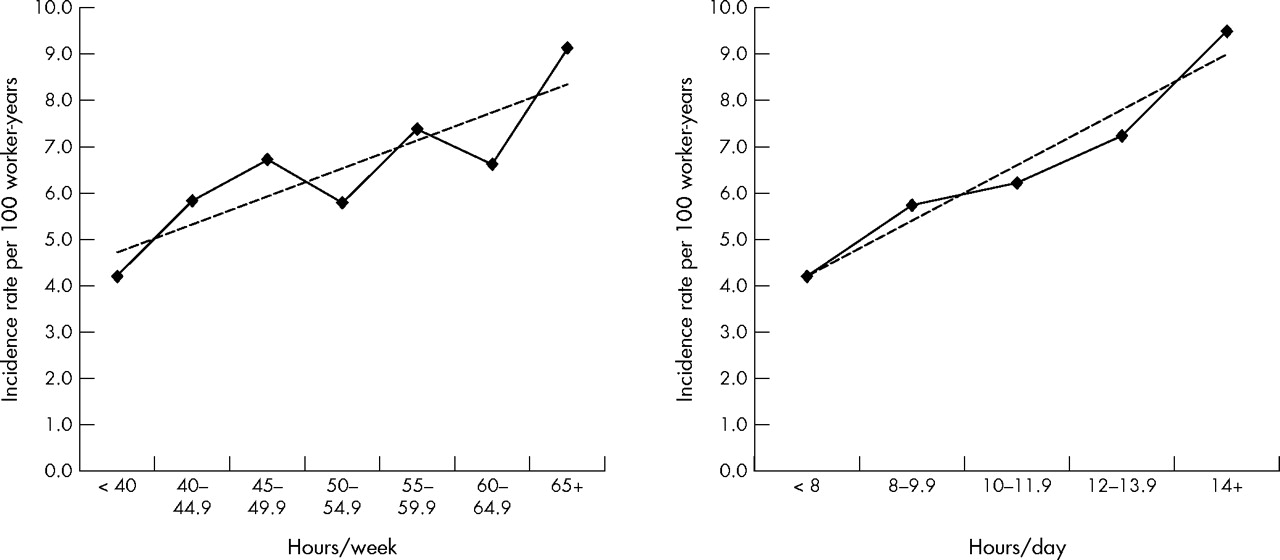
There was a strong positive relation observed between the magnitude of exposure for extended hours per week and extended hours per day and the corresponding injury incidence rate (fig 3). For extended hours per day, every additional five hours per week over 40 was associated with an average increase of approximately 0.7 injuries per 100 worker-hours. For extended hours per day, every additional 2 hours per day over 8 was associated with an average increase of approximately 1.2 injuries per 100 worker-hours.

Trends in incidence rates of reported work related injuries and illnesses in jobs with and without exposure, for two exposure categories (hours/week and hours per day), by amount of exposure. NLSY aggregated data covering 1987–2000.
Table 4 summarises the unadjusted rate ratios and 95% confidence intervals for each exposure category and the unadjusted hazard ratios calculated using first injuries only through the Cox proportional method. The ratios and confidence intervals calculated by each method were generally quite similar. The final adjusted hazard ratios calculated by the Cox proportional methods, after adjusting for age, gender, occupation, industry, and region, are presented in table 5. The results of the adjusted analysis indicates that the association between exposure and the risk of injury was only slightly affected by the influence of those covariates. This analysis found that, after adjusting for those factors, jobs with extended hours per day have a 37% higher injury hazard rate compared to jobs without that exposure. Similarly, working in a job with extended hours per week was associated with a 23% higher injury hazard rate, working in a job with overtime was associated with a 61% higher injury hazard rate, and working in a job with any overtime or extended hours schedule was associated with a 38% higher injury hazard rate. No association was detected between working in a job with extended commute time and the injury hazard rate.
Unadjusted rate ratios, hazard ratios, and 95% confidence intervals for injuries or illnesses reported in jobs with exposure to overtime and extended hour schedules
Adjusted hazard ratios and 95% confidence intervals for injuries or illnesses reported in jobs with exposure to overtime and extended hour schedules, after controlling for age, gender, occupation, industry, and region
DISCUSSION
This study of nationally representative data from the United States adds to the growing body of evidence indicating that work schedules involving long hours or overtime substantially increases the risk for occupational injuries and injuries. Unlike previous studies, our investigation had the advantage of covering a large variety of jobs, and controlling for the potential confounding affect of age, gender, occupation, industry, and region. We analysed nearly 100 000 job records extending over a 13 year period, and employed several statistical techniques for quantifying the extent of risk. The results of this study suggest that jobs with long working hours are not more risky merely because they are concentrated in inherently hazardous industries or occupations, or because of the demographic characteristics of employees working those schedules. Our findings are consistent with the hypothesis that long working hours indirectly precipitate workplace accidents through a causal process, for instance, by inducing fatigue or stress in affected workers. However, our findings are also consistent with other hypotheses and thus we cannot be certain of a causal connection based on this study alone.
Our comparison of injury incidence rates for workers in jobs with and without exposure was normalised by using a common denominator of 100 worker-years, thus avoiding a common methodological flaw that has afflicted some previous studies in this field. For example, workers who, on average, work longer hours (for example, 2500 hours per year) can be expected to experience more injuries than those who work shorter hours (for example, 2000 hours per year), even if the underlying risks to both groups are actually the same, because the former group spends more time “at risk” for injury. Many studies that have observed more injuries among persons who work longer hours have failed to take this consideration into account (as would happen, for instance, if incidence rates were to be calculated on the basis of number of injuries per 100 full-time workers). This study controls for that effect by deriving rate ratios (and hazard ratios) which compare the propensity to suffer injuries in each group during a standardised period of “at risk” time.
A notable result of our analysis was the detection of a clear dose-response effect, in which the number of hours worked per week (over 40) and the number of hours worked per day (over 8) were positively associated with an increasing risk of injury (per 100 worker-years). This finding lends support to the idea that there may be a causal process linking long work schedules with occupational injury. In this respect, our study is consistent with others51,52,54,70 that have shown increasingly greater level of injury risk in the latter portions (for example, beyond 9 hours) of long work shifts.
To some extent, the decline in incidence rates between 1988 and 2000 observed in our study reflects the general decline in occupational injury and illness rates reported nationally during that period. Data from the US Bureau of Labor Statistics (BLS) indicate that occupational injury and illness rates (all case, private industry) decreased by 29% during that period, from an average of 8.6 to 6.1 reportable cases per 100 workers.72 That decline has been attributed to various possible causes, including safer workplaces and a shift from manufacturing to service oriented jobs, which typically have lower average incidence rates.73 Another factor that may help to explain the relatively larger (54–69%) rate decreases observed in our study is the aging of our cohort, who were 23–31 years old in 1988 and 35–43 years old as of 2000. Younger workers generally have higher incidence rates than older ones, in part because workers tend to move into lower risk occupations (for example, managerial and administrative) as they age.
Our study found that overtime schedules had the greatest incremental risk of injury, with overtime workers having a 61% higher injury hazard rate compared to workers in jobs without overtime, after controlling for age, gender, occupation, industry, and region. This finding is consistent with other studies that have identified overtime work as particularly hazardous.22,29,39,74 But few previous studies have compared the relative risk of “overtime” schedules to other schedules with long working hours per day or per week. Indeed, the meaning of “overtime” is not precise, and thus the term might be used differently in different contexts and locations. Prior to 1994, no specific definition of “overtime” was provided to NLSY respondents, and so the term could have been interpreted in a variety of ways: referring, for example, to long work hours, work that exceeds the respondent’s conventional work schedule, unusual or unexpected hours of work, or work that qualifies the worker for overtime pay. To help clarify this issue, the wording of the “overtime” question in NLSY was changed in 1994 to refer specifically to work that qualifies for overtime pay.
Under the US Fair Labor Standards Act of 1938 (FLSA), employees covered under the act are entitled to receive overtime pay equalling at least 150% of their regular pay rate for all work time exceeding 40 hours per week. It was estimated that the FLSA covered 74 million American workers in 2000, about 79% of the US civilian labour force.75,76 On average, approximately 20% of covered workers receive overtime pay in any week.77 During the 1990s, the average weekly overtime hours put in by manufacturing workers covered by FLSA grew by 25%.78 Workers exempt from FLSA coverage include most administrative, professional, executive, supervisory, and outside sales personnel who are paid on a salaried basis. New regulations recently promulgated by the US Department of Labor have extended the FLSA exemptions to an additional 8 million white-collar workers.79
In the USA, approximately 19–33% of overtime work is mandatory (also called “compulsory”, “forced”, or “involuntary”).75,80 Mandatory overtime is overtime work required by employers, often under the threat of job loss or other penalty if the worker fails to comply. Several studies have suggested that mandatory overtime is especially hazardous with respect to its affect on worker fatigue, stress, impaired performance, and the potential for accidents, especially in the nursing and healthcare professions.75 The NLSY did not differentiate between mandatory and voluntary overtime, and it is not currently addressed or regulated by the FLSA.
Our study also found greater injury risks associated with work schedules exceeding 60 hours per week and 12 hours per day. These specific values for identifying “extended hours” were chosen based on previous research studies which had detected increased risks at those levels.6,11,23,50,81,82 However, increased risks also have been detected at other work-hour levels by a variety of researchers and there is as yet no consensus criterion for the precise amount of work that is considered to be hazardous. In an attempt to create uniform labour standards, the European Union issued a Working Time Directive in 1993 that limited normal working hours to no more than 48 per week (averaged over a four month period) and specified other requirements related to rest breaks, shift work, and overtime. Some European nations (for example, the UK) have introduced provisions for workers to voluntarily opt out of these requirements or to otherwise provide flexibility in their implementation.
Main messages
-
Working in jobs with schedules that routinely involve overtime work or extended hours increases the risk of suffering an occupational injury or illness.
-
Overtime schedules had the greatest relative risk of occupational injury or illness, followed by schedules with extended (⩾12) hours per day and extended (⩾60) hours per week.
-
The risk of injury was found to increase with the increasing length of the work schedule, even after controlling for the entire amount of working time spent “at risk” for injury.
-
Multivariate analyses indicated that the increased injury risks are not merely the result of the demanding work schedules being concentrated in riskier occupations or industries.
-
These results are consistent with the hypothesis that long working hours indirectly precipitate workplace accidents by inducing fatigue or stress in affected workers.
Study limitations
This study was based on self-reported information from NLSY cohort members regarding their employment and injury/illnesses experiences. Respondents were asked to recall information from the time of the previous interview, which in most cases was one year (for the 1988–1994 surveys) or two years (for the 1996–2000 surveys). There were no means to externally validate their responses. Our results, therefore, may be subject to potential inaccuracies related to the inability of respondents to recall information correctly. At the same time, the NLSY has advantages in this regard compared to other self-reported surveys in that the cohort had been surveyed regularly since 1979 and thus was quite familiar with the questionnaire, the response process, and the information required. Also, the NLSY was not designed to be a survey about work related injuries and illnesses or demanding work schedules—its primary objective was to evaluate participants’ long term labour market transitions and wage history. The survey thus avoids problems of information bias that typically plague attempts to ask injured workers about their working conditions and job exposures. Unlike data sources related specifically to the field of occupational safety and health, it is unlikely that respondents to the NLSY will intentionally or unintentionally be attempting to justify the legitimacy of a work related disorder, establish its compensability under workers’ compensation laws, or establish the employer’s culpability for the injury. All of those issues are unrelated to the main concerns of NLSY and thus the data obtained presumably will be less susceptible to contamination by such considerations.
Policy implications
-
This study supports initiatives of the European Union and other governments to regulate the length of working schedules.
-
Proposals in the United States to modify the Fair Labor Standards Act should examine the impact of those proposed changes on the injury risks associated with overtime work.
-
Strategies for preventing workplace injuries and illnesses should consider changes in work organisation and job design addressing the length of work schedules and the performance of overtime work.
A strength of the study is its ability to control for the potential confounding affects of age, gender, occupation, industry, and region. However, many other potential covariates—such as workers’ education and income levels, family composition, and health status—were not considered in the analysis, and thus their influence was not assessed. Our methods for considering the risks imposed by workers’ occupation and the employer’s industry classification may have masked more subtle differences related to particular job assignments within a broader occupational classification or specific industry group.
Because the study was based on secondary analysis of existing national data, we were also limited in our ability to evaluate other potentially important aspects of the dynamics underlying the risks of long working hours. For example, we did not have information available on the time of day the injury occurred, the kinds of job activities being performed, or the specific cause of the injury. However, information was available about the type of shift generally worked on each job (day, night, evening, split, or rotating shift) and thus we were able to consider the influence of shift work on injury risk and the combination affect of working both an unconventional shift schedule and long working hours. Those results will be reported in a separate publication.
Policy implications
The ultimate reason for conducting this research is to prevent occupational injuries and illnesses, promote overall worker health, and minimise the adverse consequences to affected workers. Most authorities believe that effective prevention of workplace injuries and illnesses requires a multifaceted approach that combines comprehensive hazard identification and control, ergonomic job design, worker training, medical surveillance, competent supervision, and a workplace culture and organisation that promotes optimal safely and health.
The results of this study suggest that special attention needs to be paid to establishing protective measures for people working overtime. For example, intensive accident hazard identification and control procedures (for example, periodic safety inspections) could be focused towards jobs in which employees work overtime schedules. Other protective approaches might include changes in work organisation (for example, periodic rest brakes, redesigning processes to avoid the need for overtime assignments, and employing more people to work fewer hours each), employer sponsored health promotion programmes (for example, counselling and education about the risks of long work schedules, periodic medical surveillance examinations for “at risk” workers, and ergonomic redesign to decrease job demands), and individual coping and behavioural practices (for example, maintaining good sleep and nutrition, getting daily physical exercise and regular medical care, avoiding drugs and alcohol, and seeking supportive services when needed). Our study was not aimed at assessing the effectiveness of these interventions in decreasing the risk of injury, and additional research is needed in this regard.
Acknowledgments
The authors would like to express our appreciation to Robert Reville, Carol Bigelow, Sylvia Spencer, Simon Folkard, Lonnie Golden, Gordon Smith, Jay Himmelstein, and Robin Clark for their suggestions and assistance in this study. We are indebted to Rainer Noess for his technical expertise, which includes software and technical support related to the ProQuest database system. Preliminary results of this study were presented at meetings of the American Public Health Association, the National Institute for Occupational Safety and Health (NIOSH), and the National Institute for Child Health and Human Development. This study was conducted with the support of a research grant (#R01-OH07576) from NIOSH.
REFERENCES
Footnotes
-
Competing interests: This study was based on secondary analysis of publicly available national survey data and did not involve any direct contact with human subjects. It received an exemption from the institutional review board at the University of Massachusetts Medical School. The conduct of the study and preparation of this article has involved no competing interests for any of the authors.