Article Text

Abstract
Background: In epidemiological studies of the potential health effects of traffic related air pollution, self reported traffic intensity is a commonly used, but rarely validated, exposure variable.
Methods: As part of a study on the impact of Traffic Related Air Pollution on Childhood Asthma (TRAPCA), data from 2633 and 673 infants from the Dutch and the German-Munich cohorts, respectively, were available. Parents subjectively assessed traffic intensity at the home address. Objective exposures were estimated by a combination of spatial air pollution measurements and geographic information system (GIS) based modelling using an identical method for both cohorts.
Results: The agreement rates between self reported and GIS modelled exposure—accumulated over the three strata of self assessed traffic intensity—were 55–58% for PM2.5, filter absorbance (PM2.5 abs), and nitrogen dioxide in Munich and 39–40% in the Netherlands. Of the self reported low traffic exposed group, 71–73% in Munich and 45–47% in the Netherlands had low modelled exposure to these three air pollutants. Of the self assessed high exposed subgroups in Munich (15% of the total population) and the Netherlands (22% of the total population), only 22–33% and 30–32% respectively had high modelled exposure to the three air pollutants. The subjective assessments tend to overestimate the modelled estimates for PM2.5 and NO2 in both study areas. When analysis was restricted to the portion of the Dutch cohort living in non-urban areas, the agreement rates were even lower.
Conclusions: Self reported and modelled assessment of exposure to air pollutants are only weakly associated.
- air pollution
- vehicle emission
- exposure assessment
- subjective assessment
- geographic information system
- GIS
Statistics from Altmetric.com
- air pollution
- vehicle emission
- exposure assessment
- subjective assessment
- geographic information system
- GIS
Traffic is a major source of air pollutants in urban areas. In Europe, exhaust from motor vehicle traffic is considered to contribute to more than 50% of ambient particle matter less than 10 μm (PM10) concentrations.1,2 However, relatively few studies—mainly in Europe—have investigated the specific effects of traffic related air pollution on human health.
Epidemiological studies on the health effects of traffic related air pollutants commonly use subjective assessment of traffic exposure3–6 such as self reported street type, traffic intensity, frequencies of traffic jams at the home address, or proximity of the home to major roads. Moreover, air pollution annoyance scores5,7,8 and traffic noise annoyance scores8,9 have also been used as exposure measures which combine exposure to traffic related air pollution, perception, and awareness of traffic related pollution and noise. All of these subjective indicators are easy to obtain, do not require monitoring data, and can easily be applied in large scale studies with minimal effort and cost. However, the validity and reliability of these subjective exposure surrogates have been challenged recently. Most of the studies indicated above using subjective assessment of traffic related air pollution exposure did not validate their exposure indicators, but rather interpreted the results with caution. Further, most of the authors argued that exposure misclassification could not be excluded, and that heterogeneous results among different studies or no-effect studies could be possibly due to insufficient exposure assessment and misclassification.10 Typically, subjects who reported on traffic at their home address also answered health questionnaires. Thus, in particular cross-sectional study results could be severely biased if both the exposure and potential health impacts were assessed subjectively.
To overcome these limitations, recent studies have used objective parameters for traffic related air pollution exposure at residential addresses such as traffic counts on major roads in the area, air pollution data from municipal monitoring sites, files on traffic counts at home address, geographic information system (GIS) based assessment of distance from subject’s home to a major road,10–17 spatial air pollution measurements,18–25 interpolated concentrations derived from monitoring network data,20,26,27 and dispersion models such as BREEZE model, the Dutch CAR model,28 and the Swedish AIRVIRO,29,30 and finally complex regression models using measured air pollution data and GIS data on traffic count, distance to major roads, and population density at home address.10,28,31–34
Brauer and colleagues35 found that the simpler estimates such as distance to major roads or traffic intensity at nearest road were poorer in terms of explaining variability in measured concentrations compared to the more complex modelled exposure estimates.
Here we describe the associations between self reported traffic intensity and GIS based modelled exposure to traffic related air pollutants at the participants’ home addresses, and its determinants. As part of an international collaborative study on the impact of Traffic Related Air Pollution on Childhood Asthma (TRAPCA), exposures to traffic related pollutants in outdoor air were estimated for three birth cohorts from three locations: the Netherlands; Munich, Germany; and Stockholm, Sweden.32,36 A common “objective” exposure assessment approach was used for all three locations, but no data on subjectively assessed traffic intensity were collected within the Swedish cohort. Thus, this analysis is restricted to the Dutch and German cohorts.
METHODS
Detailed descriptions of the site selection, study populations, measurements of traffic related air pollutants, and GIS based exposure models have been published elsewhere.35–39 These study characteristics are summarised briefly below.
Study populations
The study populations of this study comprised the Dutch cohort (PIAMA40) and one of the two Munich cohorts (LISA41) of the TRAPCA Study. The cohort in the Netherlands included newborns from three areas of the country—the north, the centre, and the southwest. While 10% of the cohort members were living in the largest city of Rotterdam (population approximately 590 000), two thirds were living in a large number of communities, most of them considerably smaller than 100 000 inhabitants.
The Munich cohort was comprised of newborns living in the city of Munich (population 1.32 million) excluding the suburban areas surrounding the city.
Of the Dutch PIAMA cohort, data from 2633 newborns with complete information on residential address at birth and subjective traffic data and who had never moved during their first two years of life were analysed here. The selection criteria were described in detail elsewhere.32,35 Briefly, since subjective traffic data was available from the two year questionnaire, this analysis was restricted to those who never moved in the first two years of life, who supplied complete information on residential address and subjective traffic intensity, and whose addresses could be geocoded. For the German part of the TRAPCA project, a total of 1756 infants were selected from the GINI and the LISA cohorts in Munich. Selection criteria were: residential address in the city of Munich at the time of the infant’s birth, the family did not move out of the city of Munich during the infant’s first year of life, availability of data on respiratory health for the infant’s first year of life, and availability of GIS data. For a detailed description of the Munich study population, see Gehring and colleagues.36 Here, we only analysed data from the LISA Munich cohort since we only had data on subjective assessment of traffic intensity for those cohort members (n = 673). Ethical approval of the studies were provided by the medical ethical committees of all participating institutes and the medical association of the state of Bavaria (Landesaerztekammer Bavaria). Written informed consent was obtained from all parents of the participating children.
Timing of data collection
Data about parental reported traffic intensity at the home address were collected when the infants were 3 months old for Munich and at 2 years of age for the Netherlands. Since exposure to traffic related air pollutants was modelled for the infants’ birth addresses, children who had moved within the first year of life in Munich and during the first two years of life in the Netherlands had to be excluded from this analysis.
Subjective assessment of exposure
Parents of the Dutch cohort answered the question “How many motor vehicles (cars, trucks, buses, mopeds) pass where you live?” with the answer categories: none, not many, moderate, many. In addition, the parents were asked: “On working days, how many trucks pass where you live?” and “On working days, how many buses pass where you live?” with the same response categories as above. Parents of the Munich cohort answered the question: “On which type of street do you live?” with the answer categories: side street with speed limit of 30 km/h (in the following referred to as traffic intensity = low), side street and no speed limit of 30 km/h (traffic intensity = medium), and main road (traffic intensity = high). Furthermore, a question on traffic jams in the vicinity of the home address was added: “Do traffic jams occur regularly during rush hours at your home address?” with the response categories: no and yes.
GIS modelled exposure
A combination of air pollution measurements and stochastic modelling procedures was used to assess long term average exposure to traffic related air pollutants and described in detail elsewhere.35 Briefly, in each study area, 40 measurement sites were chosen to represent rural, urban background, and urban traffic locations. Fine particle mass (PM2.5), filter absorbance (PM2.5 abs), as a marker for diesel exhaust particles, and nitrogen dioxide (NO2) were measured for four 2-week periods distributed over a year in 1999–2000, and used to calculate annual average concentrations, after adjustment for temporal variation.38,39 GIS data on population density and traffic intensity specified for certain buffer zones were used in regression models to predict annual average air pollution concentrations at the monitoring sites. These models were subsequently used to estimate ambient air concentrations at the home addresses of the infants. The regression models explained 56–85% of the variability of the annual average concentrations depending on study area and specific pollutants.
Potential determinants of subjective assessment of traffic related exposures
Since the study area in the Netherlands is very heterogeneous in population density35 we conducted sensitivity analyses using data on the degree of urbanisation according to the standard system from the Central Bureau of Statistics of the Netherlands based on number of addresses per square kilometre and categorised from 1 (very strongly urbanised) to 5 (non-urban). We combined the urbanisation degrees 1 and 2, later referred as “urban,” and urbanisation degrees higher than 2 as “rural”. Since the study area of Munich city was quite homogeneous with respect to degree of urbanisation, no sensitivity analyses were performed for the Munich cohort. To explore possible relations between socioeconomic status and self reported traffic intensity, we used the highest achieved educational level of either parent as a surrogate for social class.
For the Dutch cohort, low parental education was defined as the father and the mother having completed no more than basic school level. Family educational level was classified as high if at least one parent had obtained a university degree. Otherwise, educational level was categorised as medium. Analogously we defined low parental educational level for the Munich cohort as neither the father nor the mother having completed more than ten grades. Family educational level was classified as high if the father or the mother had obtained a university degree. Again, the remainder were classified as medium educational level.
In addition, stratified subjective assessed and modelled exposure was compared for children with and without parental allergy.
Statistical methods
Air pollution concentrations were best described by a log normal distribution. Therefore, means were expressed as geometric means (GM) with a geometric standard deviation (GSD). Associations between objective and subjective measures of traffic related air pollution were analysed by means of a side-by-side presentation of box plots of the modelled exposure estimates for the self assessed subjective estimates. When we compare agreements in low, medium, and high exposure categories of self assessed with modelled exposure, we attempt to compare similar distributions of low, medium, and high categories for “subjective” and “objective” partitioning. Therefore, the modelled estimates were categorised in three groups, with each group including the same number of subjects as the subjective assessment. Thus, classification and misclassification can be specified, although this does not assume that the modelled exposures are more “correct”. In addition, linear regression models based on natural log transformed air pollution concentrations were built and trend tests were performed using subjective measures of traffic intensity as an ordinal predictor variable.
RESULTS
Description of the study populations
Basic characteristics of the cohorts, subjective assessment of traffic intensity, and modelled exposure to traffic related air pollutants are given in table 1.
Description of the study populations
Descriptive analyses showed higher modelled exposure estimates for PM2.5, PM2.5 absorbance, and NO2 with increasing self reported total traffic at home address in Munich (fig 1) and for the urban Dutch study areas (fig 2B), while no association was found for the rural Dutch study areas (fig 2C) and only weak association for the total Dutch study area (fig 2A).
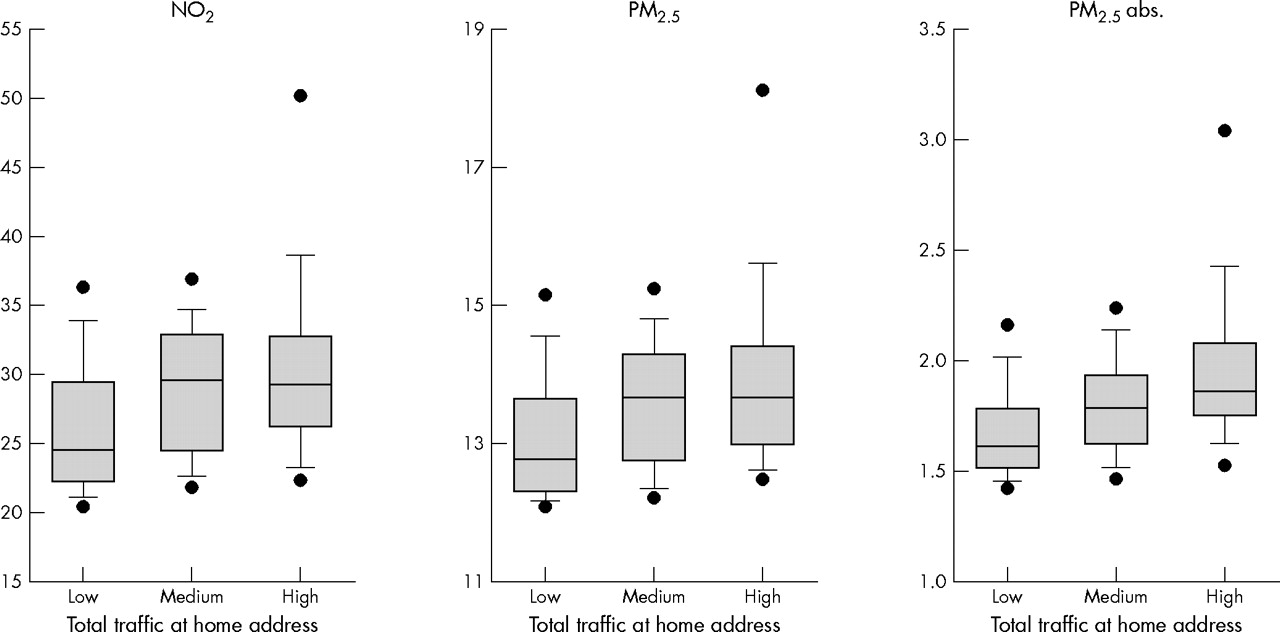
Box plots of modelled air pollution concentrations related to subjective reported traffic intensities in Munich.

Box plots of modelled air pollution concentrations related to subjective reported total traffic in the Netherlands; (A) total, (B) urban, (C) rural.
Table 2 shows the associations between subjective and GIS modelled exposure to fine particle PM2.5, filter absorbance (PM2.5 abs), and nitrogen dioxide (NO2) for the Munich cohort and the Dutch cohort. The classification as “low” showed the best agreement between self reported total traffic at home address and GIS modelled exposures for each of the modelled ambient air pollutants, whereas the agreement was higher in Munich than in the Netherlands. The agreement of the “high” exposure classifications was much lower and ranged between 22.3% and 33.0%. After stratification in urban (degrees 1 or 2 of urbanisation) and rural areas (degrees 3–5) in the Netherlands, the agreement for classification as high was increased for the urban study areas (table 2). In general, the subjective assessment tended to overestimate the modelled estimates, at least for PM2.5 and NO2, in both study areas.
Associations between subjective (questionnaire) and objective (GIS model) assessment of exposure to traffic related air pollutants in Munich (Germany) and the Netherlands
Subjective assessment of low truck and bus intensity at the home address was in good agreement with low exposures by GIS models (table 2), but the agreement for the high exposure categories remained weak. Stratification for urban and rural Dutch study areas showed again a higher agreement between subjective and objective exposure measures for the urban areas.
Social class (parental education) and exposure to traffic related air pollutants
Neither the parental reporting of traffic intensity at home address nor the GIS modelled annual average showed any consistent trend for both study areas with parental education as a surrogate for social class (table 3).
Associations between parental education and subjective (questionnaire) and objective (GIS model) assessment of exposure to traffic related air pollutants in Munich (Germany) and the Netherlands
Sensitivity analyses for parents with asthma or hay fever
After restricting the comparative analyses to parents with asthma or hay fever (60% in Munich and 42% in the Netherlands) the misclassification rates were slightly increased, in particular, for the Munich study area (data not shown). The subjective assessment clearly overestimated the modelled exposures. While the fraction of modelled exposures classified as low were 39.8%, 37.9%, and 44.7% for PM2.5, PM2.5 absorbance, and NO2 in the self assessed high exposure group in the total study population in Munich, the proportion increased to 64.8%, 48.2%, and 64.8% respectively in the subset of children with parental asthma or hay fever. However, for the Dutch urban areas no such strong corresponding increase was found (data not shown).
DISCUSSION
When restricting the comparisons to subjects living in urban areas, analyses from both cohorts showed statistically significantly increased modelled annual average concentrations of PM2.5, filter absorbance (PM2.5 abs), and NO2 to be associated with increased self reported traffic intensity. The magnitude of these associations were weak.
These results indicate the specific limitations of the validity of self reported traffic intensity measures. While annual average concentrations of the air pollutants increased with increasing traffic intensity within metropolitan areas such as Munich and Dutch urban communities with more than 100 000 inhabitants, no or even inverse associations were reported for the heterogeneous rural study areas in the Netherlands. Presumably, individuals assess traffic intensity in relation to traffic in the neighbourhood or in the community. So, traffic intensity might be also assessed as high, even if the overall traffic load in the community is very low. Exposure misclassification is probably very crucial when exposure to motor vehicle traffic exhaust is assessed by questionnaire reports. The very simple categorisation of communities according to population density or degree of urbanisation serves as a much better indicator for traffic related exposure than self reported traffic intensity if the study area is heterogeneous. However, the comparison of simple traffic indicators such as distance to major roads, or traffic intensity at the nearest road to the home were shown to be worse indicators of traffic related air pollution exposure than complex modelled exposures in the Dutch PIAMA cohort and the German Munich birth cohort.35 The reasons for positive findings of numerous epidemiological studies which investigated the association between (self reported) traffic related air pollution exposure and respiratory health is probably related to the homogeneous nature of the study areas in most of these investigations. Furthermore, reporting bias could not be excluded if subjects rate their traffic intensity at their home address and also answer a health questionnaire. On the other hand, symptomatic subjects tended to more strongly overestimate their self assessed exposure to traffic related pollutants. Thus, the positive findings do not disagree with our conclusion, that self reported traffic exposures have major flaws, if the study is large and heterogeneous in traffic intensity.
Parental education and exposure to motor vehicle traffic exhaust
In contrast to some other studies,42 this analysis did not show any relation between higher modelled exposure to traffic related air pollutants and lower social class. While there is a lower self assessed exposure to traffic exhaust in low socioeconomic status component of the Munich study, the low socioeconomic families of the urban Dutch study areas are more highly exposed. However, we would not conclude from this finding that exposure to traffic exhaust is equally distributed among all social classes since both birth cohort study populations under-represent the low social class parents. Two thirds of the Dutch cohort and more than 80% of the Munich cohort were categorised as high educational level. Inclusion of other social class relevant indicators such as occupation and income (and possibly grandparents’ social class) would probably improve social class categorisation. Moreover, the parents who did not complete education because of their young age might not have access to expensive residential areas. So, it would be very interesting to see whether parental education would determine different exposures to traffic exhaust in the future.
Strengths and limitations
One strength of this analysis comes from the mostly consistent results of two cohorts which used similar methods, but which included different study areas. The large numbers of study participants contributed to the strong power of this study. However, this study also has several limitations which need to be carefully addressed. One limitation is the restricted generalisability to underprivileged people of low social class. However, we assume that inclusion of this segment of the population would have increased the range of modelled exposures to air pollutants. Therefore, it is possible that the association between subjective assessment and modelled exposure would also have been even increased.
While the GIS based models also include information from buffer zones up to 1000 m, the self assessed traffic exposure is restricted to traffic intensity at the home address. So some different results in both exposure assessment approaches appeared to be plausible. A further limitation of this comparative study comes from the different surrogates of exposures to traffic related air pollutants. The GIS based models assess traffic related air pollutants such as fine particle mass, absorbance of fine particles, and nitrogen dioxide. There are certainly other sources than traffic emissions which contribute to these ambient air pollutants. On the other hand there are other traffic related pollutants such as organic compounds, carbon monoxide, etc which are not covered by the GIS based modelled exposure and which may not be correlated with modelled pollutants, but which might be reflected by the subjective assessment of traffic intensity at their home address. These limitations need to be considered before far reaching conclusions are drawn for a more appropriate exposure assessment for potential health effects.
Conclusion
We conclude that self reported traffic intensity is not a valid exposure estimate if the study area is heterogeneous in population size, rural-urban composition, and drawn from a variety of different cities. However, if the study area is homogeneous in terms of population size or if it includes only one city area, subjective measurements showed a weak association with modelled exposures.
Acknowledgments
We thank Kees Meliefste, Christian Harmath, Martina Zeiler, Klaus Koschine, and Mike Pitz for air pollution sampling and measurement.
REFERENCES
Footnotes
-
Funding: the work was supported by European Union Environment contract ENV4 CT97-0506 and QLRT 2000-00073
-
Competing interests: none