Article Text

Abstract
Aims: To describe the decline in injury rates between 1990 and 2000 within occupations stratified across three levels of physical demands and gender, adjusting for industry, in Canada’s largest province.
Methods: Records of injury compensation claims were obtained from the Ontario Workplace Safety & Insurance Board. The population likely to be insured by the Ontario Workplace Safety & Insurance Board was estimated from Statistics Canada’s Labour Force Survey. Injury rates were calculated by three broad levels of physical demands, separately for men and women.
Results: Injury rates decreased across each grouping of lower physical demands at work for both men and women, with the largest absolute differences in manual occupational groups (high physical demands). Occupations classified as manual (high physical demands) and mixed (moderate physical demands) showed larger differences in injury rates between genders than did non-manual (low physical demands), although the directions of these differences were not always consistent across different natures of injury classification.
Conclusions: The absolute reduction in injury rates in Ontario between 1990 and 2000 was dominated by the reduction in injury rates for men and women in manual and mixed occupations. However, not all types of injury have declined to the same extent. A large proportion of differences in injury rates between men and women can be attributed to the differential labour force participation across occupations and industries, as well as the differential tasks within occupational groups.
- work injury
- gender
- injury rates
- physical demands
Statistics from Altmetric.com
Between 1990 and 2000 the frequency of lost-time compensation claims for work injuries in Ontario, the province with the largest proportion of Canada’s labour force, has decreased rapidly from 184 444 to 104 154 injuries per annum.1 While information on injury events includes relevant surveillance measures such as gender, occupation, and industry, due to differential coverage across certain industry groups within Ontario, methods to calculate the corresponding injury rates have only recently become available.2
As has been observed in most developed economies, the number of females working as a percentage of the total workforce rose rapidly in Ontario between 1976 and 1990. The rates of female employment remained relatively steady throughout the early to mid 1990s, and rose again towards the end of the last decade.3 However, despite their converging rates of labour force participation, men and women remain differentially distributed across industries and occupations within the labour force.3,4
Further, different occupations and industries have different hazard exposures and require different physical demands, both of which influence the risk of work related injury. Interpreting male and female injury counts and rates that have not accounted for the differential participation of men and women across occupations and industries will likely lead to inaccurate assessment of the risk of injury between genders. The reported greater likelihood of men to be injured at work5–7 may be partially representative of the differing job tasks and exposures which are more predominantly associated with male labour force participation, rather than personal characteristics of male labour force participants.8–11
The objective of this paper is to describe the decline in injury rates over a 10 year period stratified by three categories of physical work demands and gender. To account for differential labour force participation and work tasks, these rates will be adjusted for industry groups. We will pay particular attention to groups where relative risk of injury differs across gender. In particular we will examine injury claims for evidence of task division within these occupations based on gender. This may be represented by differing risk across certain injury types (for example, rates of traumatic injury versus chronic musculoskeletal injuries due to repetitive movements).4,12
METHODS
This study utilised lost-time compensation claim data from the Workplace Safety & Insurance Board of Ontario (WSIB). The WSIB is the sole provider of workers’ compensation insurance in Ontario and covers 65–70% of labour force participants. Each lost-time injury claim includes information on gender, occupation, and industry.
Denominators for injury claim information were calculated using custom tabulations from the Canadian Labour Force Survey (LFS). The LFS follows a complex, rotating panel sample design to efficiently estimate monthly changes in the Canadian Labour Force.13 The tabulations from the LFS were restricted to Ontario respondents. In order to estimate the labour force covered by the WSIB we removed self employed participants, unpaid family workers, and those working in specific industries groups that are only partially covered, or completely excluded from insurance coverage in Ontario.2,14 To account for the different employment hours commonly worked by men and women, all denominator counts were presented as full-time equivalents (FTEs).*
Main messages
-
Differences in injury rates observed for men and women can be attributed to both differential participation in physically demanding occupations and industry groups, and to the differential tasks performed by men and women in these occupational groups.
-
The types of injury reported by men and women in the most physically demanding jobs suggest that differential tasks are associated with gender in these occupations.
Physical demands of work
The physical demands of work tasks were classified using a system developed by Institut de reherche Robert-Sauvé en santé et en sécurité du travail (IRSST).15 This classification system groups standard occupational codes into three categories of physical demands:
-
Manual: Those occupations that require the handling of heavy, or average loads, on a regular basis, or occupations handling lighter loads, but in static postures, or occupations requiring continuous repetitive work.
-
Mixed: Occupations that require handling of light loads, but do not require continuous static postures or occupations that handle heaving or average loads on an occasional basis.
-
Non-manual: Occupations that rarely require the handling of loads or physical activity.
Industry classifications
Industry groups were classified by collapsing categories of the Standard Industrial Code 1980 (SIC80). Due to the low number of injuries, major industry sectors were collapsed into the following five main groups: (1) manufacturing; (2) other goods industries (includes construction, forestry, mining, and agriculture); (3) retail trade; (4) health and social services; and (5) other service industries (includes accommodation, food and beverage, and government services).
Injury classifications
To examine differences in the types of injuries experience by males and females within manual and mixed occupations we divided injury reports into three categories:
-
Acute traumatic: This group of injuries included fractures, dislocations, amputations, contusions, cuts and lacerations, and multiple injuries.
-
Sprains and strains.
-
Chronic musculoskeletal: This group included inflammation or irritation of joints, tendons, muscles, and arteries; bursitis, synovitis, tenosynovitis, tendonitis, epicondylitis, vibration induced white finger disease, and carpel tunnel syndrome.
Policy implications
-
Injury rate statistics need to account for the differences in labour force participation between men and women, differences in the nature of injuries between men and women, and differential work exposures between men and women.
-
More research is needed to examine the extent of differential physical occupational exposures in men and women within similar occupational groups, in particular the increased risk for chronic musculoskeletal injuries for women compared to men.
There are other types of injuries not included in these categories, such as chronic diseases and acute exposures (for example, burns and electric shocks); however, the three categories of injuries described in this study account for 84% of all lost-time claims reported between 1990 and 2000. Further, this classification system is similar to an injury classification system used in a previous study in Ontario.16
Analysis
An initial descriptive analysis presented injury rates per 100 FTEs for both men and women for the years 1990–2000. Injury counts and FTE denominators were then stratified by occupational and industrial groups, separately for men and women. Using direct standardisation, occupational injury rates were adjusted for industry groups. These rates were then presented separately for men and women between 1990 and 2000. Lost-time compensation claims with missing information on occupation or industry were excluded from the analysis.
To examine the effect of the differential participation of males and females across industrial and occupational sectors we then calculated what the predicted injury count would be for males, if their participation was exactly the same as females across occupations and industries. This method was then reversed to obtain predicted injury counts for women, given that their labour force participation was exactly the same as males in relation to occupations and industry.
Finally, given the gender differences observed within manual and mixed occupational groups, we examined the nature of injuries within these occupational groups, to examine evidence of gender differences in tasks within the same occupational grouping.
RESULTS
Table 1 presents the injury rates between 1990 and 2000 for men and women. As expected, the rate of injuries reported for males was higher than the injury rate reported for women. Injury rates for men converged towards injury rates for women over the observation period, both absolutely and relatively.
Total lost-time injuries, full-time equivalents (FTEs), and rate of injury per 100 FTEs, stratified by gender; Ontario 1990–2000
Table 2 describes the frequency of injury claims with missing information on gender and occupation. With the exception of 1990, less than 1% of injury claims were missing information on gender. Between 1991 and 2000 the percentage of claims missing information on occupation increased; however, large differences between genders were not observed.
Number and percentage of lost-time injuries missing gender and occupational information; Ontario, 1990–2000
Table 3 presents the full-time equivalent counts, injury counts, and injury rates per 100 FTEs across physical work demand groups and industrial sectors for the year 2000 only. Over half of male (54%) full-time equivalents were working in manual occupations, 25% worked in non-manual occupations, with the remainder employed in mixed occupations. Women were predominantly employed in non-manual occupations (41%), with 26% and 34% employed in mixed and manual occupations.
Comparison of male and female full-time equivalents, injuries, and rate of injury per 100 FTEs by physical demands and industry groups; Ontario, 2000 only
In relation to industry groups, men were predominantly employed in the manufacturing (43%), and other service industries (35%). A large number of women were also employed in other service industries (39%), with only a very small amount being employed in other goods industries (5%). Women outnumber men in both the retail trade and health and social service industries.
In general injury rates declined across categories of physical job demands. Exceptions were within healthcare and other service industries where mixed rates were either similar to, or in one case higher than injury rates in manual occupations.
Table 4 presents the injury rates per 100 FTEs by gender and occupation, adjusted for industry, between 1990 and 2000. The absolute decline in the rate of injury in manual occupations was more pronounced than in mixed occupations, with non-manual occupations showing the lowest absolute decline. Relative declines in injury rates were similar for men and women in both the mixed and manual occupational classifications. The relative risk of injury for men compared to women for each of the three categories of work demands are presented in fig 1. There was a change in relative risk in manual occupations relative to mixed occupations between 1995 and 1996. The difference between male and female injury rates appeared similar in both manual and mixed occupations, with the rate of male injury less than that of female injury in non-manual occupations.
Comparison of male and female injury rates per 100 FTEs adjusted for industry, stratified by physical work demands; Ontario, 1990–2000
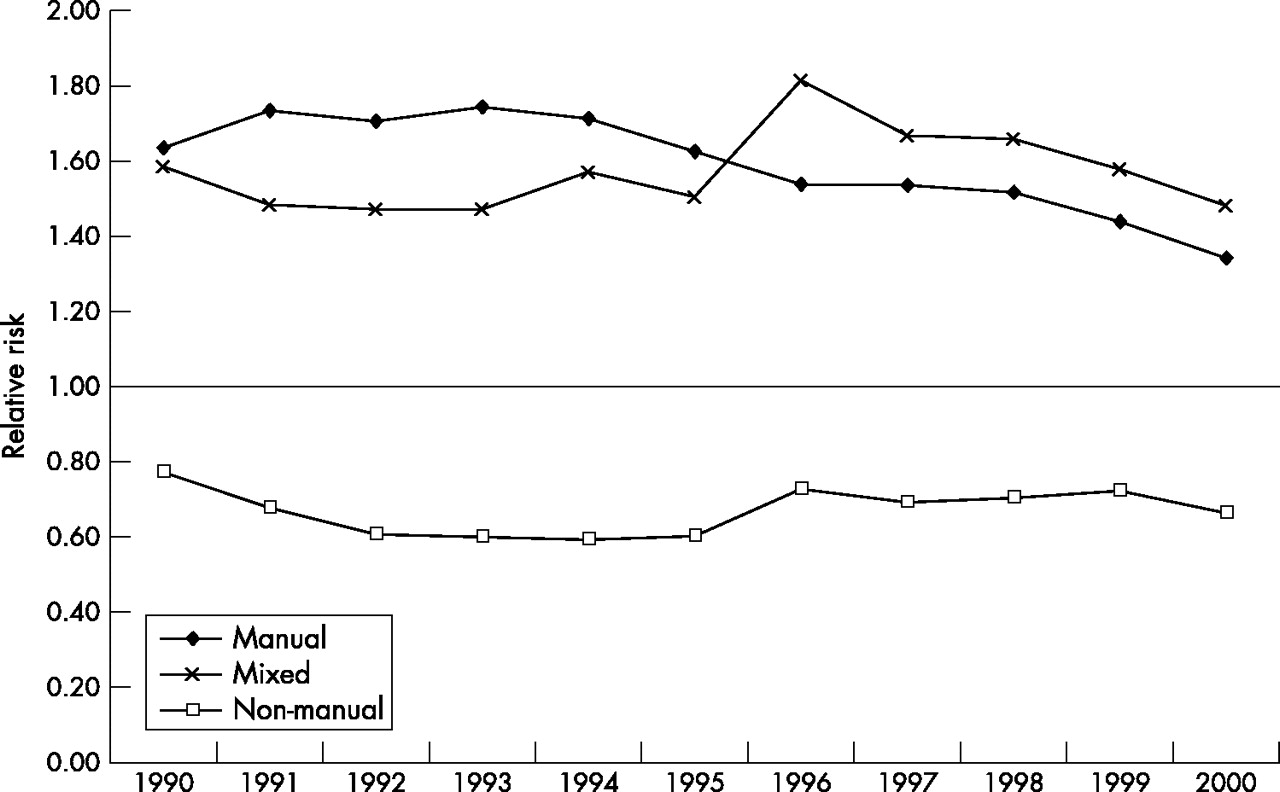
Relative risk of injury for men compared to women across three categories of physical work demands; Ontario 1990–2000.
Table 5 presents predicted injury frequencies for men given female labour force participation rates and male injury risks and vice versa. Given the same injury rates in each physical work demand by industry group, if male labour force participation was identical to female labour force participation the number of injuries experienced by men would reduce by approximately 55%. Similarly, if females participated at the same level across physical work demand by industry categories as men, they would experience approximately a 90% increase in work injuries, given their current injury rates.
Actual and predicted number of injuries for men and women; Ontario 1990–2000
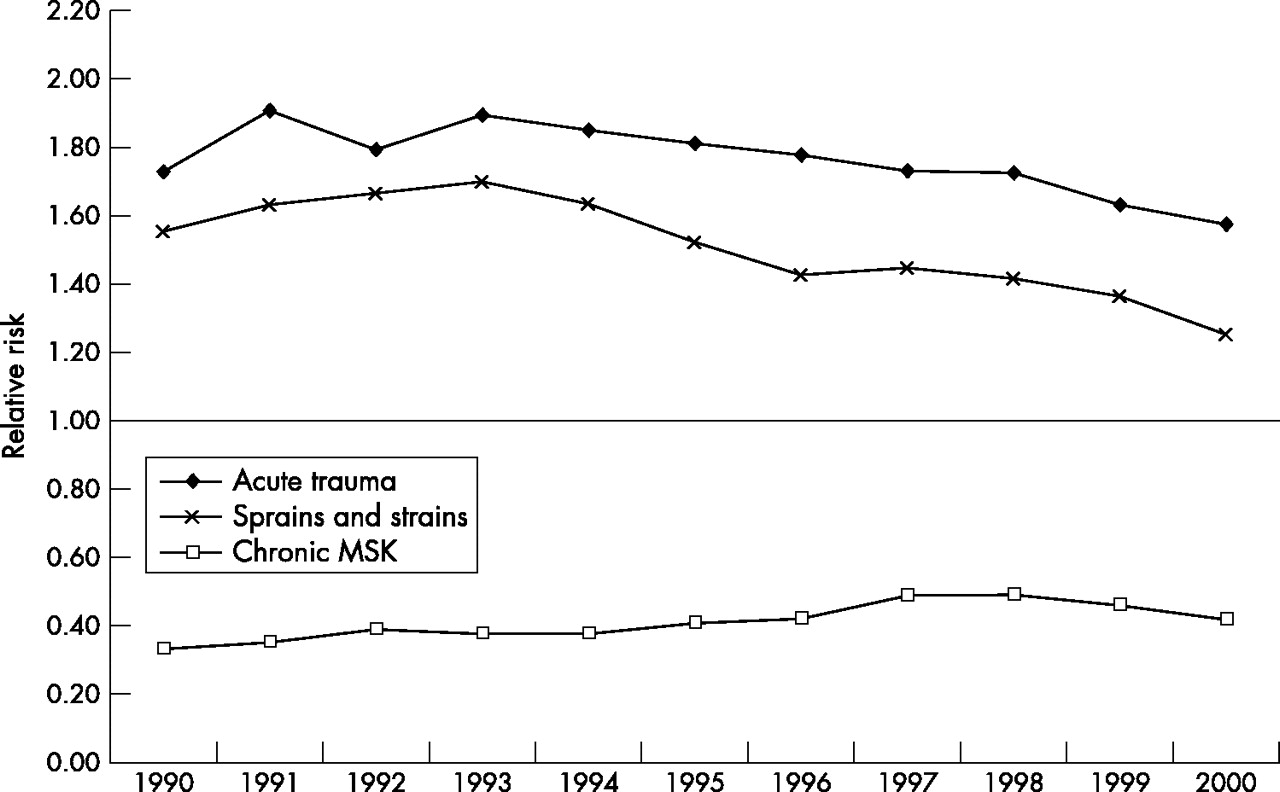
Table 6 presents the male and female lost-time claims by nature of injury classification separately for mixed and manual occupations. Across all injury classifications manual occupations had higher injury rates per 100 FTEs than did mixed occupations. While both acute trauma and sprain and strain lost time claims had fairly aggressive declines between 1990 to 2000, the same did not occur for chronic musculoskeletal injuries. The relative risk for men compared to women for nature of injury classification is presented in fig 2 for manual occupations only. Males had an increased risk for both acute traumatic and sprains and strains, while women had a higher risk of chronic musculoskeletal injuries.
Comparison of male and female injury rates per 100 FTEs by nature of injury; adjusted for industry and stratified by physical work demands; mixed and manual occupations only; Ontario 1990–2000
Relative risk of injury for men compared to women by nature of injury; manual occupations only; Ontario 1990–2000. MSK, musculoskeletal.
A final examination of lost-time claim injuries stratified by major occupational group and nature of injury is presented in table 7 for those occupations within the manual category of physical demands for the year 2000. Although a relatively small number of women were employed in occupations related to trades, transport, or equipment operation, injury rates are higher in this occupational group across all injury types compared to both women in other occupations, and to men within the same occupational group.
Full-time equivalents, injuries, and injury rates across occupational groups with manual job categories, stratified by gender; Ontario 2000 only
DISCUSSION
The objective of this paper was to describe the decline in injury rates over the period 1990–2000 within occupations stratified across three levels of physical demands and gender, adjusting for industry, in Canada’s largest province. We found the largest absolute decline in injury rates within manual occupations, with both manual and mixed occupations showing the largest relative declines. Further, while the injury rate between men and women was similar in non-manual occupations, within mixed and manual occupations rates of injury differed. Men were not at increased risk of all types of injuries compared to women. For example, women in manual occupations have over twice the risk of chronic musculoskeletal injuries compared to men.
We suggest that one possible reason for the difference in injury risks across manual and mixed occupations relates to the division of paid labour between genders in these categories of physical demands. Previous research has noted that women employed in manual jobs are more likely to perform more repetitive tasks, and less likely to be required to complete heavy lifting. This division of tasks is created both through the design of equipment fixed to average male dimensions, and through stereotypical views of differences in the physical capabilities of women compared to their male counterparts.12,17 The increased rate of chronic musculoskeletal injuries in women compared to men in both manual and mixed occupational groups, coupled with the lower rates of injuries that are acute and traumatic in nature supports this view (see table 6 and fig 2). In addition, there are some occupational groups, within the manual physical demand category, where male risk is not increased relative to females (trades, transport, and equipment operating occupations and occupations in processing manufacturing and utilities) (see table 7). It may be possible that within these occupational groups division of tasks, via the pathways listed above, may not be as prevalent. While examination of these differences is beyond the scope of the current paper, these patterns are worth consideration in future work injury research.18
The following limitations should be considered when interpreting these results. The IRSST classification was not designed separately for each gender.15 It would appear, given the evidence above, that the tasks performed by men and women, especially in manual and mixed occupations, may be different. Furthermore, aggregating occupations into three broad classification groups may miss important differences within finer groupings of occupations, as highlighted in table 7. Finally, there has been little validation of this classification scheme, and it is possible that some occupations within this study may be misclassified. This may be particularly relevant for occupations within healthcare. For example, under the IRSST system only nurse aids and orderlies are classified under the manual occupational grouping, whereas nurses and nursing assistants are grouped under the mixed physical demands. Yet, due to lower staffing ratios within the healthcare sector, the physical demands across these occupational groups may have become more similar. This may explain the similar risk between manual and mixed occupations within the health and social services sector (see table 3).
Our injury data were obtained from workers’ compensation claim records, whereas our denominator data were provided by the Canadian Labour Force Survey. The coding of occupations and industries may differ between these two data sources. It is also possible that groups of employees within certain occupations and industries, although covered under occupational health and safety legislation in Ontario, may not know they are covered, or may be encouraged not to report injuries at work.14 The administrative injury records also contained a number of missing values (see table 2). While the missing values will effect the gradients reported for injuries across time, they appear to be evenly distributed across genders, and would not have a large effect on the relative differences reported between genders.
From our results we suggest that within mixed and manual occupational groups the absolute differences between injury rates for men and women are larger than those in non-manual occupations. When we presented predicted counts of male injuries, given male rates of injury, but female labour force participation the difference between counts for men and women reduce substantially, as do injury counts for women given male labour force participation levels. Our findings support the interpretation that the differences in the rate of injury in manual and mixed occupations between men and women can be partially attributed to the sexual division of labour. This is supported by results presented in table 6 that show the relative risk of injury between men and women differs across different injury types.
Compensation claims for traumatic injuries and injuries arising from sprains and strains have decreased considerably in Ontario over the past 10 years. This decline is probably due to multiple factors, including safety awareness, safety equipment standards, and changes in tasks within occupation groups. An alternative explanation is that declines may also be due to under-reporting across some industrial groups. While this explanation is a plausible alternative, it should be noted that self reported injuries at work have also been found to decline over time in two population based independent surveys in this same jurisdiction.19 This suggests that if changes in the reporting of compensable injury claims is a factor in the declines in work injuries in Ontario, it is not the dominant one. Chronic musculoskeletal injuries did not decline at the same rate as traumatic injuries or sprains and strains. In fact over the first half of the decade, chronic musculoskeletal injuries increased across both manual and mixed occupational groups. This may be because the majority of workplace health and safety campaigns over the past decade have targeted traumatic injuries and sprains and strains, as opposed to chronic musculoskeletal injuries, where the factors associated with increased risk of injury are either harder to change, or not yet known.
In conclusion, it appears that the decline in reported lost-time claim injuries in Ontario between 1990 and 2000 can be attributed to the decline in traumatic injuries and sprains and strains primarily in occupations with high and moderate physical demands. It would appear from these results that differences in the injury rates observed for men and women can be attributed to both differential participation in physically demanding occupations and industries, and to the differential tasks for men and women within manual and mixed occupations.
Acknowledgments
Special thanks are extended to Marjan Vidmar for his work with extracting injury count data from the WSIB database. We also thank Dr Jennifer Payne for her contributions at the start of this project, and Jacob Etches for comments on a previous draft of this paper.
Footnotes
-
↵* One full-time equivalent = 2000 hours worked per year.
Linked Articles
- Work in brief