Article Text

Abstract
Aims: To summarise recent literature on the risk of prostate cancer in pesticide related occupations, to calculate the meta-rate ratio, and to compare it to data from meta-analyses previously published.
Methods: A meta-analysis of 22 epidemiological studies, published between 1995 and 2001, was conducted in order to pool their rate ratio estimates. Studies were summarised and evaluated for homogeneity and publication bias.
Results: The meta-rate ratio estimate, based on 25 estimators of relative risk from 22 studies, was 1.13 (95% CI 1.04 to 1.22). Significant heterogeneity of rate ratios existed among the different studies. Therefore, a stratified analysis was carried out. Major sources of heterogeneity identified were geographic location, study design, and healthy worker effect. Overall, pooled risk estimates for studies derived from Europe were lower than those derived from the USA/Canada. A significant increase in rate ratio was observed for the occupation category of pesticide applicators, whereas no significant increase was observed for farmers. There was no evidence of publication bias.
Conclusion: This increased meta-rate ratio for prostate cancer in different pesticide related occupations, including farmers, is very similar to three, previously published, meta-rate ratios for prostate cancer in farmers calculated from studies published before 1995. Although the underlying data do not identify pesticide exposure as an independent cause for prostate cancer, the fact that an increased meta-rate ratio is again obtained points to occupational exposure to pesticides as a possible factor. Future epidemiological studies should focus, as far as possible, on reliable methods to estimate actual exposure.
- meta-analysis
- pesticide
- prostate cancer
- CI, confidence interval
- HWE, healthy worker effect
- MeSH, medical subject headings
- MOR, mortality odds ratio
- OR, odds ratio
- PMR, proportional mortality ratio
- PSA, prostate specific antigen
- RR, relative risk
- SE, standard error
- SIR, standardised incidence ratio
- SMR, standardised mortality ratio
Statistics from Altmetric.com
- CI, confidence interval
- HWE, healthy worker effect
- MeSH, medical subject headings
- MOR, mortality odds ratio
- OR, odds ratio
- PMR, proportional mortality ratio
- PSA, prostate specific antigen
- RR, relative risk
- SE, standard error
- SIR, standardised incidence ratio
- SMR, standardised mortality ratio
Current knowledge of the aetiology of prostate cancer is limited and remains speculative.1 Genetic predisposition together with age and ethnic origin are considered to be the only major risk factors.2,3 It has been suggested that environmental or occupational factors also play a role in the aetiology of prostate cancer but the evidence is inconclusive.4 Epidemiological investigations suggest that some agricultural exposures may contribute to an excess of certain cancers, including prostate cancer. Specific agricultural agents that may be responsible for these excesses have not been clearly identified, but the strongest link to date is with pesticides.5 However, farming has been associated with increased risk for prostate cancer in some, but not in all studies.
Main messages
-
Pesticide exposure as an aetiological factor for prostate cancer remains a focus of debate as reflected by the 43 epidemiological studies (case-control, cohort, and PMR) published between 1995 and 2001.
-
The consistency of the association between exposure and disease may be considered as weak due to the important heterogeneity observed between the studies.
-
Control of confounding remains a problem in meta-analyses concerning prostate cancer as current knowledge of the aetiology of prostate cancer is limited and remains speculative. Most of the individual studies included did not control for the most likely potential confounders (genetic predisposition and ethnic origin) other than age.
-
Nevertheless, the increased meta-rate ratio—which is of the same order of magnitude as in other similar meta-analyses based on earlier studies—would again stress the necessity to limit the occupational exposure to pesticides as well as to other chemicals.
Three meta-analyses of epidemiological studies of cancer in farmers6–8 concluded that there was a slightly increased overall risk for prostate cancer (1.08, 1.12, and 1.07, respectively). The 95% confidence intervals (CI) (1.06 to 1.11, 1.01 to 1.24, and 1.02 to 1.13, respectively) did not include 1, which suggests a statistically significant increase. The three meta-analyses were conducted on studies published before 1995 and since then a great number of new studies have been published on this topic. The present study identified epidemiological studies, published between 1995 and 2001, investigating the possible relation between prostate cancer and exposure to pesticides, not only in farming but also in other pesticide related working environments. It includes a meta-analysis, combining rate ratio estimates.
Policy implications
-
The results of the present meta-analysis suggest a small increase in risk in workers exposed to pesticides in pesticide related occupations, which points to the possibility that these occupations include exposure to a factor or a combination of factors that increases the risk of developing cancer of the prostate.
-
The data available from the individual studies do not provide adequate exposure information to drawn firm conclusions about pesticide exposure as the cause of prostate cancer, independently from other factors.
-
The technique of meta-analysis allows assessment of a risk that is small but may have important implications for public health. Nevertheless, we have to keep in mind that a meta-analysis is a statistical procedure to integrate data of a number of independent studies and, as a consequence, greatly depends on the quality of these studies.
MATERIALS AND METHODS
Study identification and selection
Study identification
We searched Medline (National Library of Medicine, Bethesda, MD) and POLTOX (Cambridge Scientific Abstracts, International Food Information Service, US National Library of Medicine) for the period 1995 to September 2001. The search strategy used several combinations of the following keywords: prostatic neoplasms (MeSH), pesticides (MeSH), occupational exposure (MeSH), cancer, farmers, farming, meta-analysis, review, agriculture, epidemiology, mortality, and morbidity. In a second step, we checked the lists of references of the studies identified, going down step by step but limiting ourselves to studies published in the open literature.
Study selection
All studies complying with the following inclusion criteria were taken into consideration for a first overall evaluation:
-
Surveys published in peer reviewed journals
-
In English
-
Published between 1995 and 2001
-
Studies in man in vivo
-
Case-control or cohort design
-
Providing sufficient data to determine an estimator of relative risk (RR) and its confidence intervals
-
Referring to a selected group of occupational groups potentially exposed to pesticides
-
Including prostate cancer.
Studies were excluded from the analysis if they:
-
Included subjects already included in another more complete or more recent study of similar design and examining a greater number of subjects or with longer follow up time
-
Reported only data resulting from accidental exposures
-
Reported less than five exposed cases
-
Did not report original results (reviews, comments, letters, editorials)
-
Reported on occupational groups (job categories) not included in our selected groups.
The pesticide exposed occupational groups considered were both agricultural and non-agricultural.9 Agricultural occupational groups included farmers, farm workers, pesticide mixers and loaders, agricultural pesticide applicators, crop duster pilots, and flaggers for crop duster pilots. Non-agricultural pesticide exposed groups considered were nursery and greenhouse workers, chemical lawn care workers, golf course workers, park maintenance workers, and landscape maintenance workers.
Data extraction
A structured abstract form was created by one author (GVMF) for each study identified. In addition, both authors read the papers and independently abstracted the characteristics of the study following a standardised data extraction form provided by Ojajärvi and colleagues.10 The RR estimators, with their 95% CIs, were tabulated. The results of this exercise were compared among the two authors and consensus was obtained before the meta-analysis.
When multiple estimates of RRs were given, we retained the RR estimator on which the authors had relied for their assessment of causal association. In the other cases, priority was given to farmers as occupation category instead of other occupation categories; priority was given to overall farming activity rather than specific activities on the farm, and to long term employment or observation periods rather than short term. We chose overall data instead of data resulting from further stratifications, for example, by specific pesticides, by flight hours of application, by year farmed, by year of birth or license, by duration of employment, by time period, by licensure categories, by general or specific occupation, by farming activity, by ever/usual occupation, by ethnicity, by type and duration of exposure. Where both crude and adjusted risk estimates were presented, only the latter were used. For one study (Andersen et al, 1999), four RR estimators were taken into consideration, one for each country studied (Denmark, Finland, Norway, and Sweden), instead of the RR estimator for the whole Nordic population.
Data analysis
Evaluation of homogeneity
Homogeneity among studies was evaluated to test between-study comparability. The significance of the between-study variance was evaluated with the ln(RR) statistic test which has a χ2 distribution with degrees of freedom equal to the number of studies pooled minus 1. The formula applied is: χ2 = Σwi[ln(RR)i − ln(RR)p]2, for i=1 to N, where N is the number of studies combined, RRp is the overall pooled RR estimate, RRi is the RR for the ith study, and wi = 1/Vi where Vi is the variance of the ln(RR)i. A low p value for this statistic indicates the presence of heterogeneity, which questions the validity of the pooled estimates.11,12
Because significant heterogeneity was found between all studies combined, we evaluated potential sources of heterogeneity by subset analysis: study design (case-control studies, cohort studies, PMR studies), geographic location (US/Canada, Europe, or other), outcome data (cancer incidence or mortality), source of reference population (for the cohort studies: national/regional rates; for the case-control studies: hospital, cancer, or general population controls), presence of a “healthy worker” effect—manifested as significantly lower than expected all-cancer mortality or incidence—and occupation category (pesticide applicators and farmers). These subsets represent potentially important differences between studies with regard to exposure levels and potential confounders. Personal or occupational confounding factors are generally not made explicit in the papers, and therefore could not be considered in our analysis. A source of heterogeneity was considered important if stratification for that source did markedly increase the p value of the χ2 statistic for the stratum specific estimates of effect.12
Statistical pooling
For each study, an RR estimate and its variance were obtained: the odds ratio (OR) or the mortality odds ratio (MOR) for the case-control studies, and the standardised mortality ratios (SMR), standardised incidence ratios (SIR), or proportional mortality ratios (PMR) for cohort studies. The study variance (Vi) was calculated, using the CI given, according to the equation Vi = [(ln(CIupper) − ln(CIlower))/3.92]2. If the study reported a 90% CI, it was transformed into a 95% CI.
To calculate pooled RR estimates and their variances, we used the fixed effect model13 in case of homogeneity, and the random effect model14 in case of heterogeneity. As detailed by Steward and collaborators15 and Dennis,16 the maximum likelihood estimate of the pooled RR in the fixed effect model is the exp(ln(RR)p). The pooled ln(RR)p equals Σ[ln(RR)i/Vi]/[Σ(1/Vi)], Vi is the variance for an individual study as described above, and ln(RR)i is the log RR estimate for study i. This is a variance weighted least square mean. The variance of the pooled ln(RR)p, Var(ln(RR)p), or Vp is given by [SE(ln(RR)p)] = [Σ(1/Vi)]−1 where SE is the standard error. The pooled variance is used to calculate a 95% CI around the pooled RR estimate. When studies are heterogeneous or if there is reason to believe publication bias exists, the random effects model is more appropriate. Under this model, the point estimate of the pooled effect measure and its CI incorporate the additional variability due to between-study variance (τ2). Random effects models were applied, using the method described by Der Simonian and Laird.14 These authors proposed a non-iterative estimator of τ2 defined as est(τ2) = max{0, [Q−(k−1)]/[Σwi−(Σ(wi2))/Σwi]} where Q is the heterogeneity statistic, k is the total number of studies, and wi are the inverse variance weights for ln(RR).
Sensitivity analyses
We conducted sensitivity analyses—recalculation of summary indices for a set of studies based on revisions of initial choices or leaving out one or several studies at a time—including (1) deletion of studies reporting extreme RR estimators values; (2) deletion of studies reporting extreme precision (1/SE) values; (3) substituting redundant studies for those originally included; and (4) including studies reporting data for less than five exposed cases. They indicate the importance of these individual studies in the combined summary statistic and enable one to determine whether any of these had a disproportionate influence.17
Publication bias
Publication bias is an important concern for validity in meta-analysis. Two methods were used to assess publication bias. Potential publication bias due to study size (assuming that large studies always get published) was explored by plotting the natural logarithm of the estimator of RR (lnRR) versus the inverse of standard error (1/SE). Publication bias is characterised by an asymmetry in the funnel plot obtained. A statistical method used to test funnel plot asymmetry is the linear regression method suggested by Egger and colleagues.18 In this method, the standard normal deviate (defined as the odds ratio divided by its standard error) is regressed against the estimate’s precision (being defined as the inverse of the standard error). The intercept provides a measure of asymmetry: the larger its deviation from zero, the more pronounced the asymmetry.
In order to determine whether any positive or negative trend had occurred with time, a plot of the estimators of RR versus publication date was made.
Study quality
There is disagreement in the literature about whether study quality should be used to weight results of meta-analyses. Arguments against this proposition are the lack of an objective measure of study quality and the possibility of aspects of study quality imparting conflicting effects on study results.19 We did not construct a formal index to represent study quality because analysis of study characteristics provided more useful information than subjective quality scores.
RESULTS
A total of 43 studies, including 31 cohort studies (SMR, SIR), four PMR studies, and eight case-control studies were identified. Table 1 reports cohort and case-control studies and PMR,20–62 together with their main RR estimators. Studies that were excluded from the meta-analysis are italicised, mentioning the reasons for their exclusion. Among the 22 studies included in the meta-analysis, 11 were cohort studies, four were PMR studies and seven were case-control studies. From these 22 studies, 25 RR estimators were taken into consideration for the meta-analyses.
Abstracted risk estimates and study information from the original studies relating occupation related exposure to pesticides and prostate cancer
The RR to develop or die from cancer of the prostate varied between 0.6 and 2.93, and included from 5 up to 7826 cases. Twelve RR estimators reported a negative association between prostate cancer and the occupation, with four presenting a 95% CI that did not include 1. Thirteen RR estimators reported a positive association, 11 of them presenting a 95% CI that did not include 1.
Figure 1 shows the 25 RR estimators versus publication date. Visual examination does not reveal any positive or negative trend with time. Figure 2 illustrates the funnel plot of ln(RR) versus 1/SE and reveals no systematic relation between study size and magnitude of risk. Estimates from the smaller studies spanned the entire range of RR estimates. The statistical test applied37 did not produce evidence of funnel plot asymmetry (intercept 2.50; 95% CI −0.364 to 5.355) (p = 0.10). The same test applied to the funnel plot excluding the four estimators of RR from the PMR studies confirms the lack of asymmetry (intercept 1.95; 95% CI −0.972 to 4.873) (p = 0.20).
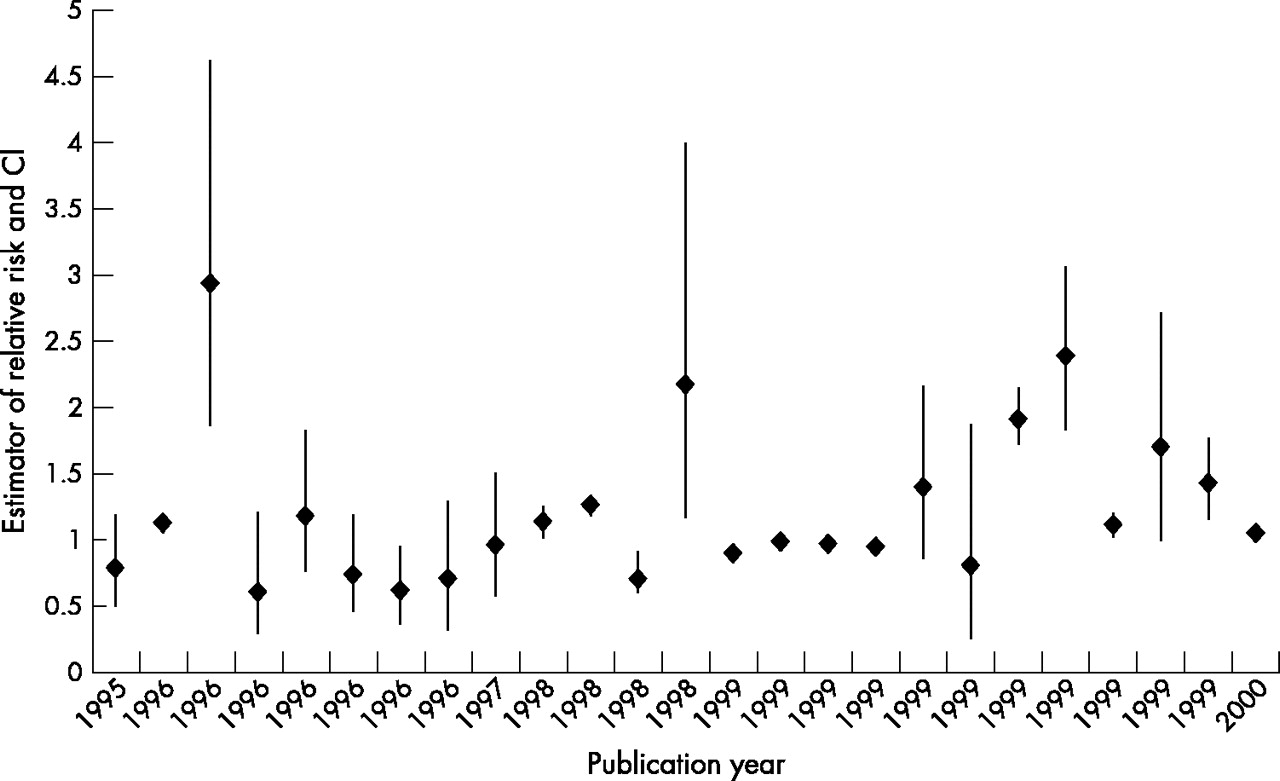
Relation between the estimator of relative risk and year of publication of studies on work related pesticide exposure and prostate cancer.

Epidemiological studies of occupation related exposure to pesticides and prostate cancer: funnel plot of natural logarithms of relative risk (RR) estimates versus the inverse of their standard errors (1/SE) (lnRR for all studies combined (PMR studies included) = 0.121).
Among the studies included in our meta-analysis, about the same percentages were from the USA/Canada (50%) and from Europe (45%); about the same number of studies had incidence cancer data (59%) or mortality rates (41%). Reference populations in cohort studies represented national or regional large populations (100% of the cohort studies). Control subjects in the case-control studies were hospital controls, other cancer controls, controls selected from the general population, and a pooling of other cancer controls and controls selected from the general population for 29%, 14%, 43%, and 14% of the studies, respectively.
Table 2 summarises the results of the different meta-analyses performed and includes the Woolf’s homogeneity χ2 statistic and its p value. Significant heterogeneity existed among the 25 RR estimates combined; therefore further analyses were carried out, pooling studies in function of stratification variables. As PMR studies are generally considered as being of lower quality, we calculated pooled rate ratios for all studies, including and excluding PMR studies, whereas PMR studies were excluded from most subset analyses.
χ2 Woolf and p value for homogeneity, pooled estimates of prostate cancer risk, and 95% CIs for several groupings of the data
The random effect procedure—applied in case of heterogeneity—on the 22 studies yielded a meta-rate ratio of 1.13 (95% CI 1.04 to 1.22). After exclusion of the four PMR studies, the pooled rate ratio (21 RR estimates in 18 studies) became 1.09 (95% CI 1.00 to 1.19).
Combining cohort studies gave a pooled rate ratio of 1.13 (95% CI 1.02 to 1.24). Combining case-control studies gave a pooled rate ratio of 0.98 (95% CI 0.71 to 1.37). Homogeneity has not been revealed using the study design as stratification variable, but the p values for homogeneity for the SMR and OR studies increased (from <0.001 to 0.002 and 0.003, respectively).
Overall, pooled rate ratios for studies derived from Europe, or from subgroups among these, were lower than those in studies derived from the USA/Canada. Dividing the grouping “geographic location” into study design markedly reduced the heterogeneity for SMR and OR studies in Europe as well as for cohort studies, SIR, and OR studies in the USA/Canada. Most of the pooled rate ratios in the North American studies were significantly higher than 1.
Stratifying the data by outcome incidence yielded no great differences between incidence and mortality rate ratios.
The rate ratio for cohort studies, derived from national/regional control rates, and the rate ratio for PMR studies showed great heterogeneity. Pooled rate ratios for case-control studies, using hospital data as reference population, showed lower heterogeneity than did those for studies using a reference population derived from the general population. The rate ratio for the case-control study was significantly increased when using patients with other sites of cancer as reference population.
Dividing the cohort studies into subsets, with and without a healthy worker effect (HWE), markedly reduced the degree of heterogeneity in the group without HWE. The group with HWE still showed heterogeneity but a significantly increased pooled rate ratio for prostate cancer.
Stratifying the data by occupation category did not reveal homogeneity. Combining studies in pesticide applicators gave a significantly increased pooled rate ratio of 1.64 (95% CI 1.13 to 2.38) but revealed heterogeneity.
Sensitivity analyses did not substantially alter the results of the meta-analysis (table 3). Exclusion of the study with the smallest55 estimator of RR, as well as exclusion of the studies with the smallest45 or largest21 (Sweden) precision (1/SE) made no difference. Rerunning the analysis including the studies reporting less than five prostate cancer cases had little effect on the overall pooled rate ratio. The main difference observed was that the increase of the pooled rate ratio after exclusion of the study with the largest estimator of RR30 and after substituting redundant studies for those originally included, was no longer significant (95% CI including 1).
Pooled estimates of prostate cancer risk: sensitivity analyses
DISCUSSION
The increased meta-rate ratio for prostate cancer in pesticide related occupations based on 22 epidemiological studies, suggests that a common characteristic constitutes a risk factor for the disease. The RR estimator in most studies and the meta-rate ratio calculated are only slightly increased, suggesting that the association is relatively weak. The meta-rate ratio calculated in this meta-analysis, based on literature data published between 1995 and 2001, is of the same order of magnitude as the meta-rate ratio based on earlier studies in farmers (1963–94) and reported by Blair and collaborators,6 Keller-Byrne and co-workers,7 and Acquavella and colleagues.8 The number of publications included in these three meta-analyses were 20, 24, and 29, respectively. A fourth review, without meta-analysis, of literature data between 1963 and 1995 in farmers and farm workers,63 reported on 36 case-control and cohort studies and mentioned 41 RR estimators with their 95% CI. On the basis of these figures we calculated a meta-rate ratio, using the random effect model, of 1.09 (95% CI 1.03 to 1.15). It has to be stressed, however, that these meta-analyses are partially redundant as they are based, fully or partially, on the same studies. In contrast to these four reviews we did not limit our analysis to studies in farmers but included also studies in other occupations using pesticides. It has been reported that cancer patterns—with the exception of lung cancer—among other pesticide exposed occupational groups are similar to those in farmers.9
On the basis of eight studies, reporting 11 RR estimators for all neoplasms as well as for prostate cancer, we calculated a meta-rate ratio for total cancer which was significantly below 1, whereas the meta-rate ratio for prostate cancer was still larger than 1 (see table 2). A decrease in overall cancer incidence in farmers has been observed in several studies and has been explained by several lifestyle factors, for example, a lower prevalence of smokers, a lower intake of alcohol, particular dietary habits, and by physical activity.63,64 Because it occurs in an occupational group that has a low mortality/morbidity for most other causes, the small excess in absolute terms for some cancers, including prostate cancer, in farmers is striking.65
In their meta-analysis of cancer among farmers, Acquavella and colleagues8 found evidence that heterogeneity was increased with the addition of more recent studies. In our study, important heterogeneity was observed between the studies and the following possible reasons for heterogeneity were explored.65
Geographic location: most of the pooled rate ratios for studies from North America were significantly higher than those in studies from Europe. Farming practice and pesticide use may differ among countries and even among regions. On a macro level, however, the quantitative use of pesticides seems not very different between North America and Europe; pesticide use is dominant in these two parts of the world, each of them spending between 25% and 30% of the worldwide pesticide consumption.66 At this moment, the absence of known differences in qualitative and quantitative pesticide use between these two parts of the world weakens the hypothesis that pesticides may be a causal factor in prostate cancer. However, pesticides may interact with other aetiological factors for prostate cancer. Of particular concern are American lifestyle factors such as fat intake and obesity, in complex interplay with genetic susceptibility. These factors—working through hormonal or insulin-like growth factor pathways—may influence the risk of prostate cancer in US Caucasians in comparison with Europeans.67 There is increasing evidence that fat consumption and/or chemical contaminants in fat (notably organochlorine pesticides), may increase production and bioavailability of androgenic hormones or mimic their action.68 Furthermore, differences in genetic susceptibility related to hormone biosynthesis and metabolism between populations have been hypothesised to contribute to the large west-east differences in risk.67 Endocrine disruption has been hypothesised to be responsible for adverse effects on the prostate, resulting in hyperplasia or cancer, because both androgens and oestrogens influence the growth and regulation of the prostate.69 A large number of pesticides show endocrine disrupting activities and it has been hypothesised, though not yet proven, that certain organochlorine and other oestrogen-like compounds can induce adverse effects through modulation of various complex biochemical and physiological pathways.68 Several metabolites of DDT (p,p′-DDD, p,p′-DDE, o,p′-DDT and p,p′-DDE) as well as chlordecone (kepone) were reported to interact with the androgen receptor in the prostate of the rat.70 However, the relevance of these finding for human prostate cancer remains to be established.66
Reference populations are a problem in proportional studies, the population basis not being defined. For that reason we calculated a meta-rate ratio after exclusion of these studies and found it slightly reduced (1.09, 95% CI 1.00 to 1.19) in comparison with the overall meta-rate ratio. Comparability between study and control populations may be a problem in SMR and SIR studies because of the healthy worker effect (HWE). The HWE is a bias found in occupational studies that compare rates of disease among employed people to disease rates for the general population, which includes unemployed people who may have a greater prevalence of disease than those who are employed.71 In the present study, the HWE, manifested as significantly lower than expected all-cancer mortality or incidence in studies reporting RR estimators for both all cancer and prostate cancer, emerged as a source of heterogeneity among the cohort studies. A significantly increased pooled rate ratio was observed in the studies with a HWE. There is little evidence for a strong HWE for cancer risk among men,72 and the HWE seems to have less impact on cancer deaths than on other causes of mortality.73,74 In addition, the HWE tends to decline with age of the population under study and most prostate cancer patients are elderly. Instead of using the general population as control, this kind of study should preferably focus on an internal control group or an external cohort group in a similar occupation without the risk factor under study.29
Outcome measures: mortality may be a poor indicator of chronic conditions that are not rapidly fatal. It is greatly influenced by the stage of disease at diagnosis and the quality of treatment. Incidence studies, however, may also be problematic due to the lack of a reliable national tumour registry system in some countries, for example, in the United States.24 We should expect higher incidence than mortality rates for prostate cancer, due to the slow progression of most prostate cancers, the availability of an easy diagnostic screening method (PSA), and the treatment available. This was, however, not observed in our meta-analysis.
Qualitative and quantitative differences in exposure may be responsible for part of the heterogeneity observed. Two different occupational categories were therefore studied separately.
Pesticide applicators are generally exposed to several formulations and multiple active substances, either simultaneously or successively, often with an intermittent frequency of application and under a great variety of conditions.64 A subgroup of four studies in pesticide applicators25,27,29,30 showed a significantly increased pooled rate ratio. In these studies, indexes of exposure or surrogate measures for exposure were used: estimation of the number of flight hours for the aerial pesticide applicators25 and years of licensure for the others pesticide applicators.27,29,30 No clear “dose-response” relation could, however, be established between duration of exposure and prostate cancer.
Farmers are a wider category than pesticide applicators as, particularly in large farms, not all farmers or employees actually use pesticides. The influence of several features, characteristic to farm environment and unrelated to pesticide exposure (natural environment, biological exposures, social conditions), may supersede that of pesticides when agricultural workers are compared to the general population or to other population groups.64 As the above mentioned meta-analyses and review were limited to farmers, we pooled the data on farmers from the studies we retrieved. The pooled data for farmers in our analysis showed heterogeneity, and the meta-rate ratio, calculated from 14 RR estimators out of 11 studies, was 0.97 (table 2). Sub-stratification by geographic location did not change that outcome in a significant way. However, even farmers do represent distinct groups in these studies: field crop and vegetable growers, market oriented animal producers and related workers21; farmers, fishermen, and hunters44; or farming, horticultural, and animal husbandry.57
Publication or related biases are common in meta-analyses. We applied conventional tests, for example, the funnel plot and a statistical test, the linear regression method,18 and did not find an indication for publication bias. In meta-analyses date of publication may serve as a surrogate for study quality or to detect temporal trends in exposure or disease incidence. The range of publication years (1995–2001) of the studies included in this meta-analysis is quite short, nevertheless, visual examination of fig 1 does not reveal any positive or negative trend in RR estimators with date of publication.
Control of confounding factors remains a problem in our analysis. Genetic predisposition, age, and ethnic origin are the only consistently identified aetiological factors for prostate cancer and there is also the possibility of effect modification by environmental or occupational determinants and lifestyle factors (tobacco, alcohol, coffee, dietary habits, etc). Most of the studies included did not control for confounders other than age and calendar period. As a consequence, an aggregation of results over studies that adjusted for genetic predisposition, ethnic origin, or lifestyle factors was not possible. Personal or occupational confounding factors were not reported.
Although the studies included in this meta-analysis were all performed in workers exposed to pesticides in agricultural related occupations, a definite identification of pesticides in general or of some pesticides in particular as cause for prostate cancer remains not possible. Other exposures, also occurring in farming and related activities, may also be important. Nevertheless, the increased meta-rate ratio, calculated by several authors from a long series of epidemiological studies, reinforces the need to carefully control the occupational exposure to pesticides. The issue, whether a specific agricultural exposure or specific pesticides are causally related to the increased incidence of prostate cancer, can only be addressed by more focused aetiological research.8 Epidemiological studies should focus in more detail on the identity and amount of substances used, and on the frequency, duration, and conditions of use. A promising approach has been applied recently by Gunier and colleagues,75 taking into consideration pesticide prioritisation, use densities, and population distribution. Alternatively, biological markers of exposure should be identified and measured in the population studied.
CONCLUSION
We found an increased meta-rate ratio of 1.13 (95% CI 1.04 to 1.22) for prostate cancer in workers exposed to pesticides in pesticide related occupations based on epidemiological literature published between 1995 and 2001. This meta-RR is very similar to four meta-analyses of prostate cancer in farmers and farm workers, based on epidemiological literature from before 1995. This result strengthens the suggestion that exposure to a common factor, possibly pesticides, is a causal factor. However, the studies reviewed contain insufficient qualitative and quantitative information on exposure in order to distinguish the possible influence of pesticides from other occupational, environmental, lifestyle, or genetic factors. Epidemiological studies concerning work related health hazards in agriculture should put more emphasis on exposure assessment, possibly by including the measurement of biological markers of exposure.
Acknowledgments
GVMF was supported by a grant from the Ministry of Agriculture and JLW by a grant from the Ministry of Health.