Article Text

Abstract
Background: Within- and between-worker variance components have seldom been reported for both environmental and biological data collected from the same persons.
Aims: To estimate these variance components and their ratio for air contaminants and urinary metabolites in two different work environments and to predict the attenuation of exposure-response relationships based on these measures.
Methods: Parallel measurements of air and urine were performed among workers exposed to monoterpenes in sawmills (urinary metabolite: verbenol) and styrene in reinforced plastics factories (urinary metabolite: mandelic acid).
Results: Among the sawmill workers, variance components of the air and urinary verbenol results were similar; for the reinforced plastics workers the estimated between-worker variance component was greater for styrene in air than mandelic acid in urine. This suggests that attenuation bias would be about equal if air or biological monitoring were employed for monoterpene exposures, but would be greater if urinary mandelic acid were used instead of airborne styrene in an investigation of styrene exposure.
Conclusions: Personal air samplers provide data with similar or superior quality to urinary metabolites as measures of exposure to these monoterpenes in sawmills and styrene in reinforced plastics factories.
- environmental monitoring
- biomarker
- variance component
- styrene
- monoterpene
- MA, mandelic acid
- PGA, phenylglyoxylic acid
- OEL, occupational exposure limit
- SCE, sister chromatid exchange
Statistics from Altmetric.com
- MA, mandelic acid
- PGA, phenylglyoxylic acid
- OEL, occupational exposure limit
- SCE, sister chromatid exchange
Because biomarkers indicate levels of toxicants or their products in the body, they account for all routes of exposure and for the use of personal protection in a manner that is not possible with conventional environmental monitoring.1–4 Thus, biomarkers are often regarded as superior substitutes for environmental measurements in epidemiological investigations.1,5–8 Also, in situations where the biomarker accumulates over long periods of time (for example, heavy metals), the biological burden damps exposure variability from day to day and offers more precise estimates of individual exposure than air monitoring.9,10 However, biomarkers with short half lives (for example, urinary metabolites of organic solvents) are greatly influenced by the timing of specimen collection within a single day and can be less precise than shift-long air monitoring.11 Thus, it is important to consider the variation in levels of both environmental and biological measurements prior to choosing a monitoring strategy for a particular application.
Main message
-
Biomonitoring should not be assumed a priori to be superior to air sampling for epidemiological studies.
Policy implications
-
Attenuation bias was used in a hypothetical exposure-response relationship to compare air and biological measures of exposure to monoterpenes in sawmills and styrene in reinforced plastics factories. Results indicate that personal air samplers provide data with similar or superior quality to urinary metabolites as measures of exposure to these toxicants.
Since both environmental and biological levels are measured with error, any exposure-response relationship derived from individual subjects will be attenuated, the amount of attenuation being proportional to the ratio of the within- to between-person variance components (hereafter the variance ratio) of the exposure measure.12 In previous studies, it has been shown that the variance ratio of personal measurements of styrene and benzene were similar to those of breath measurements, indicating that either measure would be equally useful in assessing exposure-response relationships in particular populations.13,14 However, airborne styrene had a much smaller variance ratio than that of sister chromatid exchanges (SCEs) among reinforced plastics workers,13 indicating that environmental measurements would be preferred to SCEs. In another study, mercury in urine or blood had a much smaller variance ratio than airborne mercury among chloralkali workers,15 indicating that these biomarkers would be preferred. It should be noted that this reasoning is based on the assumption that the primary source of exposure is via inhalation; if both inhalation and another route were prominent, biological monitoring would be preferred.
By increasing the number of repeated individual measurements one can reduce attenuation bias. This was recently illustrated by Heederik and Attfield16 in a study of lung function among workers exposed to coal dust. They concluded that 31 repeated measurements would be needed to obtain an attenuation bias of less than 10%.
Because within- and between-person variance components and the corresponding variance ratios have seldom been reported for both environmental and biological data collected from the same persons, we performed parallel measurements of air and urinary metabolites among workers exposed to monoterpenes in sawmills and styrene in reinforced plastics factories. These compounds were chosen because they have known metabolites and the toxicokinetics are well characterised. Biomarkers for styrene are commonly used for assessing occupational exposures, while the biomarker of monoterpenes has received relatively little attention. We used the estimated variance ratios to evaluate the relative usefulness of environmental and biological monitoring to these agents and to predict the attenuation of exposure-response relationships based on these measures.
MATERIAL AND METHODS
Subjects and sampling
Personal full-shift air samples and end-of-shift urine samples were collected repeatedly from nine sawmill and 12 reinforced plastics workers in northern Sweden. Descriptions of the factories and details of the personal air sampling have been published previously.17 Briefly, the reinforced plastics workers were employed at three different factories, producing boats and tanks (two factories) and bathroom fixtures (one factory). Most of these workers rotated through different tasks (lamination, gel coating, use of chopper guns, mixing of resins, and tool cleaning) according to daily and weekly schedules that depended in part on the production schedule. Air and biological samples were collected from these workers at intervals of 2–6 months. Workers in two sawmills also rotated through various tasks (sawing, edging, sorting, sweeping the floor, and sharpening saw blades) according to a regular daily schedule. They were sampled at intervals of 1–4 months, except for three workers who were sampled at intervals of 2–5 days (sawmill workers 1–3).
Urine specimens were obtained in plastic bottles and transferred to three or four (depending on the voided volume) 15 ml plastic tubes sealed with screw caps. The tubes were immediately frozen and maintained at −20°C prior to analysis (within 1.5 years for sawmill workers and 2 years for reinforced plastics workers). The urinary analyte for the sawmill workers verbenol, a metabolite of α-pinene and a reliable biomarker for monoterpenes arising from the particular tree species processed in these sawmills (Pinus sylvestris).18 For styrene the two most common metabolites are mandelic acid (MA) and phenylglyoxylic acid (PGA). In our study only MA levels will be reported, as we observed instability of PGA standards in urine under the condition of storage.
Three or four pairs of personal and urinary measurements were obtained from each worker in the study. Some reinforced plastics workers occasionally wore half-mask respirators (equipped with charcoal adsorbents, nominal protection factor = 5) or supplied-air respirators (nominal protection factor >100). Respirator use was erratic and generally lasted less than two hours per day. During respirator use, workers were instructed to close the passive air monitors.17
The ethics committee at Umeå University (dnr 97-23) approved the study.
Chemical analysis
Air samples
Monoterpenes and styrene were collected with diffusive samplers (stainless steel tubes, 90 mm × 6.3 mm OD × 5.0 mm ID, Perkin Elmer) containing approximately 300 mg of Tenax TA, 60–80 mesh (Chrompack). The tubes were analysed within a week of arrival at the laboratory by coupled thermal desorption gas chromatography as described elsewhere.17,19 The monoterpene concentration represents the sum of α-pinene, β-pinene, and Δ3-carene.
Urine samples
Urine samples from monoterpene exposed workers were thawed and centrifuged at 500 rpm (24 g) for five minutes. The samples were then hydrolysed with β-glucoronidase (420 800 units/g solid, SIGMA) at 37°C for 24 hours, concentrated by solid phase extraction (SEP-PAK C18 cartridge, Waters Assoc., Milford, USA), and analysed by gas chromatography.20
Urine samples from styrene exposed workers were thawed and 1 ml was combined with 200 mg sodium chloride and 40 μl of 3M hydrochloric acid. Urinary MA was extracted with 5 ml of ethyl ether, of which 4 ml of extract was transferred to another vial. The ethyl ether was evaporated under a stream of N2 at room temperature. The residue was reconstituted in 0.5 ml of water and vigorously mixed for another 60 seconds. Samples were then transferred to autosampler vials for injection into a HPLC consisting of a Gyncotec Model 480 Controller gradient pump (Gynotek, Germany), a Gina 160 Autosampler (Gynotek, Germany), and a Model UVD 340s Diode Array detector (Gynotek, Germany). The mobile phase was 0.02M phosphate buffer adjusted to pH 2.5 with phosphoric acid plus 7.5% acetonitrile. The flow rate was 1.0 ml/min. A 20 μl aliquot of sample was injected onto a 250 × 4.6 mm YMC AQ reversed phase C18 column (5 μm particle diameter) (Thermo Hypersil, UK) with a C18 2 × 20 mm guard cartridge (Thermo Hypersil, UK). MA was monitored at 225 nm. Standard solutions were prepared by dissolving MA in urine from healthy unexposed men. The signal was linked to a Chromeleon Data system (Gynotek, Germany) and the data were stored and processed by a personal computer.
Stability tests employing frozen control urine in our laboratory showed no degradation of urinary verbenol within two years of collection and of urinary MA for at least four years.
Creatinine was analysed in all urine samples by Jaffe’s method,21 and the metabolite levels were expressed per unit concentration of creatinine.
Statistical analysis
All statistical procedures were performed with SAS software PC 6.12 (SAS Institute, Cary, NC, USA). Nested one way random effect models (Proc NESTED) were used to obtain ANOVA estimates of the within- and between-worker variance components (designated  and
and  , respectively) of the log transformed data. Confidence intervals for
  ,
,  and their ratio were estimated according to Searle and colleagues.22 These variance components were used to assess the potential effect of attenuation of the exposure-response relationship according to the following equations12,13,16:

where βt is the true regression coefficient between the logged outcome (dependent variable) and the logged exposure (independent variable),  is the observed regression coefficient,
  is the estimated variance ratio, and n is the number of repeated measurements obtained from each person. According to equation (1), the observed regression coefficient
  is smaller than βt (attenuated), and the amount of attenuation increases with the estimated variance ratio
  at a given value of n.
From equation (1), the estimated bias in the coefficient can be expressed as a proportion of the true coefficient; i.e. bias = (1−b) and b is estimated by  , where:

For a predetermined bias, the sample size n can be estimated as:

RESULTS
Data are summarised in fig 1 and table 1. At the sawmills, the nine individuals’ estimated geometric mean monoterpene exposures ranged from 20.7 to 147 mg/m3 and the corresponding levels of urinary verbenol ranged from 4.2 to 37.6 μmol/mmol creatinine (fig 1A and table 1). (The Swedish occupational exposure limit (OEL) for monoterpenes is 150 mg/m3.) At the reinforced plastics factories, the estimated geometric mean styrene exposures among the 12 workers ranged from 4.6 to 66.4 mg/m3, while that for MA was 24.5–227 mg/g creatinine (fig 1B and table 1). (The Swedish OEL for styrene is 90 mg/m3.)
Estimated geometric mean for each worker included in the study based on three measurements for plastic workers and four measurements for sawmill workers

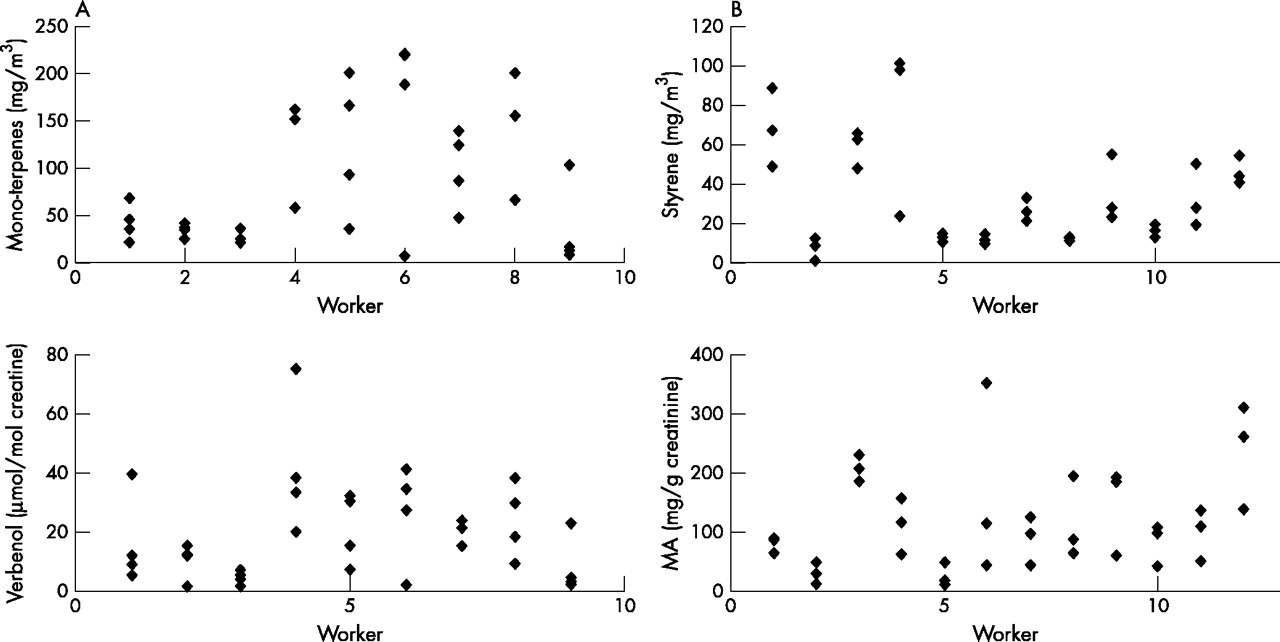
Data available for statistical analysis. Air monitoring and biomarker in urine for each worker (based on raw data). (A) Sawmill workers. (B) Reinforced plastics industry workers. MA, mandelic acid.
The estimated within- and between-person variance components and the corresponding variance ratios are shown in table 2 for the sawmills and reinforced plastics factories. Among the sawmill workers, variance ratios of the air measurements and urinary verbenol were very similar (1.82 and 1.97, respectively). On the other hand, among the reinforced plastics workers the estimated variance ratio for air monitors ( ) was about half of that for urinary MA (
 ). However, the confidence intervals were overlapping in both cases, indicating that the variance ratios were not significantly different for either set of air and biological measurements (table 2).
Estimated variance components and variance ratios ( ) for air and urine measurements and predicted sample sizes (n) required to reduce the bias in the observed slope in the exposure-response relationship to 10% (from equation (3) with b = 0.9)
Spearman correlation coefficients (rs) were estimated for geometric mean levels of air and biological measures of exposure in sawmills and reinforced plastics factories. For monoterpenes/verbenol, rs = 0.950 for the nine data pairs and for styrene/MA, rs = 0.455 for the 12 data pairs.
DISCUSSION
This paper focuses on the selection of air or biological sampling to characterise personal exposures and health outcomes in a population exposed to a toxic chemical. Using criteria previously recommended by Rappaport and colleagues,13 we compared within- and between-worker sources of variability for personal air measurements and urinary metabolites among workers exposed to monoterpenes in sawmills and to styrene in reinforced plastics factories (table 1). In each case, the measure of exposure with the smallest estimated variance ratio ( ) would logically be preferred, because of reduction in measurement error (and the resulting attenuation bias) in an exposure-response relationship. Since 95% confidence intervals for all pairs of variance components and the corresponding
  s were overlapping, one could well conclude that we have no evidence favouring air or biological measurements in either work setting. Yet, the point estimates of the variance components for the particular pairs of air and urinary measurements were sufficiently dissimilar to warrant some discussion about likely differences between the sawmills and reinforced plastics factories.
Looking first at the sawmill exposures, estimated variance components and ratios of monoterpenes in air and verbenol in urine were essentially the same ( ), suggesting that air measurements or urinary metabolites would be equally useful measures of exposure. This conclusion is bolstered by the high correlation of individual geometric mean levels of monoterpenes and urinary verbenol (rs = 0.950). In this case, selection of air or biological monitoring could be based on ease of sample collection and analysis. However, the relatively large variance ratios indicate that many repeated measurements of either air or urine would be required from each subject to obtain relatively unbiased coefficients for the exposure variable. Indeed, from equation (3) we estimate that at least 20 measurements would be needed per person to limit attenuation bias to 10% among these sawmill workers. If only four measurements were obtained from each sawmill worker, as in the current study, the observed regression coefficient would be about two thirds of the true coefficient (equation (2)).
The large variance ratios of the sawmill data can probably be explained by the work task organisation. The sawmill workers rotated through the tasks on a regular schedule, thereby minimising differences in exposure between workers, while increasing the within-worker variation. The factors affecting the within-worker variability are mainly factors that are out of the workers’ control, such as seasonal changes, timber age, and quality and different production levels.
We are not aware of any other estimates of variance components of monoterpene exposure and urinary verbenol. Vinzents and colleagues23 estimated within- and between-worker variance components of wood dust exposure in furniture factories. They reported  and
and  , leading to an estimated variance ratio for wood dust exposure 1.07, which is about half that observed for monoterpenes in our study.
Regarding exposures to styrene in the reinforced plastics factories, the variance ratio for air measurements ( ) was about half of that of MA (
 ) (table 1), indicating that environmental monitoring would be preferred to urinary metabolites in this population. Again, this conclusion is supported by the relatively weak correlation of individual geometric mean levels of styrene and urinary MA (rs = 0.455). Applying equation (2) to data from the reinforced plastics workers; three repeated measurement per person would result in a bias of 13% for styrene and 23% for mandelic acid.
Since the within-person variance component for styrene ( ) was similar to that for MA (
 ), most of the difference in the variance ratios between air and urinary monitoring can be attributed to the increased value of
  for styrene versus 0.349 for MA. Between-person variability in air levels tends to be related to interindividual differences in tasks,24 and potentially to those involving work behaviour. These interindividual differences should also be observed in the levels of urinary metabolites unless the half life of the metabolite is very short, in which case only tasks occurring just prior to urine collection would be important. Since the half life of MA is only 2–4 hours,25 and urine was collected at the end of the work shift in our study, we speculate that the smaller value of
  for MA was caused by the presence of large transient exposures to styrene associated with morning tasks of some workers. If correct, this explanation would call into question the traditional practice of collecting urine at the end of the work shift, since random collection of spot urine samples would allow short lived metabolites to better capture the full range of transient exposures.
Another possible explanation for the difference in  between styrene and MA in our study relates to the use of respiratory protection among some of these workers. Although these workers had been instructed to close the air samplers during the periods that they wore personal protection devices, we cannot be sure that they performed this duty effectively. If some workers did not seal their monitors during periods of high transient exposure, then we would expect the value of
  to be greater for styrene than for urinary MA, as observed.
We are aware of no other studies that reported within- and between-person variance components for both airborne styrene and urinary MA, although these variance components have been reported separately for either styrene or MA among reinforced plastics workers.26,27 In a study of MA in five reinforced plastics factories, Symanski and colleagues26 reported variance components in the following ranges:  and
and  . For airborne styrene, Kromhout and colleagues27 reported variance components from 12 factories in the following ranges:
  and
and  . The variance components in our study are consistent with these reported ranges.
One interesting negative finding of our study is the lack of evidence that interindividual differences in metabolism increased the between-worker variance components of the urinary metabolites relative to the air exposures. This could be because exposures to both monoterpenes and styrene were insufficiently great to saturate metabolising enzymes. For example, exposures to styrene are not expected to saturate metabolism until levels in the range of 425–850 mg/m3 (100–200 ppm) are observed,28 and our exposures were much lower than this (fig 1). Other recent studies have claimed that styrene metabolism was impeded by co-exposures to acetone.29,30 Although we did not measure acetone exposures, acetone was used in these reinforced plastics factories and could potentially have affected our results. However, one would expect the interaction of styrene exposure and acetone exposure to increase of urinary MA relative to that of styrene exposure, the opposite of what was observed.
Regarding practical aspects, two additional points are worth mentioning. First, sample sizes (repeated measurements per person) estimated under equation (3) were rather large, particularly for sawmill workers where 20 measurement per person would be needed to restrict attenuation bias to 10%. If the exposure assessment were conducted as part of an epidemiology study, it would be reasonable to measure background levels of air and urinary analytes in a control population as part of the study design. This would greatly increase  , while having a minimal impact upon
  , and thereby reducing
  and the associated attenuation bias. Second, it has long been recognised that collection of spot urine samples is convenient, particularly at the end of the work shift. However, recent development of user friendly diffusive samplers and techniques for self assessment of exposure makes air monitoring an appealing alternative.17,31–33 Finally, some investigators have used estimated within- and between-worker variance components to evaluate alternative grouping strategies, which maximise contrast in a particular population.34–36 Although these grouping strategies have been based on air measurements, the same methods could easily be applied to repeated biological samples.
In conclusion, this study indicates that personal air samplers provide data with similar or superior quality to urinary metabolites as measures of exposure to two airborne toxicants, namely, monoterpenes and styrene. If these results are consistent with those involving other urinary metabolites of rapidly eliminated organic compounds, biomonitoring should not be assumed a priori to be a superior measure of exposure for epidemiological studies.
Acknowledgments
The Swedish Council for Work Life Research and the Center for Environmental Research in Umeå supported this study; partial support was also provided by grant P30ES10126 from the US National Institute for Environmental Health Sciences. The authors are grateful to Mrs Margit Sundgren and Mr Peter von Zweigbergk for their skilful technical assistance and to Larry Kupper who provided advice about statistical analyses.