Article Text

Abstract
Objectives: Few published studies have examined the effect of air pollution on upper respiratory conditions. Furthermore, most epidemiological studies on air pollution focus on mortality or hospital admissions as the main health outcomes, but very rarely consider the effect in primary care. If pollution effects do exist then the public health impact could be considerable because of the many patient contacts involved. We investigated the relation between air pollution and upper respiratory disease as reflected in number of consultations made at family practices in London.
Methods: The study used non-parametric methods of analysis of time series data, adjusting for seasonal factors, day of the week, holiday effects, influenza, weather, pollen concentrations, and serial correlation.
Results: It was estimated that a 10–90th percentile change (13–31 μg/m3) in sulphur dioxide (SO2) measures resulted in a small increase in numbers of childhood consultation: 3.5% (95% confidence interval (95% CI 1.4% to 5.8%). Stronger associations were found in the case of a 10–90th percentile change (16–47 μg/m3) in fine particles (PM10) in adults aged 15–64 5.7% (2.9% to 8.6%), and in adults aged 65 and over: 10.2% (5.3% to 15.3%). In general, associations were strongest in elderly people, weakest in the children, and were largely found in the winter months for these two age groups, and in the summer months for adults aged 15–64. An apparent decrease in consultations was associated with ozone concentrations but this was most pronounced in colder months when ozone concentrations were at their lowest.
Conclusions: The results suggest an adverse effect of air pollution on consultations for upper respiratory symptoms, in particular in the case of PM10 and SO2. The effects are relatively small; however, due to the many consultations made in primary care, the impact on demand for services could be considerable.
- air pollution
- time series
- general practitioner consultations
- PM10, particulate matter of less than 10 μm
- URD, upper respiratory diseases
- GPRD, general practice research database
- BS, black smoke
- GAMs, generalised additive models
- AIC, Akaike's information criterion
- PACF, partial auto-correlation function
Statistics from Altmetric.com
- PM10, particulate matter of less than 10 μm
- URD, upper respiratory diseases
- GPRD, general practice research database
- BS, black smoke
- GAMs, generalised additive models
- AIC, Akaike's information criterion
- PACF, partial auto-correlation function
Despite growing concerns over levels of ambient air pollution, particularly in major urban centres, research into the effects of pollutants on upper respiratory conditions is relatively sparse. What little epidemiological work that has been conducted has generally reported a pollution effect.1–5 One study estimated a 1%–3% increase in daily outpatient visits for upper respiratory diseases in Alaska associated with a 10 μg/m3 increase in particulate matter of less than 10 μm (PM10).4 Another concluded that, although there may be a causal relation, definitive proof of whether air pollution results in significant increases in upper respiratory symptoms in children has yet to be demonstrated.6 Also, work from The Netherlands suggested that effects of air pollution were only found in symptomatic adults in polluted areas.7
A further consideration is the fact that very little information about the effects of air pollution on general practitioner (GP) consultations is available, but if these effects do exist then the public health impact could be considerable because of the many patient contacts involved. We carried out a time series analysis of daily GP consultations for upper respiratory diseases (URD) in London over a 3 year period. This study is one of the first to undertake a comprehensive analysis of this nature in primary care.
METHODS
General practitioner consultation data
Daily counts of people consulting a GP between January 1992 and December 1994 were obtained from the general practice research database (GPRD). The database consists of anonymised patients' records and is currently available from the Medicines Control Agency who manage the GPRD on behalf of the Department of Health. Participating practices are required to record all relevant morbidity and drugs prescribed, with dates, as well as an indication (diagnosis) for each prescription and the initial indication for any repeat prescription. For the 3 year period analysed, 268 718–295 740 registered patients from 45–47 practices in the Greater London area were contributing to the database. The diagnostic grouping presented in this paper is upper respiratory disease (excluding allergic rhinitis)—codes 460–3, 465, 470–5, and 478 (acute nasopharyngitis, sinusitis, pharyngitis, tonsillitis, upper respiratory infections of multiple or unspecified site, deflected nasal septum, nasal polyps, chronic pharyngitis and nasopharyngitis, chronic sinusitis, chronic disease of tonsils and adenoids, peritonsillar abscess and other disease of upper respiratory tract) from international classification of diseases, revision 9. We present the analysis for children (ages 0–14 years), adults (15–64) and elderly people (≥65).
Air pollution, meteorological, and aeroallergen data
Daily pollution data for the period 1992–94 were obtained from the air pollution division of AEA Technology. Sulphur dioxide (SO2) and black smoke (BS) measures were obtained from five sites distributed across London, nitrogen dioxide (NO2) and carbon monoxide (CO) from three sites, ozone (O3) from two sites, and one site in central London provided measures of PM10. Missing values were estimated with a regression technique in which estimates are based on concentrations obtained from other sites for the same period.8
Daily measures of maximum and minimum temperatures and relative humidity at 0600 and 1500 were obtained from Holborn in Central London from the Meteorological Office.
Pollen data from the London site of the National Pollen Network were obtained from the National Pollen Research Unit at Worcester. The pollen types considered were hazel, birch, alder, oak, nettle, grasses, plantain, lime, dock, chestnut, and willow.
Statistical methods
The time series analyses were conducted using generalised additive models (GAMs) with non-parametric smoothers to control for seasonal patterns.9 A smoother is a tool for summarising the trend in one variable, in this case the number of visits to the GP, as a function of another variable, in this case time. A loess smoother was used in this study as, relative to other smoothers, it has a particular local behaviour and so should pick up awkward shapes in the data well. The span of the smoother was varied to control the amount of smoothing carried out on the time series data. The aim was to select a span that removed long term seasonal cycles but which left patterns of a short term nature as it is these that may be due to fluctuations in concentrations of air pollution. To determine the correct amount of smoothing needed a relatively large span was initially used and the model diagnostics examined. Successive reductions in the smoothing window were then made and individual smoothers created for more problematic periods of the series, with a reassessment of model diagnostics at each step. Goodness of fit of each statistical model was assessed from the model residuals, the dispersion-penalised AIC (Akaike's Information Criterion), and the partial autocorrelation function (PACF) to determine the degree of remaining serial correlation (non-independence of adjacent days). Dummy variables were used to allow for day of the week and holiday effects. Temperature and humidity were included in the model after considering diagnostic plots of the seasonally adjusted model residuals against different lags, both single and averaged, of the meteorological variables. Depending on which were more appropriate, either parametric functions or broad smoothers of the meteorological variables were used to model the relations. The variation in the practice population over the 3 year period, counts for lagged allergic pollen measures, and the daily number of consultations for influenza (also obtained from the GPRD) were all adjusted for in the core model if necessary. Once all of these potential confounding variables had been included, the air pollution indicator was added to complete the statistical model. Allowance was made if necessary for overdispersion and serial correlation10; then robust Poisson regression was used to estimate the percentage change in the number of consultations associated with a given change in each pollutant measure. Robust regression was used as this downweighs the influence of any remaining large residuals. Due to the high degree of correlation between most pollutants, models with two pollutant measures were also run to determine whether one pollutant was more important than another. When a strong single pollutant association was found, exposure-response plots of the relative risk of consulting a GP for an upper respiratory tract complaint against the concentration of pollutant were investigated to identify the nature of the relation. All statistical analyses were carried out with S-Plus.11
RESULTS
Figure 1 shows the time series of the daily counts of consultations for URD excluding allergic rhinitis in adults between 1 January 1992 and 31 December 1994. The separate band of low consultation numbers along the bottom of the plot reflect the few consultations made during Saturdays and Sundays when most practices are closed. This strong day of the week effect was adjusted for as part of the statistical modelling. The line indicates the amount of smoothing carried out on this series to control for medium term to long term seasonal patterns (seasonality). This was achieved with a loess smoother of a span of 183 days as chosen from consideration of model diagnostics. The series suggests a dip in consultation numbers around August each year, which could, in part, reflect the time of summer holidays. The series for children and elderly people (not shown) followed a very similar pattern, and a similar amount of smoothing was carried out. Table 1 shows the mean, SD, and 10th and 90th percentiles of the air pollution and meteorological variables and the daily number of URD consultations by age group. More URD consultations were made in the cool season (October-March) compared with the warm season (April-September), and most were made by adults.
Summary statistics for daily number of consultations for upper respiratory disease and for air pollution and meteorological variables
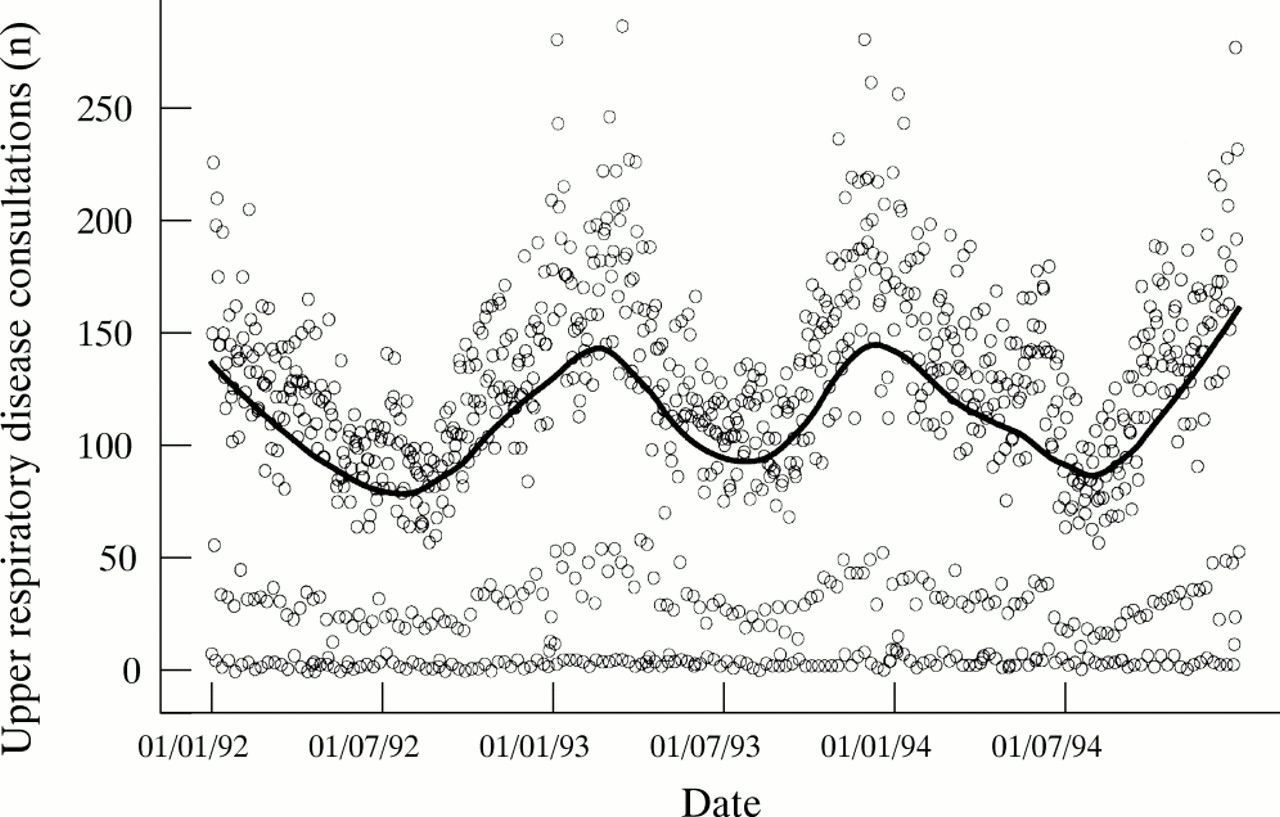
Time series of daily counts of consultations for upper respiratory disease (excluding allergic rhinitis) by adults in participating London practices between 1 January 1992 and 31 December 1994. The line indicates the amount of smoothing carried out to control for seasonality.
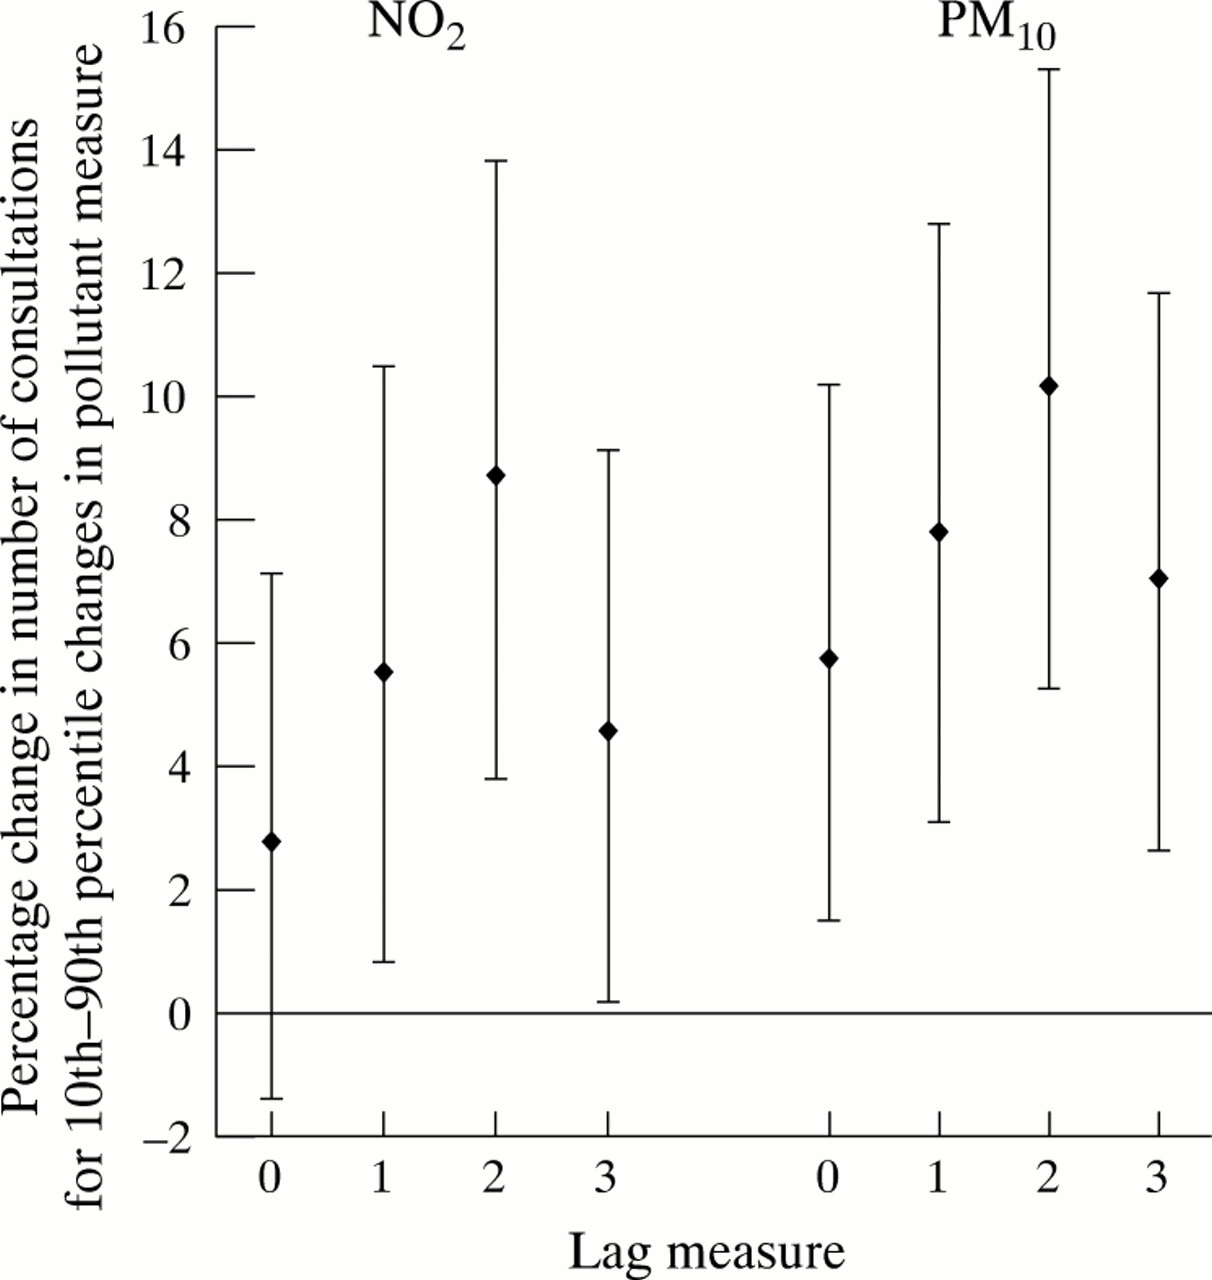
Table 2 summarises the results of the regression analyses. The percentage change in the number of consultations (95% confidence interval (95% CI)) associated with a 10–90th percentile increase in each pollutant measure is reported together with the p value. For the sake of completeness, all available pollutants were tested, even though we did not expect a direct relation between URD and some pollutants such as CO. Each pollutant was tested on four different lags: a lag of zero which is the pollutant measure on the day of consultation, a lag of 1 which is the measure 1 day before the day of consultation, and so on up to a lag of 3 days. The table reports the most significantly associated lag, regardless of whether the association was positive or negative. The results suggested an increase in consultations with generally all pollutants tested except O3. For O3 the association was consistently negative in both the summer and the winter. With the other pollutants, the estimates were smallest in the children and largest in elderly people—for example, a 10–90th percentile increase in all year PM10 measured 2 days before consultation (16–47 μg/m3) was associated with a 10.2% increase in consultation numbers (95% CI 5.3 to 15.3) in those aged 65 and over. When considering the results separately by season, the strongest associations in the children and elderly people seemed to be occurring in the cool months, but in the adults the associations were strongest in the summer period. The only seasonal difference that was significant (p<0.01) was the association with PM10 in elderly people. To investigate consistency across lags, the all year estimates obtained for all four lags tested are shown for the case of the two most strongly associated pollutants, NO2 and PM10, in elderly people (fig 2). For both pollutants, an increase in effect was found with an increase in lag, up to a lag of 2 days after which the effect size seemed to diminish.
Percentage change in number of consultations for upper respiratory disease (excluding allergic rhinitis) by age group and season

Percentage change in number of consultations (95% CI) for URD by people aged ≥65 for a 10–90th percentile change in NO2 and PM10 measures on lags 0–3.
Table 3 shows selected results of the two pollutant analysis. The diagonal elements give the most significant single pollutant model results and the off diagonal elements the results for the row pollutant in the presence of the column pollutant. The table shows that when two pollutants were considered simultaneously the estimates, including the negative O3 effect, were largely unaffected. The only exceptions to this were the NO2 effect in the adults and elderly people, which were much reduced in the presence of PM10, and vice versa.
Selected results of two pollutant analyses, URD (excluding allergic rhinitis)
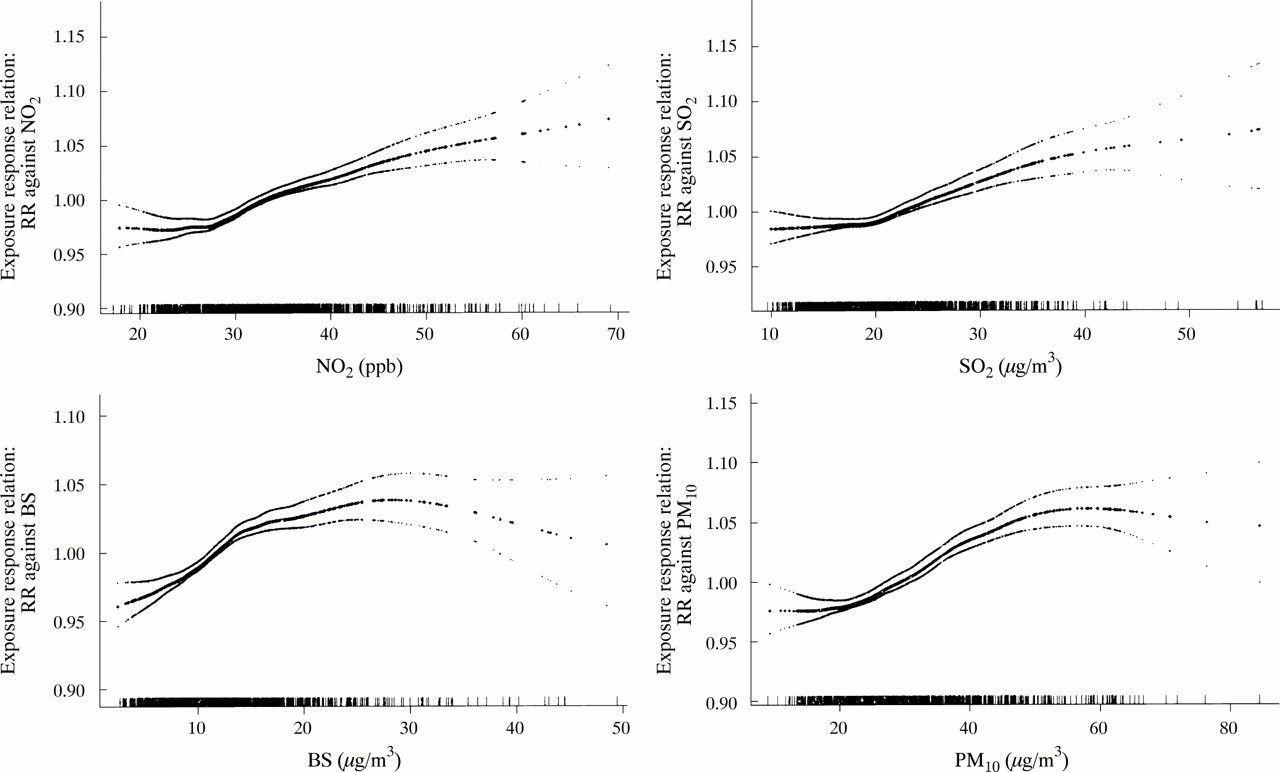
Figure 3 shows the exposure-response relations between the relative risk (RR) of consulting for URD in adults against concentrations of the four pollutant measures that were of most interest. The RR is derived from the percentage change from the formula: RR=(% change/100)+1. The relations in the children and elderly people were very similar and so are not shown. All graphs suggest that there were many days where pollutant concentrations were associated with an increased relative risk of consultation. There was a suggestion of a threshold with some pollutant concentrations above which the risk increased, and a levelling off of the risk at higher concentrations of PM10 and BS. None of the relations, however, were significantly non-linear.

Exposure-response plots of the relative risk of consulting for URD in adults (aged 15–64) against concentrations of pollutants. The range of each pollutant variable is shown on the horizontal axis and the relative risk (RR) on the vertical axis. Pointwise one standard error limits are given along with a “rug” along the bottom to indicate where prediction was based on relatively few points. The RR is derived from the percentage change by the formula: (% change/100)+1.
DISCUSSION
Our results suggest a consistent association between low concentrations of air pollution and consultations for upper respiratory disease, in particular with SO2 in children and PM10 and NO2 in elderly people and the adults. This agrees with the study by Jaakkola et al showing that, for children, air pollution can be hazardous at relatively low concentrations.5 Clinical evidence suggests that pollutants are deposited during inspiration through the nose, and are absorbed in the nasal mucosa, resulting in several deleterious effects on the body.12
The results presented in this paper only highlight the most significantly associated lag for each pollutant. However, due to the high number of significance tests being carried out, we have put more emphasis on associations that were consistent across lags and age groups, rather than on isolated significant associations at the 5% level. To investigate the consistency across the lag measures, effect estimates for all four lags were presented for the two most strongly associated pollutants, NO2 and PM10, in elderly people. This relation suggested strong consistency across lags, and that there may be an optimum time of 2 days for any detrimental effect of pollution on URD to manifest itself and present to the GP.
Our study looked at the possible associations between air pollution and consultations for URD (excluding allergic rhinitis). The effects of air pollution on allergic rhinitis have been described separately.13 Those results suggested a large detrimental SO2 and O3 effect, and were strongest in children; for this reason, it is unlikely that the results presented in this paper reflect an association with undiagnosed allergic conditions. Also, the pollen types that required controlling for in the URD core models—namely grasses, birch, and oak pollen—were of borderline significance only.
Time series of GP consultations, more than any other health outcome, are strongly influenced by human behaviour and service availability. Also, the source of our GP data, the GPRD, does not distinguish between patients making emergency consultations and those coming in for routine prescriptions. This would have the effect of making our time series more “noisy”—that is, would further complicate the process of identifying cycles in the series. Also, the URD diagnostic category used in this analysis consisted of several different diseases, some of which were acute conditions and some of which were chronic. For these reasons, modelling the URD series was problematic, and in the case of the core models for children and adults, the overall model diagnostics were slightly worse than those in the model for elderly people; this may have resulted in a dilution of the true size of the effect in the two younger age groups.
The pollution effects found were strongest in elderly people, although the 95% CIs for the estimates were wide due to the relatively small number of URD consultations made by this age group. Associations in the children and elderly people were stronger in the winter periods, although this is unlikely to be due to confounding by influenza epidemics as daily counts for influenza were controlled for in all models. Consultation numbers for URD in all of the age groups were higher in the winter months, leading to greater statistical power. However, power should not affect the size of the effect estimates. These estimates were relatively small, thus showing that air pollution is only responsible for a small proportion of consultations for URD; however, due to the many consultations in primary care, the impact on demand for services is of major interest.
A negative association with O3 was found in all age groups; however, this only reached significance in the winter months, even though O3 concentrations are at their highest in the warm season. One explanation of the negative association could be that O3 is highly negatively correlated with most other pollutants, thus days when O3 concentrations are relatively high could be an indicator of low concentrations of other pollutants. However, if this was occurring then the negative effect should have disappeared when two pollutants were considered simultaneously, unless it is also highly correlated with an unmeasured pollutant—such as PM2.5. Sensitivity analyses on the temperature and humidity variables had no appreciable effect on our O3 estimates. This negative association with O3 has been found in other studies14 and requires further investigation.
Main messages
-
Acute effects of air pollution were found on consultations for upper respiratory disease.
-
PM10 and SO2 seemed to be the pollutants that were most consistently associated with an increase in consultations.
Policy implications
-
Effects were found at relatively low concentrations of air pollution.
-
Effects were small, but due to the many patient contacts in primary care, the impact on demand for services could be considerable.
Exposure-response plots suggested a levelling off or a slight decrease in the risk of consulting at relatively high concentrations of some pollutants. A reason for this could be a decrease in the proportion of susceptible people—that is, as pollution concentrations get higher more and more people seek medical help (or treat themselves using a pharmacy) and thus remove themselves from the group at risk, until finally an eventual threshold is reached.
In summary our results suggest an acute effect of low concentrations of air pollution on upper respiratory diagnoses, in particular with PM10 and SO2, and shows that primary care is a feasible source of data for studies of this type.
Acknowledgments
This project was funded by the Department of Health (JR 121/6267) and formed one part of a larger project looking at the effects of air pollution on daily mortality, hospital admissions, accident and emergency visits, and GP consultations. The collaborative group comprised HR Anderson, RW Atkinson, MJ Bland, JS Bower, J Emberlin, A Haines, AJ McMichael, and DP Strachan.
REFERENCES
Commentary
Could air pollutants be good for us?
The title is intended to catch your eye. It is generally believed that air pollution is a wholly bad thing, with dire effects on health. In spite of the dramatic improvements in air quality that have occurred in highly developed countries such as the United Kingdom, there is consistent evidence that low concentrations of some pollutants are associated with excess deaths, hospitalisations, and episodes of illness. These data have been used to calculate the possible costs to society of pollution and the savings that might be associated with its reduction. Since it is clearly impossible to eliminate all pollution, a proportion of which is not the result of human activity, the question arises “Is there a concentration at which harm does not occur?”. Indeed, as we have coexisted with pollution since we invented fire, and before then, could there be some evolutionary advantage to low level pollution exposure? We are becoming familiar with the concept that too hygienic a society may not be wholly good; adolescent poliomyelitis increased when infant infection rates fell and it has even been proposed that falls in early childhood infections have caused the rise in allergic diseases.
The question as to whether there is a linear relation passing through zero between health effects and pollutant concentrations is important in economic terms. If there is, health benefits accrue with every downward step taken in control, whereas if there is a threshold there is a point at which we set a standard, adhere to it, and save on further costs. For example, the predicted annual effects of current ozone concentrations in the UK range from 700 deaths brought forward and 500 respiratory hospitalisations if a threshold of 50 ppb is assumed, to 12 500 and 9900 respectively if there is no threshold.1 Achievement of the 50 ppb standard would reduce these figures to nil.
There appears to be an inverse ecological association between levels of particulate pollution and prevalence of asthma across different countries, the most highly polluted having the lowest prevalences. It is at least as reasonable to suggest that particles may protect against asthma as it is to suggest that asthma prevalence has increased because of a fall in infections (though I suspect that it is largely a result of population dietary differences). After all, the lung probably sees particles as potential invading organisms and the interaction between lung and particles is probably broadly similar to that between lung and microorganisms. Counter-intuitive observations are very important clues as to disease aetiology and should not be dismissed without serious thought, an issue raised by Hajat and colleagues.
In a very sophisticated and careful analysis, these authors have shown evidence of increasing general practice consultations, for what are presumably mainly viral upper respiratory symptoms, with increasing traffic related air pollution. Incidentally, in doing so they have come as close as any statistician dares admit to showing thresholds of effects in populations, something that the St George's group have discussed before.2 What also caught my eye was the consistently negative (or apparently beneficial) effect of ozone. In an earlier draft, the authors had characterised this as “probably spurious”. However, why should such a finding not have as much weight as a positive association, simply because it is not based on a plausible hypothesis? Biological plausibility is the least important of Sir Austin Bradford Hill's viewpoints; as he pointed out himself, it depends on current biological understanding. The effect of ozone appears greatest in the cool season, when most consultations occur and when ozone concentrations are lower. Could low concentrations of ozone be good for you in protection against upper respiratory infections and possibly other conditions? After all, production of free radicals is one way we deal with invading organisms ourselves. There is also a closely analogous example of a pollutant gas that is beneficial at low concentrations and toxic at high concentrations—oxygen.
The Victorians mistook the smell of seaweed for that of ozone, and built splendid seaside resorts to take advantage of this bracing air. Maybe they had a point.