Article Text

Abstract
OBJECTIVES Previous projections of mortality from mesothelioma among French men have used the age-generation method, based on the Poisson regression model. In this study an alternative method to model mortality from mesothelioma was used to predict its future trend: this method was based on the risk function that links this mortality to past exposure to asbestos, combined with population exposure data.
METHOD Data on past French asbestos imports were used to model the overall past exposure to asbestos in men and assess two extreme scenarios (optimistic and pessimistic) for its future trends. The number of male deaths occurring between the ages of 50 and 79, from 1997–2050, was then calculated with the risk function for mesothelioma.
RESULTS The results showed that mortality from mesothelioma among French men aged 50–79 will continue to increase, reaching a peak averaging between 1140 (optimistic scenario) and 1300 deaths (pessimistic scenario) annually around the years 2030 and 2040, respectively. No preventive measures applied now will affect this trend before then. These results are similar to those of two other predictions of mortality from mesothelioma among French men: a peak around 2030 of 800–1600 deaths annually among men aged 25–89 years, and a peak around 2020 of 1550 deaths annually among men aged 40–84.
CONCLUSIONS Our results indicate that between 1997 and 2050, the most optimistic and pessimistic trends of future exposure will lead to the deaths from mesothelioma of between 44 480 and 57 020 men, with a corresponding loss of from 877 200 to 1 171 500 person-years of life.
- mesothelioma
- risk function
- mortality trends
- prediction
- France
Statistics from Altmetric.com
Asbestos has been used extensively in industrialised countries for more than a century, causing continuing increases in mortality from mesothelioma.1 2 The mortality from mesothelioma in France has increased roughly 50-fold among men and 10-fold among women from 1925 to 1996. Because of continuing exposure and the long latency period of the disease,3 mortality from mesothelioma will continue to increase for several more decades in France.
The future trend in mortality from mesothelioma has been predicted for the United Kingdom4 and the United States.2In both nations, it will continue to increase, peaking, respectively, around 2020 and 2000. These predictions are derived from age-cohort models: the effects of age and birth cohort are estimated by fitting a log linear Poisson model to the age specific death rates for each 5 year calendar period.5 Gilg Soit Ilget al 6 and Petoet al 1 also used an age-cohort model and similar assumptions about the risk of death from mesothelioma in future birth cohorts to predict the future burden of mortality from mesothelioma in France. Although in both the United Kingdom and the United States the risk of death per birth-cohort has already peaked, the available data indicate that it continues to increase in France.
The aim of this study was to predict the future trends in mortality from mesothelioma in French men by a different method. With data on asbestos imports to assess the change of the population's global exposure and a risk function that calculates the risk of death from mesothelioma as a function of past exposure, we modelled past mortality from mesothelioma. We then projected future mortality according to various hypotheses about future exposure trends.
Data and methods
PAST TRENDS IN EXPOSURE TO ASBESTOS
The qualitative and quantitative variations in asbestos imports may realistically be considered as major factors affecting past occupational exposure in France. Almost all the asbestos used here was imported. These imports probably began around the turn of the century, but data are not available for the periods before 1937 and after 1994 (according to the French Asbestos Association). After a break during the second world war, imports resumed and increased steeply, reaching their peak in 1975. Imports were banned definitively in 1997 (fig 1). Although little information is available about the types of asbestos imported, chrysotile (the least harmful asbestos for mesothelioma7) seems to have been the most common. Four phases may be distinguished: (a) before 1937, the quantity of asbestos imports was probably low; (b) between 1937 and 1945, almost no asbestos was imported, because of the war; (c) after the second world war ended there was a steep increase in asbestos imports until 1975; (d) after 1975, asbestos imports decreased, ending finally in 1997.

Past French asbestos imports.
MORTALITY FROM MESOTHELIOMA
No mesothelioma registry exists in France, nor is this cause of death a specific category used in death certificates. Deaths from mesothelioma are recorded among the deaths from pleural cancer. French mortality data by age and sex are available from 1925 onward—that is, from the first year that the 3rd revision of the international classification for diseases (ICD-3) was used here. From 1925 to 1996, seven successive revisions (ICD-3 to ICD-9) have been used (table 1). Vallin and Meslé have estimated the number of deaths corresponding to ICD-9 in 1925–78 (the last year that the 8th revision was used).8 9
Revisions of the ICD code and codes including pleural cancer in each revision
We calculated the number of deaths in men from mesothelioma by multiplying the number of registered deaths under ICD 163 by 0.81, a multiplier obtained from the data of two different studies that estimated overregistration and underregistration.10 11Because mesothelioma is rare in young people, and difficult to diagnose in elderly people, we took into account mortality in the ages 50–79 years, considering data for deaths outside this age range insufficiently reliable.
Three phases could be distinguished in the trend of the observed mortality from mesothelioma (fig 2): a stationary, low rate before 1940, a slowly increasing rate in 1940–1970, and a steep slope after 1970. The initial stationary rate may correspond to the background incidence without exposure. Because the latency period for mesothelioma is about 35 years,3 exposure to asbestos, which began early in this century, should have affected the mortality from mesothelioma from roughly 1940 onward. The rapid increase in the rate that began around 1975 corresponds, in view of the latency period, to the post-war period, when the industrial use of asbestos became widespread.
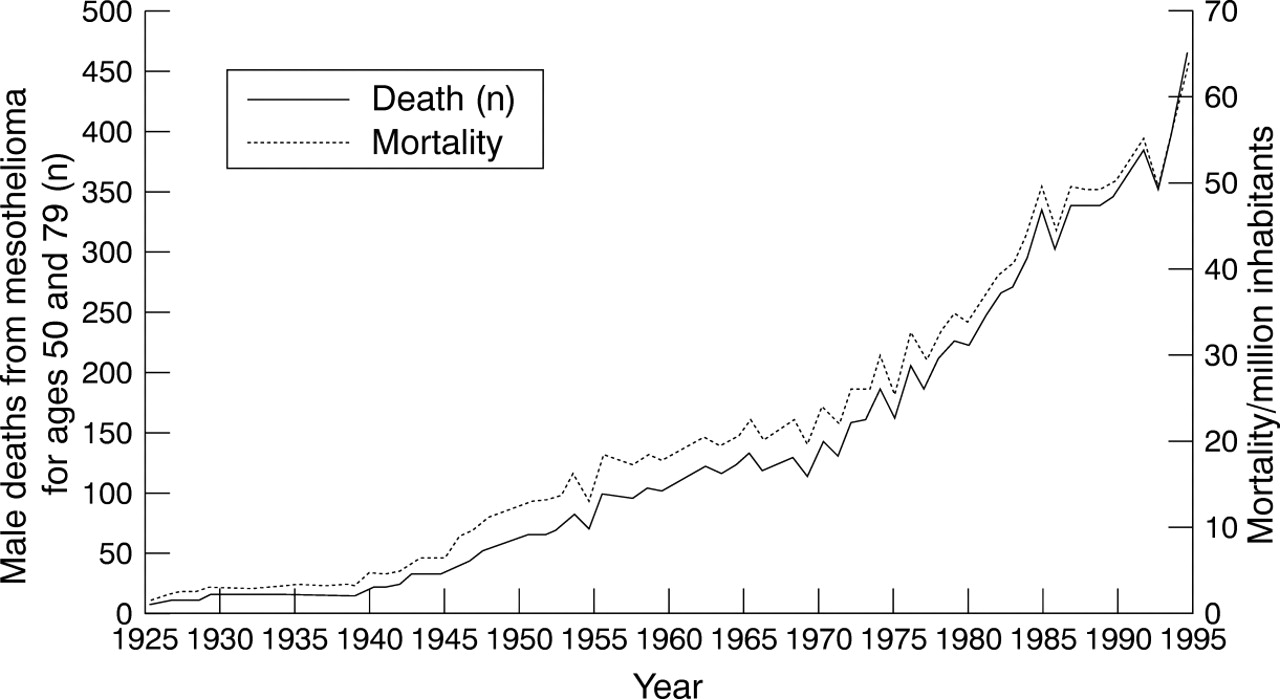
Trends in past incidence and mortality of mesothelioma among men in France.
RISK FUNCTION
Our approach is based on a risk function composed of two separate functions: a background risk function (the right hand term in the right hand side of equation 1), which depends only on age12 and a function for the excess risk due to exposure to asbestos (the left hand term in the right hand side of equation 1), which links a person's risk of dying from mesotheliomaR(A) at a given ageA with their past exposure to asbestos. In this excess risk function, each brief period of exposure at agea<A increases subsequent risk by an amount proportional to the concentration of exposure at that agec(a) multiplied by a power of time from that point A-a
13:

Ke andKb are the coefficients, andP e andPb the exponents for the excess risk and background risk functions, respectively.
The risk function for mesothelioma has been studied in the past, and its parameters have been estimated.13-16 Almost all of these studies, however, are based on groups of highly and uniformly exposed workers. We estimated the parameters of equation 1 for a general population with heterogeneous and mostly low levels of exposure.
(1) To estimate the parameters of the background model (the right hand term in the right hand side of equation 1), we used the mortality data from 1925 to 1935. Because asbestos imports into France began around the turn of the century, and because of the lag period of mesothelioma of 30–40 years, any occupational exposure to asbestos affecting mortality from mesothelioma in 1925–35 would have occurred before 1900. Moreover, this mortality was relatively stable over the decade in question (fig 2). All these reasons, taken together, justify considering mortality from mesothelioma during this decade to be the background level. We estimated this mortality per year (11 years from 1925 to 1935) and per age group (six groups from 50–4 to 75–9 years) according to the background model and fitted it to the real data by varying Kb andpb . This resulted inpb =3.5 andKb =1.5×10⁻¹², in accordance with previous estimates.12
(2) The parameters of the excess risk function were assessed on the basis of a sample of the French male population for whom the history of exposure to asbestos was known.17 We used the bootstrap resampling method: 1000 bootstrapped samples were drawn from the original sample, and for each one, the risk per year and per age group has been calculated according to equation 1. Previously calculated parameters have been used for the background risk.Ke andpe were varied for each sample to get the best fit to the real (observed) data. This resulted in 1000 values for Ke andpe . We found that forpe in the range 3.4–4.7, andKe in the range 3.34×10⁻¹²–6.38×10⁻¹⁰, and a background mortality from mesothelioma proportional to the 3.5th power of age (Pb =3.5) (with a proportionality coefficient Kb of 1.5×10⁻¹²), we can satisfactorily model the past mortality from mesothelioma in the French male population. Previous estimations of pe lie within the range 2–3, whereas those for Ke are roughly 10-10–10-8.16
HYPOTHESIS OF A STANDARD EXPOSURE WINDOW
To facilitate the modelling here, we have assumed that all exposed people were the same age at first exposure (A0) and were exposed for the same duration of time L. Then, witha as the age variable, we define the function U as follows:

and then denote as ci the level of exposure for individual i. The function c(a) in equation 1 becomes

and ci
is the only term that varies among people. Thus, withRi(A) representing the risk for individual i at ageA, equation 1 becomes

The risk at every age for each birth-year cohort is calculated as the mean of the corresponding individual risks—that is,ci is replaced by its mean—and equation 4 provides the mean risk at a given age. Because this mean risk is calculated by generation and all the other parameters are constant for each generation, the mean of eachci (the mean exposure level per generation) is the only term that varies among generations and thus the only term that represents the variation in exposure among generations. The proportion of exposed people is thus included in this mean level and does not need to be assessed separately (a generation with fewer, but more highly exposed people may result in the same mean exposure level). The mathematical consequence of the standard exposure window hypothesis is that the distribution of the exposure among a generation is of no importance and only the mean of exposure levels counts. We assessed the past trend in the mean exposure level per generation (ci ) from data about French asbestos imports and predicted its future trend on the basis of two extreme hypotheses, optimistic and pessimistic.
Trend in the mean exposure level per generation: according to our assumption, the age at first exposure,A0
, is the same for all cohorts. This means that all exposed jobs that began in a given year correspond to people in the same birth cohort. To model the past trend in this mean exposure concentration, we assumed that for all jobs that began in a given year, the mean exposure concentration (the mean of all exposure levels including zero) varied according to the level of asbestos imports. That is, it went through five phases: slow increase, steady increase, stationary, decrease, and residual (fig 3). According to this assumption, exposure began in yearY0
: the mean exposure concentration was higher for workers who started their job in yearY0+1 than for those who started in Y0
. The rate of increase was low until year Y1
and higher thereafter, until the highest concentration,Emax, was reached in yearY2
(Y1
andY2
are years of start of exposure, and Emax is the mean annual exposure in fibres/ml/year). We assumed that the mean exposure concentration of people whose exposure began in yearY1
wasλEmax
withλ<1. We also assumed that the maximum concentration continued until yearY3
, decreased thereafter to reach the residual level of γEmax
for year Y4
, and will continue at this concentration for a long period (fig 3). This assumption is represented by the productEmax
×E(Y0
,Y1
,Y2
,Y3
,Y4
,λ, γ ; g+A0
), which provides the annual mean exposure concentration for generation g; E is the function in figure 3 and varies between 0 and 1. Finally the mean risk for generationg at age A is given by:

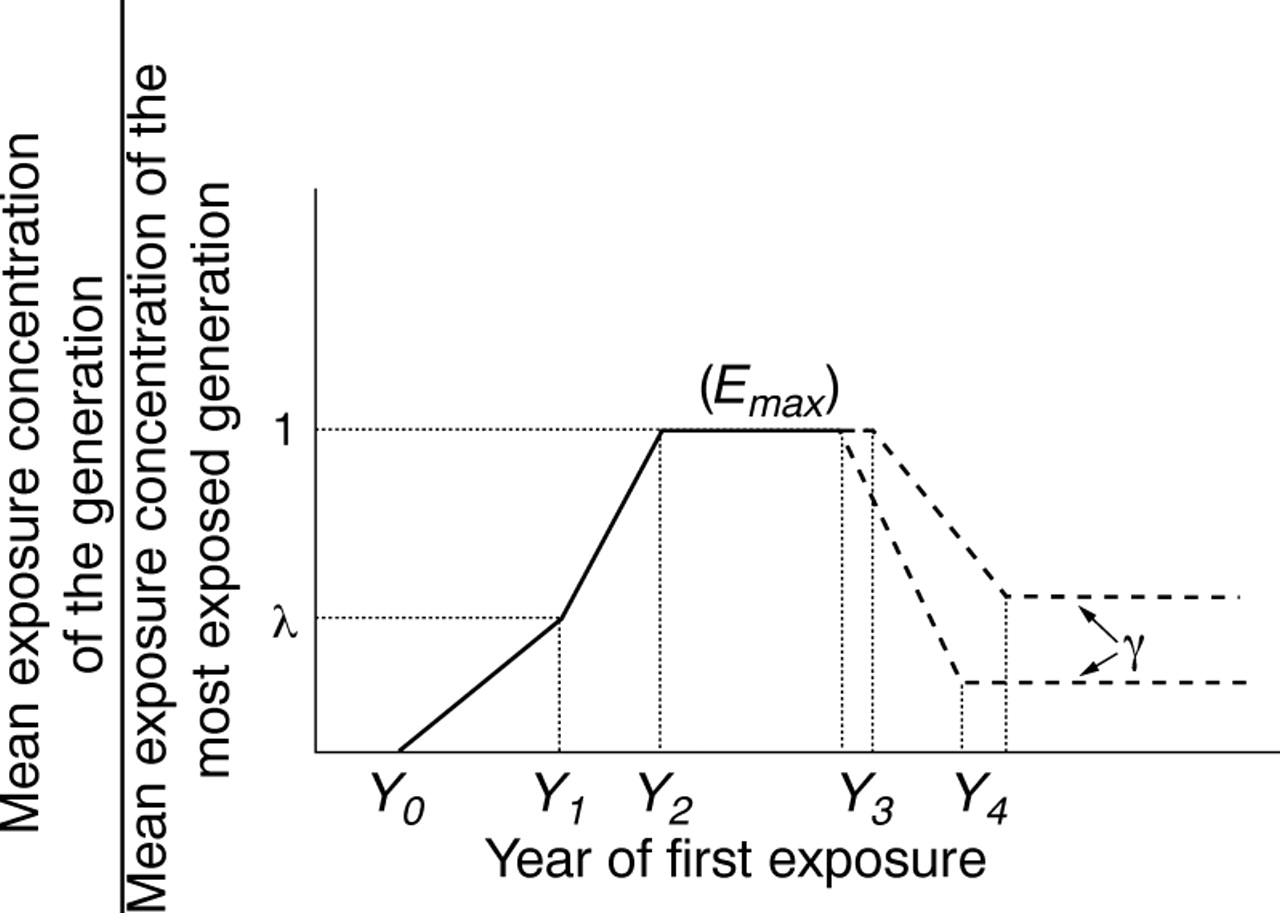
Trends in the mean exposure level per age at first exposure.
THE MODEL'S PARAMETERS
The model's parameters are (1)Ke
,Kb
,Pe
andPb:, the parameters of the risk function; (2) A0
andL, the parameters of the pattern of individual exposure time; and (3) λ, γ andEmax
, the parameters of the change in the mean exposure by generation fromY0
toY4
. Because Emax(multiplied by Ke,) is common to all expressions in the excess risk model, it can be factorised, and the product KeEmax
considered as one coefficient. The risk of dying from mesothelioma was calculated for the period from 1925 (the first year for which data are available) to 2050, and for ages 50–79—that is, for the cohort born in 1845 to that born in 2000. The corresponding number of deaths per age has been calculated as the product of the risk for each birth cohort and each age included in our study multiplied by the corresponding population size (real population size for the past, and future projections supplied by the French National Institute for Statistics and Economics Studies, INSEE). The KeEmax
product was varied to get the best fit between estimated and observed data (deaths 1925–96 per age group from 50–4 to 74–9: 432 cells or pairs of observed-estimated data) by minimising the quadratic distance between the two sets of data. The goodness of fit was assessed by the distance d, defined as

where Oi is the observed and Ei the estimated number of deaths. To avoid very low values ofEi in the period of 1925–34, when there were very few deaths from mesothelioma, specially in the younger age groups, we merged the cells over this period into 5 year periods. For example, instead of 10 cells for the 50–4 age group and the 1925–34 period, we used two cells, corresponding to the 1925–9 and 1930–4 periods. This resulted in 384 rather than 432 cells.
We varied the excess risk model parameters through some plausible ranges (table 2). The range forPe (2–5) was determined to include previous estimates as well as our sample based estimates. The ranges of Y0 ,Y1 ,Y 2, andλ were based upon the asbestos import data. Figures 1 and 3 show Y0 around 1900 for first exposures,Y1 around 1945 for the steep increase in asbestos imports and use after the second world war,Y2 around 1975 for the peak of asbestos imports, and λ 0.1–0.5 to cover all possibilities suggested by the trend in asbestos imports already discussed. Those for A0 (the standard age at first exposure) and L (the standard duration of exposure) were chosen to cover all the plausible possibilities. For further projections, we defined two extreme scenarios: (a) the mean exposure decreased rapidly for jobs starting after 1980 or 1990 (Y3 =1980,1990) and will reach the residual concentration of 10% ofEmax (γ=0.1), for jobs beginning after 2010 (Y4 =2010); and (b) exposure will stay at its maximum concentration until the end of our study (γ=1). We repeated all the processes already described (calculating the number of deaths per generation and per age, fitting the results to the observed data by varying the KeEmax coefficient and calculating the distance dfor every combination of parameters (15 138 819 combinations). We used d to compare the fits among them: the best fit corresponds to the scenario resulting in the lowest value ford; for the sensitivity analysis, we defined by analogy to the χ2 statistic an acceptability threshold for d equal to the value of χ2with 384 degrees of freedom and α=0.05.
Range of variation of parameters affecting the fit
For each year in 1997–2050, it has been assumed that all men at an age have a life expectancy equal to the mean for men at that age in 1995. This procedure assumes that life expectancy will not change throughout the next half century. We calculated the number of person-years lost because of deaths from mesothelioma (per year and per age), as the product of the corresponding number of deaths and life expectancy.
All programs were written in the Matlabspecific and C programming languages running under theMatlab environment.
Results
The mortality data used to fit the model came from the period 1925–96. Both the optimistic and pessimistic scenarios resulted in the same mortality at each point during this period (for any given set of other parameters) and, therefore, in the same fit and the same value for the KeEmax coefficient. The difference between the two extreme scenarios appeared only after 2020. The best fit (lowest d) was obtained with pe =4,A0 = 27,L = 5, Y0 = 1898, Y1 = 1940,Y2 = 1975,Y3 = 1980 or 1990, andλ = 0.3. The range ofY3 did not affect the fit over the period 1925–96 corresponding to the observed data. Of 15 138 819 parameter combinations (for each of the optimistic and pessimistic scenarios), 71 152 resulted in acceptable fits, with ad value below our defined threshold.
Table 3 compares the observed and calculated numbers of deaths grouped by 5 year age groups and periods.
Number of deaths observed (top) and estimated (2.5–97.5 percentiles)
Diverse effects resulted from varying the model's parameters. ReducingA0 led to an increase in the projected mortality, especially in the pessimistic scenario, because of its preponderant effect on mortality after 1996. VaryingL, the duration of exposure, had almost no effect on mortality. Reducing Y0 increased the risk for the first generations exposed, and thus the number of deaths before 1996; consequently, it reduced the coefficientKeEmax and projected mortality. Either increasing Y1 or decreasing λ reduced the number of deaths before 1996 and increased both the coefficientKeEmax and the projected mortality. IncreasingY2 increased overall projected mortality; its effect on the results was greatest whenλ was lowest. The effects ofY3, Y4, and γ were exerted primarily on the generations in which most of the deaths between the ages of 50 and 79 years did or will appear after 1996. Their increase will thus cause projected mortality to increase. The increase of the exponent pe resulted in an exponential increase of the mortality among older age groups. To offset this effect, the fitting process automatically decreased theKeEmax coefficient at the same time as it shifted theY0 –Y2 parameters slightly to the left.
Table 4 reports the range of parameters that resulted in acceptable fits. Note that the ranges mentioned here are not confidence intervals. The mean (range) pe parameter was 3.65 (3–4.5). The mean (range) age at first exposure,A0 was 27.75 (21–30). The mean (range) duration of exposure L was 13.5 (1–30).i
Ranges of parameters of the selected scenarios
The mean (range)KeEmax coefficient was 1.52×10⁻¹¹ (2.28×10⁻¹³ to 6.24×10⁻¹¹). Data from the sample17 showed that the most exposed cohort was that born around the year 1940; its mean cumulative exposure was about 0.8 fibres/ml.Ke can be calculated by multiplying KeEmax by the duration of exposure L and then dividing by 0.8. This equation yielded a mean (range) forKe of 3.9×10⁻¹⁰(2.66×10⁻⁹ to 4.98×10⁻¹³).
Figure 4 and table 5 report the mortality results for both the optimistic and pessimistic scenarios. In both, mortality from mesothelioma will continue to increase and will reach a peak between 2025 and 2040. In the optimistic scenario, the mean (2.5–97.5 percentile) was 1140 (820–1480) deaths per year for people aged 50–79 (all results corresponding to the best fit scenario are quite close to the mean values, which could therefore be regarded as the results of the scenario that best fits the observed data), and will be reached around 2027; mortality will drop thereafter; and for the period 1997–2050 there will be 44 480 (32 860–58 910) mean (range) deaths, and 877 200 (647 300–1 163 100) lost person-years attributable to mesothelioma. The pessimistic scenario foresees a mean (range) 1300 (990–1630) deaths annually in about 2040; it will stay at this maximum value (saturation level) until the end of the study. This corresponds to 57 020 (45 430–68 730) mean (range) deaths and 1 171 500 (913 800–1 419 ) lost person-years during the period 1997–2050.

Mortality from mesothelioma and projections. Observed data (thick grey circled line); optimistic (full line) and pessimistic (dashed lines) projections, with minimum, 2.5 percentile, mean, 97.5 percentile, and maximum respectively from bottom to top. Mean curves are very close to the best fits (not shown here).
Results overview
These results indicate that any reduction in exposure to asbestos now will not affect the trend in mortality from mesothelioma before the year 2030. Such a reduction would, however, save about 10 000 lives and 275 000 person-years of life to the year 2050.
Discussion
The number of deaths from mesothelioma has been estimated from deaths coded as pleural cancer (code 163 ICD-9). Based on studies limited in time and space,10 11 we used the ratio 0.81 between the number of deaths from pleural mesothelioma and all deaths coded ICD 163 as established around 1990, a period during which the epidemic of mesothelioma associated with asbestos was well under way. None the less, we applied it to data for France as a whole for the entire period 1925–96, thereby assuming that these ratios remained constant over this 72 year interval. If, however, other types of pleural cancer did not increase during the period under consideration, the 0.81 ratio would tend to overestimate the number of past deaths from pleural mesothelioma and would thus lead to an underestimation in our projections.
Another source of error could also involve the number of past deaths from pleural cancer. These were estimated over several revisions of the ICD, and each estimation could be a source of error. Also, the coding process necessarily includes errors. Technological advances in medicine are leading to ever more exact diagnoses of cause of death. It is thus highly probable that the risk of classification errors in both directions (false positive and false negative) is more common for the older data. None the less, these two errors seem to be independent, and we hope that they essentially cancel each other out.
Despite all of these possible sources of error, these data and estimates are the only means we have to come close to an accurate assessment of the number of deaths from mesothelioma. We have tried to reduce these errors by considering an age interval for which diagnostic error is relatively less frequent. In the absence of more reliable data, these are the best mortality figures available.
Peto et al used a ratio of 1 for overall deaths in men from mesothelioma to mortality from pleural cancer for the French data.1 Our estimation of 81% is based on data that include certain and probable mesotheliomas. If we had included the tumours considered as possible mesotheliomas, we too would have obtained a ratio of 100%. Substituting a 100% ratio increases all the results presented above by 20%. Gilg Soit Ilg et al used the value of 0.797 for this coefficient.6This slight difference arises from a difference in our initial data.
Our choice to standardise age at first exposure and duration of exposure was hypothetical. It did, however, allow mean exposure concentrations to be assessed for each birth year cohort rather than for each person separately. We compared actual mortality with the application of this hypothesis among a sample of French men with precise individual histories of exposure to asbestos.17 We calculated the mean risk per age and per cohort by two methods: (a) taking into account individual exposure profiles, with different ages at first exposure, durations of exposure and exposure concentrations, and (b) assigning the same age at first exposure and the same duration of exposure to all exposed people; for these parameters we used the values found to result in acceptable fits. The two methods yielded similar approximations of the risks (results not shown). Furthermore, the results obtained with this conjectural assumption fit the observed data well.
The figures on imports of asbestos provide a rough measure of the French population's global exposure, as imports have been the exclusive source of asbestos in France. Takahashiet al have shown that, with a time lag, there is a strong correlation between overall consumption of asbestos and both the incidence of and mortality from mesothelioma in 10 western nations and Japan.18 The curve of mortality from mesothelioma for Great Britain presented by Peto et al matches almost perfectly the curve of asbestos imports for that country (with a lag of roughly 50 years).4 We can therefore reasonably assume that an increase in asbestos imports augments the exposure of the overall population—either exposure concentration or the proportion of exposed people, or both—proportionately to the rate of that increase. We can also assume that the contaminating effect of imported asbestos continues for a long time after being imported, so the consequences of decreased imports are less evident, at least over the short term. The cumulative effect of previously imported asbestos may persist for several years, through several stages of its use, from the asbestos transformation industry involved almost immediately after importation to the subsequent changes in materials that contain asbestos, which may occur years later. Our two extreme hypotheses are designed to cover all possibilities. Regulatory actions that aim to reduce exposure to asbestos partially decreased the exposure of the overall population: the first regulations in France were issued fairly late, in 1977, and concerned only a small fraction of the general population of French men. Moreover, although the first wave of deaths from mesothelioma resulted from high exposure among the small group of workers involved in asbestos production and transformation, from the 1980s onward nearly all cases have been due to lower concentrations of exposure on a much wider scale. These are associated with manufacture of material containing asbestos, and at least until very recently in France, have not been affected by the protective measures taken.4 7 19 We can assume that our optimistic scenario, which concerns the generations whose first exposure occurred after 1980 (Y4 ) takes all current regulations into account for these generations.
Our projections—both pessimistic and optimistic scenarios included—for around the year 2030 range between 820 and 1630 deaths annually and are thus close to those of Gilg Soit Ilget al, who projected between 800 and 1600 deaths annually around the year 2030. Their optimistic hypothesis assumes that the risks of future birth cohorts, starting at the value estimated for the 1954–8 birth cohort, will decrease continuously to zero for the cohort born in 2034–8; their pessimistic hypothesis supposes that the risks of future birth cohort risks will stay at the level of the highest estimated past cohort. They calculated the male mortality for ages 25–89, whereas we considered only men aged 50–79 years. The risk of mesothelioma is low before the age of 50, and although it is higher in older age groups, after the age of 80, the relatively small population for this age group means that the actual number of deaths is low.
Their pessimistic projection reaches a steady state of 2500 deaths annually around the year 2050, whereas our comparable scenario projects a steady state of 990–1630 deaths annually around the year 2040. Some of this difference may be explained by the increased life expectancy combined with consideration of deaths from mesothelioma after the age of 80. Also, Gilg Soit Ilg et al used observed data for the period 1951–95, whereas we used observations from 1925 to 1996 and thus fitted our model to more points. Petoet al, with the same method as Gilg Soit Ilget al, predicted a peak of 1550 deaths annually around the year 2020 for the French male population, with a total of 45 000 deaths to men of 40–84 years old in 1995–2029.1 They presumed an overall ratio of deaths from mesothelioma to deaths from pleural cancer of 1:1; had they used the 0.81 ratio, their peak value would have been 1255 deaths annually, close to our results.
Conclusion
We modelled past trends in exposure to asbestos in French men with data on asbestos imports and past mortality from mesothelioma. With two extreme hypotheses on future exposure trends and a risk function that indexes the risk of death from mesothelioma as a function of past exposure to asbestos, we have calculated the number of deaths from mesothelioma to the end of 2050.
According to our results, the number of deaths from mesothelioma among French men aged 50–79 will continue to increase, reaching a peak of 820–1300 deaths annually around the year 2030. Until that year, no preventive measure applied now will affect this trend.
From 1997 to 2050, the most optimistic and pessimistic trends of future exposure will lead to the deaths of 44 480–57 020 men from mesothelioma, with a corresponding loss of 877 200–1 171 500 person-years of life.
Our results indicate that no future preventive measures will affect the trend in mortality from mesothelioma in men until after 2030. The banning of imports that began in 1997 in France will certainly play an important part in an immediate reduction in high exposure and a longer term reduction in lower exposures. Most of the deaths in the future, however, will be due to intermediate and low concentrations of exposure affecting a large portion of the population. Thus, although the French occupational health and safety authorities have taken many measures in recent years to improve protection, especially for the many occupations involved in work with materials containing asbestos—for example, in the construction industry—more concrete measures are required to protect most of the exposed population. Removal of existing asbestos, especially in buildings, could be an effective protection, provided that it could be done in a way that was safe for the workers involved.
Acknowledgments
This work was supported by grants from the Ministère du Travail and La Ligue Nationale contre le Cancer. Special thanks to Dr Jean-Pierre Nakache and Jo Ann Cahn for their invaluable help.