Article Text

Abstract
OBJECTIVES To investigate the relation between fluctuations in personal exposure to nitrogen dioxide (NO2) in school children and changes in outdoor NO2 concentrations.
METHODS 114 Asthmatic school children aged 7–12 years were recruited from the Southampton area. Weekly average personal exposures to NO2 were measured over a 13 month period with passive diffusion tubes. At the same time, outdoor NO2 concentrations were monitored at a fixed site in the centre of Southampton. Correlations between weekly personal exposures and mean outdoor concentrations during the same periods were examined.
RESULTS Mean duration of follow up was 32 weeks. Measurements of weekly mean personal NO2 exposures were generally low and ranged from 0.7 to 496 μg/m3 with a geometric mean of 17 μg/m3. Substantial variation in personal exposures occurred between children and more especially within individual children from week to week. Daily outdoor concentrations of NO2 ranged from 4.3 to 29.8 μg/m3, with a geometric mean of 12.3 μg/m3. There was no evidence of seasonal variation in outdoor concentrations. No significant correlation was found between each child's weekly mean personal exposures to NO2 and mean outdoor concentrations for the corresponding periods.
CONCLUSION At low outdoor NO2 concentrations, fluctuations in NO2in outdoor air as measured at a central monitoring station do not contribute importantly to variations in personal exposure when averaged over a week.
- personal monitoring
- nitrogen dioxide
- ambient
Statistics from Altmetric.com
Nitrogen dioxide (NO2) occurs as a pollutant in both outdoor and indoor air. Outdoors, the main source is motor vehicle exhaust. Inside buildings, it arises not only through ingress of outdoor air, but also as a combustion product from gas cookers, kerosene heaters, and cigarette smoking. In the United Kingdom, the government has adopted a standard for NO2 in outdoor air of 150 ppb (282 μg/m3) measured as an hourly mean.1 This standard is based on findings in epidemiological studies that have related temporal variations in health outcomes to changes in the concentration of NO2 measured at outdoor monitoring stations. Various outcomes have been studied in this way including respiratory illness,2-8 lung function,3 5 7 8 and hospital attendances or admissions,9-16 and mortality.17 18 Many investigations,4-7 9-11 14 15 17 18 although not all,2 3 8 12 13 16 have found associations with NO2.
Implicit in the design of such studies is the assumption that variations in the concentration of NO2 in outdoor air are associated with parallel changes in personal exposures to the pollutant. However, because most people spend most of their time indoors, where outdoor concentrations are not the only determinant of NO2 concentrations, the relation may only be weak. As part of a panel study of asthmatic children, we have monitored personal exposures to NO2 on a weekly basis. This provided an opportunity to explore the extent to which variations in personal exposure were influenced by changes in outdoor concentrations.
Method
The study sample comprised 114 asthmatic children (63 boys) aged 7–12 years from households without smokers who were recruited from the asthma registers of general practitioners in the Southampton area. All but two lived within 20 km of the outdoor monitoring station in Southampton, and 50 were resident within the city boundary. Recruitment was carried out during October to December 1994, and initial follow up was until June 1995. Also, 56 of the children agreed to a further period of follow up between September and December 1995.
Personal exposures to NO2 were measured with Palmes passive diffusion tubes fitted with a badge pin so that they could be clipped to the child's outer clothing. Throughout the study, the subjects attended a clinic with a parent or were visited at home every 4 weeks. At each visit, they were provided with a set of four labelled tubes, the first of which was uncapped at the time of issue. Instructions were given orally and in a booklet about how to wear the tubes and how to prevent them from becoming wet or dirty. At night the tube was placed in the child's bedroom. The family were asked to change the tube each week, and to record on a form the times that each tube was uncapped and recapped. Tubes that were not being worn were stored in a plastic packet in the refrigerator at home.
Used tubes were returned at the next clinic visit, and were inspected by the study team for evidence that they had been worn (fading or scratching of the label on the tube and bending of the badge pin from repeated use). Tubes that did not seem to have been worn were discarded at this stage. At the end of data collection but before their NO2 measurements were known, children were classed according to whether or not they seemed to be good compliers. This assessment was based on the evidence that tubes had been worn and on the quality of the written records that they had kept.
The Palmes tubes were supplied and analysed by Greater Manchester Scientific Services, a United Kingdom Accreditation Service (UKAS) accredited laboratory, participating in an ongoing programme of NO2 quality control trials coordinated by AEA Technology, Harwell. Before being issued to children and after their return, the tubes were stored at 4oC. The analysis of NO2was by the Griess-Saltzman colorimetric method,19 and was carried out in batches every 2 months. As well as the exposed tubes, a blank tube was supplied and stored with the exposed tubes, but not uncapped. The NO2 concentration recorded in the blank was subtracted from each sample value in the batch. The mean NO2 exposure during the period when a tube was uncapped was calculated from its NO2 content (corrected for the blank) and the time for which it had been exposed. Above a concentration of 6 μg/m3 the precision of the measurement method was about 25%, but below this concentration the precision was lower.
Data on the concentrations of NO2 in outdoor air were obtained from the AEA enhanced urban monitoring network station located in the centre of Southampton. Measurements were by a chemiluminescence method, and were supplied in the form of daily mean values. The method has an accuracy of ±10%–11% and a precision of ±6.7 μg/m3.1
Statistical analysis was carried out with STATA software.20 We examined the variation in personal exposures within and between children, their seasonal trends, and how they varied over time relative to outdoor concentrations. Analysis of the components of variance of exposures within and between children was conducted with MLn (multi-level modelling) software, and allowed for the variable number of measurements for each child. The personal NO2 measurement periods for individual subjects did not all start and finish on the same days, and therefore when we were exploring seasonality, it was not possible to derive a mean exposure across all children week by week. Instead, we calculated a daily exposure index based on each child's exposure for the week of personal monitoring in which that day fell. (If a day coincided with a change of tubes, it was assigned the value for the tube which covered the larger part of the day.) The index comprised the median and 25th and 75th percentiles of such exposures across all subjects. Serial correlation of the children's and outdoor measurements was examined, and the relation for each child between weekly mean personal exposures and the mean concentrations in outdoor air during the same measurement periods as recorded at the Southampton monitoring station was summarised by a Pearson's correlation coefficient of the logged values.
Results
All of the 114 children who entered the study remained under follow up for at least 16 weeks, and 54 continued through to the end of data collection in December 1995. The mean duration of follow up was 32 weeks. On average, personal exposure measurements were 70% complete for the times that children were under observation, and only four children provided data for less than half the period that they were in the study. As well as the exclusion of Palmes tubes that did not seem to have been worn (0.5% of all tubes), some tubes had been lost or broken while in use. Twenty eight children were classed as good compliers.
Nitrogen dioxide was detectable in all the exposed tubes that were analysed. Measurements of weekly mean personal exposures to NO2 ranged from 0.7 to 496 μg/m3 (median 11 μg/m3, geometric mean 17 μg/m3). Twenty one children returned at least one weekly mean exposure in excess of 100 μg/m3, but values in this range accounted for only 0.8% (n=30) of all measurements. By contrast, 598 measurements (16.7%) were ⩽5 μg/m3.
Figure 1 shows the distribution of weekly mean personal NO2 exposures for each child plotted against the mean exposure for the child over the whole study period. There were few outlying weekly measurements, and most of the low values (⩽5 μg/m3) fell within the main body of data. However, personal exposures varied widely from child to child, and from week to week for each individual child. Analysis of variance (ANOVA) indicated that variation within a child accounted for more of the scatter (74%) than that between children (26%).
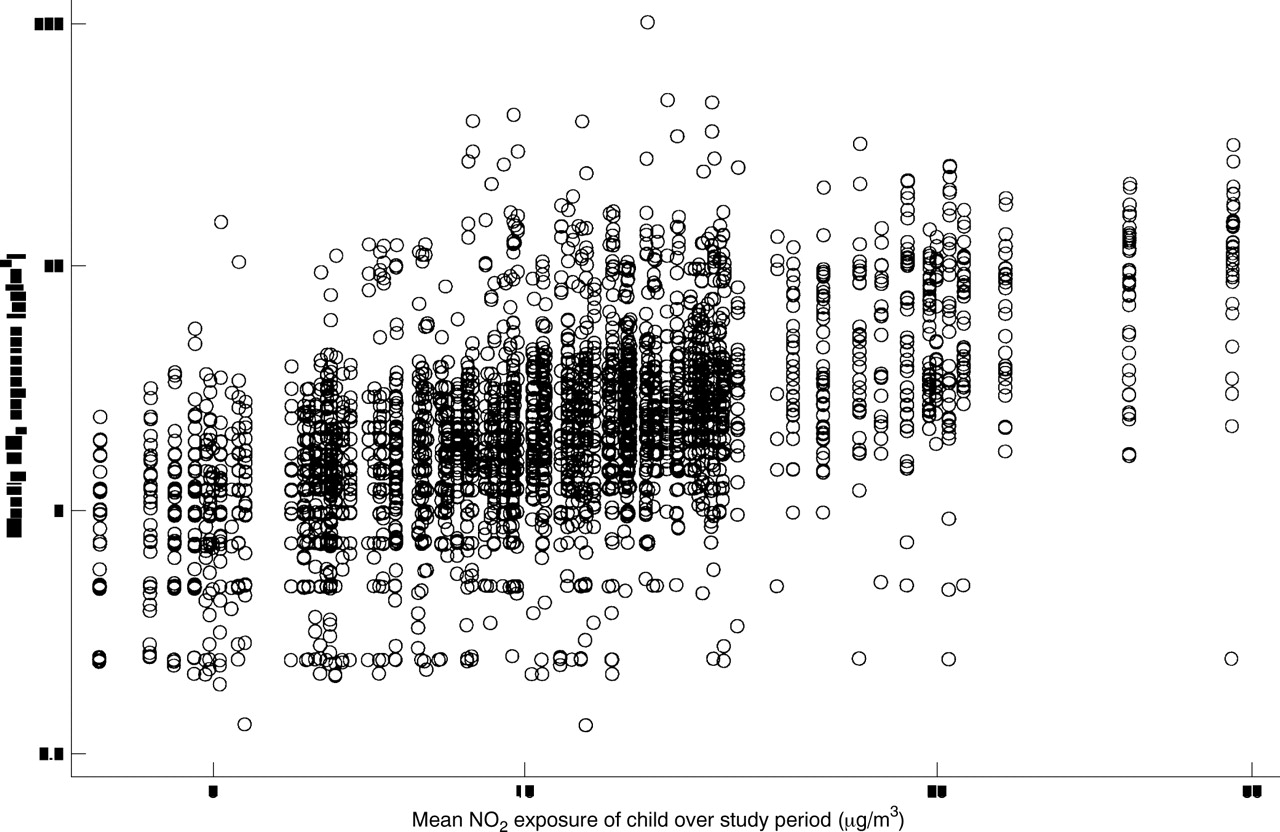
Distribution of weekly mean NO2 personal exposures for each child plotted against the mean exposure for each child throughout the study.
The median NO2 exposures for the study sample on each day varied from 2.4 to 27.7 μg/m3. Values were highest at the beginning of the study, declined over the first 3 months, and thereafter showed no marked long term trend or evidence of seasonality (fig 2). The fall in exposures over the first 3 months was also found when analysis was restricted to the subset of 28 children considered to be most compliant.

Daily personal NO2 exposure over the period of the study (median and 25th and 75th percentile).
Data on outdoor NO2 concentrations were unavailable for 24 May to 18 June 1995 (when new equipment for measuring hydrocarbons was being installed at the monitoring station) and for 6 other days (because of technical faults). Daily mean values over the study period ranged from 4.3 to 29.8 μg/m3 with a median of 12.8 μg/m3 and a geometric mean of 12.3 μg/m3(fig 3). There was no clear seasonal variation; both the maximum and minimum concentrations were recorded during May 1995. There was no evidence of consistently higher concentrations during the first 3 months of the study.

Daily mean concentrations of NO2 in outdoor air over the period of study.
Serial correlation was assessed for each child's weekly NO2 measurements and for the outdoor concentrations. Evidence for such correlation was weak; for many children and for the outdoor concentrations the serial correlation was negative, although far from significant. In the absence of serial correlation, Pearson correlation coefficients were used to examine the relation between each subject's weekly mean personal exposures to NO2 and the mean outdoor concentrations during the corresponding periods. The coefficients by child ranged from –0.77 to 0.68 with a median of –0.02 (fig 4). Moreover, a similar pattern was found when the first 3 months of monitoring were ignored (range –0.8 to 0.96, median –0.05) and when analysis was restricted to the 50 children living within Southampton city (range –0.77 to 0.25, median –0.02). Correlation coefficients were also similarly distributed when analyses were confined to those children living in households that did not use gas for cooking.

Correlation between personal exposures to NO2 and outdoor concentrations. For each child, weekly average personal exposures to NO2 were related to the mean outdoor NO2 concentration in the corresponding 7 day periods, and a correlation coefficient was calculated. The graphs show the distribution of correlation coefficients across participants: (A) using all available data, (B) ignoring the first 3 months of personal monitoring, and (C) including the first 3 months of personal monitoring but restricted to the 50 children who lived within the city of Southampton.
Discussion
In this study we found major variation from week to week in children's personal exposures to NO2, but it seemed that little, if any, of this variation was determined by fluctuations in the concentration of NO2 in outdoor air. The children whom we studied were selected on the basis of their history of asthma and their willingness to participate in a longitudinal investigation that was demanding of their time and that of their parents. However, it is unlikely that their patterns of exposure to NO2 would differ importantly from those of other children living in the same locality.
All but two participants lived within 20 km of the outdoor monitoring site in Southampton, but only 50 were resident within the city boundary. The remainder all came from adjacent towns. Even when analysis was restricted to residents of the city, no important correlation between personal and outdoor NO2 concentrations was apparent. This was also the case for children from homes without a major indoor NO2 source, such as a gas cooker.
One advantage of focusing on a motivated group of patients was better compliance with the monitoring regime. Nevertheless, it did seem that a few Palmes tubes were not worn as instructed, and these were discarded before any analysis was carried out. Although we cannot be sure that all remaining tubes were exposed as intended, it was our impression that children and parents were conscientious in trying to follow the requirements of the study design.
Because participants attended clinics and started their NO2sampling on different days of the week, it was not possible to calculate a simple weekly mean exposure across the study sample. When exploring seasonal trends, therefore, we derived a daily exposure index based on each child's exposure over the week of monitoring in which that day fell. This is something akin to a daily running average, and does not reflect exposures on any single day. It does, however, provide an indication of longer term variations in exposure for the study sample as a group.
One remarkable feature of our findings was the decline in personal exposure measurements over the first 3 months of follow up. No corresponding trend was seen in outdoor concentrations. Nor was a similar pattern apparent in the same season 12 months later. The higher values at the beginning of the study did not seem to result from a problem with the preparation or analysis of tubes, as the measurements made on blank tubes during the same period were not increased. There was a possibility that subjects complied more enthusiastically early in follow up, and to test this we looked at the pattern of results in a subset of children who seemed to be the best motivated and organised throughout the study. The trend in these children was similar. Nevertheless, the suspicion remains that it may have resulted from an unrecognised artefact. Therefore, when examining the relation of personal exposures to outdoor concentrations, we repeated the analysis excluding the first 3 months of data. This made little difference to the correlations.
Few other studies have examined the correlation over time between personal exposures to NO2 and measurements at outdoor monitoring stations. In Sweden, Berglund et al found a weak relation (R=0.45) in a sample of urban children,21 and in a study of 246 Finnish children, the correlation was also poor.22
The averaging period that we used when looking at the relation between personal exposures and outdoor concentrations (1 week) was longer than that used in most studies of acute health effects (1 day). However, there were wide variations in personal exposure from week to week, and if daily fluctuation in outdoor concentrations had an important influence on personal exposure, we would have expected to find correlations in analyses based on a 1 week averaging period.
It is possible that our failure to show a relation between personal exposures to NO2 and outdoor concentrations reflected in part the relatively low outdoor concentrations over the period of study. The highest daily mean concentration recorded at the monitoring station was <30 μg/m3. It is likely that when outdoor concentrations are higher, and particularly during pollution episodes, they have a bigger influence on personal exposures. Our findings suggest, however, that at low outdoor concentrations, changes in NO2 in outdoor air as measured at a central monitoring station contribute little to variations in personal exposure to the pollutant. As a consequence, any effects of NO2 at these concentrations would tend to be underestimated in studies relating temporal variations in health outcomes to measurements at central monitoring stations.
Acknowledgments
We are grateful to the children and parents who participated in the study, and also to the general practitioners and reception staff for their willing cooperation throughout the project. We thank Sandy Smith and Jackie Schreiber for their assistance with data collection.Greater Manchester Scientific Services performed the laboratory analyses of the diffusion tubes and Mr G Broughton at AEA Technology provided the data on outdoor air quality. Sue McIntosh prepared the manuscript. CHL held a Department of Health (UK) studentship and AJC held an MRC clinical training fellowship and was supported by Children Nationwide.
References
Supplementary materials
- CORRECTION
Personal exposures of children to nitrogen dioxide relative to concentrations in outdoor air. C H LINAKER, A J CHAUHAN, H M INSKIP, S T HOLGATE, D COGGON. 2000;57:472-6
Unfortunately an authors' error occurred in this paper in the conversion of concentrations of outdoor nitrogen dioxide (NO2) from ppb to µg/m3. As a consequence, all of the NO2 measurements that were reported in outdoor air should be multiplied by a factor of 3.53. The correlations with personal NO2 measurements are unchanged, as is the interpretation of our findings. Although higher than originally indicated, the outdoor NO2 concentrations were nevertheless relatively low.
Linked Articles
- Correction