Article Text

Abstract
Aim: To investigate the acute health effects of winter outdoor air pollution (nitrogen dioxide (NO2), ozone (O3), sulphur dioxide (SO2), sulphate (SO42−) ,and particles (PM10)) on schoolchildren in an area of southern England where levels of SO2 had been reported to be high.
Methods: A total of 179 children, aged 7–13, from three schools (two urban and one rural location), were included. Peak expiratory flow rate (PEFR) and presence or absence of upper respiratory infections were recorded on 63 school days from 1 November 1996 to 14 February 1997. Air pollution and meteorological data were taken from monitors at each school site. The analysis regressed daily PEFR on pollutant level adjusting for confounders and serial correlation and calculated a weighted pooled estimate of effect overall for each pollutant. In addition, large decrements in PEFR were analysed as a binary outcome. Same day, lag 1, lag 2, and a five day average of pollutant levels were used.
Results: There were no clear effects of any pollutant on mean PEFR. In addition, we analysed large PEFR decrements (a binary outcome), observing consistent negative associations with NO2, SO42−, and PM10, although few lag/pollutant combinations were significant: odds ratios (95% CI) for five day average effect: NO2 24 h average 1.043 (1.000 to 1.089), SO42− 1.090 (0.898 to 1.322), PM10 1.037 (0.992 to 1.084). The observed effects of PM10 (only) were stronger in wheezy children (1.114 (1.057 to 1.174)). There were no consistent negative associations between large decrements and ozone or SO2 .
Conclusions: There is no strong evidence for acute effects of winter outdoor air pollution on mean PEFR overall in this area, but there is evidence for negative effects on large PEFR decrements.
- air pollution
- children
- panel study
- peak expiratory flow
- PM10
- FEV, forced expiratory volume
- FVC, forced vital capacity
- PEFR, peak expiratory flow rate
- PM, particulate matter
- TEOM, tapered element oscillating microbalance
Statistics from Altmetric.com
- FEV, forced expiratory volume
- FVC, forced vital capacity
- PEFR, peak expiratory flow rate
- PM, particulate matter
- TEOM, tapered element oscillating microbalance
Many panel studies have now been conducted to investigate the relation between outdoor air pollution and respiratory function in children. While the earliest of these reports originated in the USA,1,2 more recent reports have described European studies.3–5 These studies have generally reported negative correlations between peak flow rate and both summer6,7 and winter air pollution.2,5 However, a multicentre study involving 14 European research centres8 found little evidence for any adverse effects in winter. To date only one study involving British children has been published.6 This study reported very small but statistically significant negative effects of summer PM10 on FEV0.75 and FVC. No adverse effects were detected for ozone or NO2.6
In 1995, The City of Rochester upon Medway (now Medway) Council, Kent commissioned air quality monitoring at three schools within its borough. In a collaborative study between St George’s Hospital Medical School, the University of Greenwich, and Medway Council, daily lung function was recorded on 179 children attending these schools between 1 November 1996 and 14 February 1997. This paper describes an analysis of the relation between winter air pollution and lung function in these children.
METHODS
Study location
The Medway Council District is situated in northern Kent on the estuary of the river Medway with the (larger) Thames estuary just to the north. Two major power stations are in the vicinity. The topography of the area is varied with the two estuaries providing “corridors” which potentially channel air flows into and away from the Medway district. Existing pollution and wind direction data have suggested that local pollution originates from local traffic (NO2), continental Europe and London (PM10), and local power stations and London (SO2).9 The Stoke School monitoring station is situated eight miles northeast of the city and is officially classified as a rural site. This station is part of the UK National Air Quality Monitoring Network. Luton Road School monitoring station is in nearby Chatham and is an urban background site, while the monitoring station at Chatham Girls’ Grammar School is classified as a kerbside site. The two Chatham schools are situated within half a mile of each other.
Subjects
The rural village primary school was very small and it was practicable to monitor all of the children for the duration of the study. The urban primary school was much larger (about 500 children) and it was not feasible to collect daily data for the whole school. Therefore in discussion with the staff, it was decided to restrict the study to the oldest school year. Chatham Girls’ Grammar School, a secondary school, asked to join the study and offered to allow one class plus all asthmatics in one school year to participate. The numbers and ages of children studied from each school were as follows:
Stoke County Primary School: all children in years 3–6, aged 7–11 (n = 48)
Luton Road Primary School: all children in year 6, aged 10–11 (n = 96)
Chatham Girls’ Grammar School: all girls in one class in year 8, aged 12–13 (n = 25) plus girls using medication for asthma in the same school year (n = 10).
In this paper the schools will be referred to as “rural”, “urban1”, and “urban2” respectively.
Local interest and the schools’ enthusiasm meant that no parent withheld permission for their child’s participation in the study. At the beginning of the survey, parents were asked to fill out a short questionnaire asking about respiratory symptoms, based on a standard asthma questionnaire.10 This asked about current and past wheezing, asthma ever, and whether the child took regular medication for asthma. From these responses, children were categorised as either current wheezers or non-wheezers.
Peak expiratory flow rate (PEFR) was measured once daily in school term time using standard range mini-Wright peak flow meters. Each child was given their own machine for the duration of the study. The children took three measures of their PEFR on each occasion from a standing position and wrote down all three on a dated diary sheet. The readings were taken at approximately the same time each morning. Prior to the start of the study, one of the investigators (JLP) trained the children in each school, by class, to use the peak flow meters, including how to read the scale and how to record the data on the diary sheet. The class teacher was present at these training sessions and subsequently supervised the daily blowing. In addition to recording PEFR, the children noted the presence or absence of either a cough or a cold on the diary form.
Air pollution measurements
These were undertaken by a commercial company (Ashdown Environmental) on behalf of the Council. Permanent monitoring stations were sited at each school. The following pollutants were measured at the rural and urban1 sites:
NOx by chemiluminescence
SO2 by ultraviolet fluorescence
O3 by ultraviolet absorption
PM10 by TEOM (tapered element oscillating microbalance).
Only NOx and PM10 were measured at the urban2 site, but because of the close proximity of the two urban sites, we considered it reasonable to use the urban1 site measurements for SO2 and ozone. Readings were made continuously and stored as 15 minute averages. The rural site included a high specification weather station. For this paper, we have used NO2 (24 hour average and 1 hour maximum), SO2 (24 hour average), ozone (8 hour maximum moving average (mma) and 1 hour maximum), and PM10 (24 hour average). In addition we estimated exposure to SO42− by averaging the 24 hour average from the two nearest monitoring sites, one 80 miles north (Stoke Ferry) and the other 40 miles south (Barncombe Mills) of the three schools, since SO42− was not measured locally.
We obtained the pollution data for the three sites as 15 minute averages. These data had been validated by the monitoring company. In addition we obtained the pollution data for the rural site, directly from the National Air Quality Network (AEA) internet website.11 We compared the two sources of data and observed only small differences in magnitude, but found that PM10 data was missing for 50 days between November and December 1996 in the AEA data set. Further investigation indicated that the AEA data had been validated separately by the National Physical Laboratory. We therefore used both sources of data in the analyses to allow comparison between the two. We will refer to the two sources of pollution data as “locally validated” and “nationally validated” from here on.
Sample size
Our previous study6 included 154 children measured daily for six weeks and was powerful enough to detect very small changes in lung function (1% reduction in FEV0.75 across the range of pollutants measured). The present study included 179 children measured for over double the time period (13 full weeks). Hence even allowing for the poorer repeatability of PEFR compared with FEV0.75 and FVC measured in our previous study, we judged that this study would be sufficiently powerful to show reductions in PEFR of a similar magnitude, should they exist.
Statistical methods
To compare the same pollution data validated in different ways we used plots of the difference in measurement against the mean. This method shows the spread of the differences, and indicates any systematic difference between methods and any tendency for the difference to change with the mean. We used the same approach for showing the differences between pollutant levels at the urban and rural sites.
Stage 1 of the analysis followed the general approach that we have used before,6 as follows. The relation between PEFR and air pollution was modelled separately for each child using multiple regression, which allowed for first order autocorrelation12 and gave a regression coefficient for each child. The heterogeneity between regression coefficients was investigated using a standard test.13 Where heterogeneity was detected, a pooled estimate of regression coefficients was calculated using a weighting method based on a robust estimate of variance and allowing for both the within and between child variability.14
The outcome variable in the individual regressions was PEFR, using the maximum of the three blows recorded on each day. This was analysed as the daily deviation from the individual child’s mean value, thus allowing for differences in mean PEFR between children. Predictor variables were day of the week (first day back at school after weekend or holiday yes/no), 24 hour mean outside temperature, and pollutant. Pollutants were analysed separately with lags 0, 1, 2 days, plus a five day moving average including the current day. We allowed for lung growth by adding a linear term for date. The analyses were performed with and without self reported cough (yes/no/not known) and cold (yes/no/not known) as predictor variables since the presence of upper respiratory symptoms might be a mediator of any effect of pollution on PEFR.
Stage 2 of the analysis followed the approach described by Hoek and others,15 which investigated associations between air pollution and large peak flow decrements. The rationale for this approach is the suggestion that a small change in mean PEFR results in a disproportionate effect at the extremes of the peak flow distribution. In other words, a relatively small decrease in mean PEFR may be associated with a substantial increase in the proportion of individuals in the lower tail of the distribution. This is potentially important since it is these individuals at the extreme end of the distribution who have a higher risk of an adverse response. To investigate associations with large reductions in lung function, we calculated the percentage decrement from each child’s median PEFR for each day. We followed Hoek’s approach using two binary dependent variables to denote decrements greater than 10% and greater than 20%. Generalised estimating equations with a first order autoregressive correlation structure were fitted to these data for each pollutant/lag combination, with all children analysed together. These gave estimates of variance which were robust to misspecification of the correlation matrix. The predictors in these models were day of the week (first day back at school, yes/no), time trend, temperature, and pollutant. These models allowed the variations between children to be incorporated into the model and resulted in an overall estimate of effect for each pollutant/lag combination, in the form of odds ratios.
In addition, all analyses were performed using (1) the AEA site data for each child and (2) the pollution data from the appropriate local school site. This allowed comparison to be made between effect estimates when exposure was measured at an individual’s school site with effect estimates derived from exposure measurement at a single community monitor. Further, using the two sources of exposure measurements for the rural children allowed a comparison of the effects of using exposure data validated in two different ways.
The following steps were taken to maintain the quality of the outcome and exposure data. For the temperature and pollution data, we only calculated a summary of that day’s value if at least 75% of data were available. For the PEFR data, we omitted a day’s reading if the child had recorded less than three PEFR measurements (60/9516 = 0.6%). In addition, we excluded the PEFR readings for any child/day combination if the range of the three measurements was greater than 100 l/min since we judged that a wide range was an indicator of incorrect technique or recording error (509/9456 days = 5.4%). Further, we excluded one child with less than 10 readings overall. One child with 10 readings was subsequently omitted because the standard error of the regression coefficient was very small, leading to a disproportionately large weight and therefore giving that child’s results excessive influence on the overall weighted average. A further child was excluded from the PM10 analyses where both the regression coefficient and standard error were almost zero and so influenced the summary estimate greatly. All analyses were performed using Stata.16
RESULTS
Summary statistics
Table 1 shows the summary statistics by school and overall. The proportion of currently wheezy children varied by school as a result of the design. About one fifth of children in the rural and urban1 schools from which the samples were cross sectional, were current wheezers. Symptomatic children were over sampled in the urban2 school, thus increasing the overall proportion of wheezers to about one quarter. The variation in the mean and standard deviation of PEFR between the schools reflects their different age compositions. The children recorded PEFR for a mean of 50 days. The reporting of symptoms shows some variation between schools, with children at the urban2 school recording the greatest proportion of colds and coughs and those at the urban1 school recording the least. Colds were more commonly reported than coughs in all schools. The distribution of percentage of days with large peak flow decrements was positively skewed: some children had no large decreases but a few had many (table 1).
Summary statistics for respiratory data overall and by school
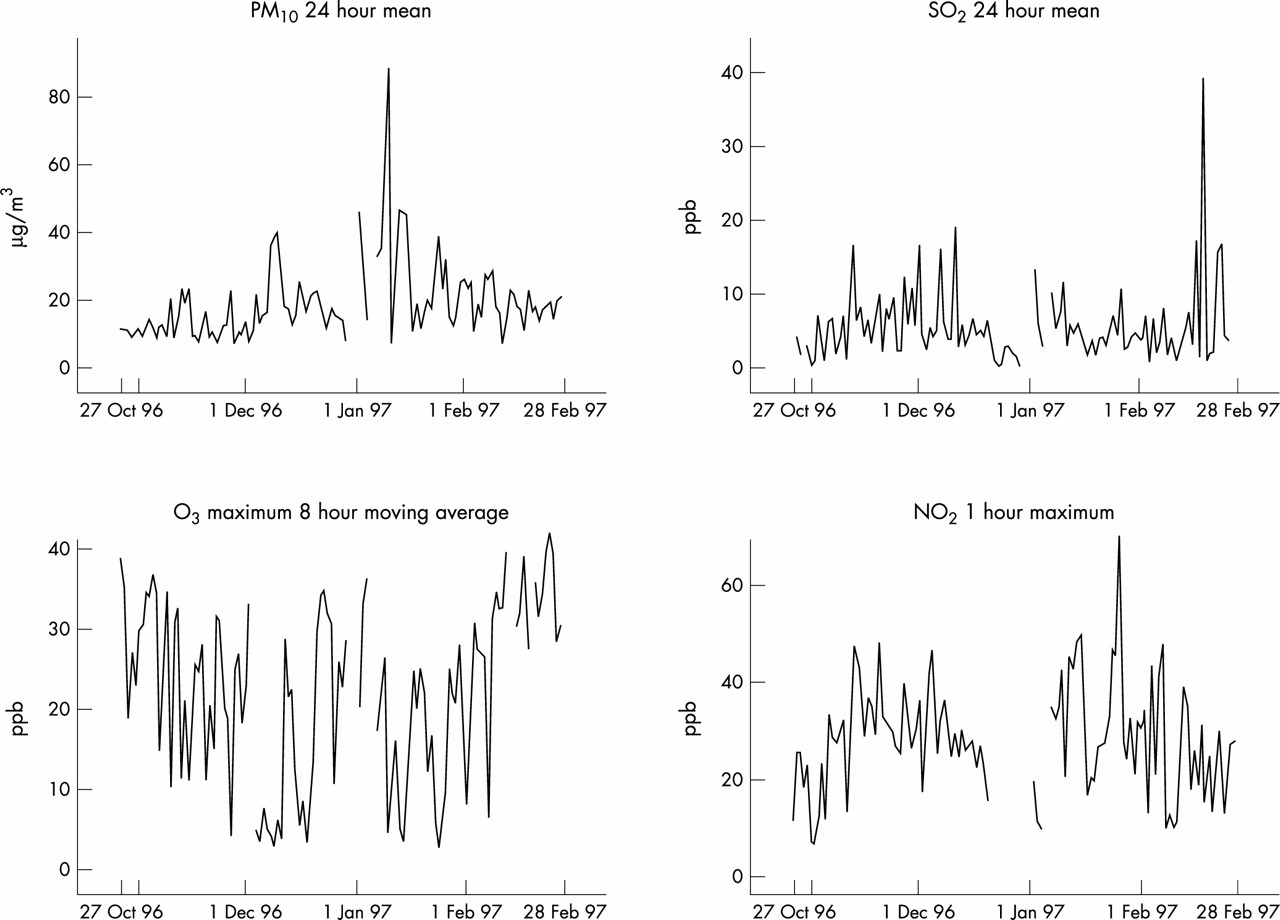
Pollutant levels were generally below UK guidelines during the study period (table 2, fig 1). There were only two exceedances for PM10: on 11 January 1997 at the rural site (88 μg/m3) and on 12 January 1997 at the urban sites (63 μg/m3). Figure 2 plots the difference against the mean, both for the two methods of data validation and for urban and rural pollutant levels. The agreement between the two methods of validation was close. For NO2, the two methods gave values within 4 ppb of each other with no tendency for the difference to increase with the mean. The ozone values tended to be higher for the local validation than the national validation, but the differences were mostly less than 1 ppb. The SO2 values agreed within ±1.5 ppb and PM10 mostly within ±2 μg/m3, although this difference tended to increase with the mean. Comparing urban with rural values showed expected differences. NO2 levels were higher at the urban site and ozone was lower. SO2 levels were very similar at both sites when levels were low, but differences were apparent on days with higher baseline levels. Similarly for PM10, urban and rural levels were close at the lower end but a few larger differences were apparent at the upper end.
Summary statistics for pollutants and meteorological data overall and by school for 28 October 1996 to 28 February 1997

Plots of locally validated pollutant time series from the rural site.

Pollution data for: nationally and locally validated data; and for rural and urban data for NO2, ozone, SO2, and PM10.
Relation between air pollution and daily changes in PEFR
There were no clear effects of any pollutant on PEFR when the results for all schools were combined (table 3). For the two measures of NO2 and the two measures of ozone, most regression coefficients indicated a very small beneficial effect rather than an adverse one, but these were mostly non-significant. The regression coefficients for SO2 were negative for lag 2 days and SO42− showed negative effects for same day and previous day levels. These regression coefficients were consistent with a 0.5% decrease in PEFR over the whole range of pollutant values, but the 95% confidence intervals were wide and included zero. Same day PM10 was associated with a similar decrease in PEFR, but again the effect was not significant.
Estimated change in PEFR by lag: all schools together, according to site of air pollution monitor (community or local)
There was no suggestion of any consistent pattern in effect sizes for the different lags used. Effect sizes were sometimes, but not always, bigger for the five day average; confidence intervals tended to be wider. We compared the standard errors for the regression coefficients corresponding to the two sources of exposure data, local and community monitors. This showed that the standard errors of the combined regression coefficients were not consistently smaller when the exposure was measured at the actual school site rather than at a community monitor (table 3). The analyses were repeated with control for symptoms, but we found very little difference in the estimates (data not presented).
When the schools were analysed separately, there was a slight suggestion of a bigger effect at the rural site than at the urban sites for NO2, SO2, SO42−, and PM10 at most lags. However, the rural site effects were mostly non-significant over all the pollutant/lag combinations (data not presented). These results were essentially unchanged when control was made for symptoms (data not presented). In addition, we compared regression estimates for the rural school using pollution data validated in the two different ways (data not presented). This showed that there were hardly any differences in either the estimates or the confidence intervals. These analyses were repeated with control for symptoms and gave very similar results.
Relation between air pollution and large peak flow decrements
When PEFR was analysed as a dichotomous variable (decrements more than 20% below the median), more consistency was observed than for PEFR as a continuous variable (table 4). For NO2, all odds ratios in all children combined were over 1.0 with lag 2 days and the five day average showing the strongest and most significant effects. For NO2 24 hour average, the odds ratios ranged from 1.01 to 1.04 among all children. This range of odds ratios corresponds to a range of 10–48% increase in odds of a large PEFR decrement for a 10 ppb increase in pollutant. All odds ratios for PM10 were also over 1.0 and ranged between 1.012 and 1.037 for all children combined. For SO42− all odds ratios were over 1.0, although none were significant. Associations with ozone in all children were all positive and non-significant.
Odds of a 20% decrement in PEFR below the median by lag in all schools combined for all children and for wheezy children only
These analyses were repeated for the rural school using locally validated and nationally validated pollution values (data not presented). Only very small differences were observed between the pairs of estimates and their confidence intervals. Analyses were also performed on 10% decrements and these showed similar but less significant results (data not presented).
Effect modification by wheezing status
The positive effects observed for NO2 and PM10 on large decrements suggested that there might be a subgroup of children who were more susceptible than the rest. We investigated this by looking at current wheeze. For the analyses of mean PEFR, there was no evidence of any effect modification by wheezy status; regressions of the PEFR slopes for the various pollutants, found that wheezy children had a significantly steeper negative mean slope than non-wheezy children for only one of 28 pollutant/lag combinations tested. When we analysed the 20% decrements, we only observed stronger effects in wheezy children for PM10, and found little difference by wheezing status for the other pollutants measured.
DISCUSSION
This study found no clear associations between winter NO2, ozone, SO2, SO42−, or PM10 and PEFR in primary school children. The most consistent estimates were SO2, SO42−, and PM10. The estimates using five day mean pollutant levels were equivalent to declines in PEFR of 0.70% and 0.30% for a 10 unit increase in SO2 (ppb) and PM10 (μg/m3) respectively. The effects for PM10 are similar in size to those reported in other studies.2,4,17,18 The effect for SO42− was weaker: 0.07% for a unit increase in SO42− (lag 2 days).
This study showed consistent negative associations between large peak flow decrements and both NO2 , SO42−, and PM10. Our findings were of greater magnitude than those observed by Hoek and colleagues,15 who only analysed PM10, and reported a 3% increase in large decrements for a 10 μg/m3 increase in same day pollutant pooled across five studies. Our same day estimate was equivalent to a 13% increase in risk for the same rise in PM10, but the 95% confidence interval was wide: −8% to +36%. Our findings of strong negative associations with NO2 and PM10 but weaker associations with SO2 and SO42− are consistent with the adverse effects being a result of vehicle emissions since the SO2 in this area comes mainly from local power stations. The finding of weaker associations with 10% decrements is consistent with the natural variability in our data—the overall coefficient of variation was 16% and so a 10% decrement would seem to be within the normal peak flow range for these children. The observed protective effect of ozone on PEFR decrements was surprising, but similar results have been reported in other studies where negative associations were reported between ozone and all cause mortality19 and hospital admissions.20 One explanation for the negative associations is that ozone is highly negatively correlated with most other pollutants in the cool months, and so days when ozone levels are relatively high could simply be an indicator of low levels of other pollutants. We tested this by fitting two-pollutant models with ozone and each of PM10 and NO2. This showed that the apparently beneficial effects of ozone were not explained by either NO2 or PM10 and the effect estimates were largely unchanged after adjustment.
With regard to cumulative pollutant lags, we found some evidence for the stronger effects reported by other authors21,22 when we analysed PEFR (continuous variable). However, these effects were no more precise than those for single lags. We also observed stronger associations between PEFR decrements (binary variable) and five day average pollutant measures. This is consistent with there being a stronger association between air pollution and large decreases in PEFR compared to the association with mean PEFR, and suggests that some children are more sensitive but that overall effects in the continuous variable analyses are diluted by the majority who are not affected. This argument is reinforced by the finding of stronger effects of PM10 among wheezy children.
This study investigated differences in results for air pollution data validated separately by different organisations—the National Physical Laboratory and a local commercial company. The actual values from the two validations mostly agreed very closely, with substantial divergence on only a few high pollutant level days. Results of analyses using the two sets of data gave very similar results and showed no consistent differences in magnitude or precision of the final regression estimates. This was reassuring and suggested that either source of exposure could be used with confidence. Further, analyses using the nearest monitor compared with analyses using the single community monitor to estimate pollution exposure, showed no consistent differences. This is difficult to interpret given our mainly non-significant results, but certainly provides no evidence that using one central monitor (as most studies do) rather than several local monitors reduces power in analyses.
There are several possible reasons for the lack of associations between outdoor air pollution and mean lung function observed in this study. Firstly, the study was conducted in winter when children spend relatively little time outdoors and so their exposure to outdoor pollution would have been limited. Secondly, exposure levels themselves were fairly low with few exceedances observed. Eight hour average ozone was well below the national banding level of 50 ppb for “moderate” air pollution; similarly, the one hour maximum NO2 levels observed during the study were below the 150 ppb banding for “low” air pollution.23 PM10 levels were mostly below 50 μg/m3 with exceedances on only two days.
Thirdly, in winter, respiratory infections are common and may confound or mediate an association with air pollution or add “noise”, making effects harder to detect. We attempted to control for upper respiratory infection and compared analyses with and without such control, finding that this made little detectable difference. A fourth possible reason is the imprecision of our outcome measure, peak expiratory flow rate. It is well known that PEFR measured using a mini-Wright meter is less precise than timed forced expiratory volume measured by spirometry. However, mini-Wright meters are used because they are cheap, simple for children to use, and are portable compared with many spirometers. In addition they require a lower level of supervision compared with spirometers. We did take great care to teach correct blowing and recording technique and we excluded suspect readings. Our overall coefficient of variation,16%, compared favourably with 21% in our summer study when we measured FEV0.75 and FVC by supervised spirometry in children aged 7–11.6
Finally, the lack of significant associations for mean PEFR could be caused by low power. However, one would expect power to be greater when analysing PEFR as a continuous rather than as a binary variable, whereas this was not the case here. We found more significant results from our analyses on the binary variable than for the continuous one. Low power might explain why our analyses of large decrements gave fewer significant results than those of Hoek and colleagues,15 who pooled data from five previous studies. We do not believe that the analysis of PEFR itself as a continuous variable was under powered, since this study contained more subjects than our previous study and it ran for a longer time period. The narrowness of the confidence intervals does not suggest that low power was an issue here.
The results of the present study show some coherence with ecological studies of general practitioner consultations,24 hospital accident and emergency (A&E) department visits,25 and hospital admissions for respiratory conditions in London.26 These studies, like ours, reported associations in children with NO226 and PM10.25 However, unlike us, they found associations with SO224–26 and ozone.24 The children in our study were predominantly healthy compared with those in the ecological studies who sought medical help. Our observed associations with large peak flow decrements are consistent with effects in sensitive subgroups.
Medway district is a semirural area where levels of air pollution, particularly SO2 from local power stations, are of concern. This study showed stronger negative associations with NO2 and PM10 than for SO2, suggesting that vehicle rather than power station emissions are responsible for the observed effects.
Main messages
-
There is no strong evidence for acute effects of winter NO2, O3, SO2, SO42−, or PM10 on mean PEFR in children in England.
-
However, increases in NO2 and PM10 are associated with a higher risk of large PEFR decrements.
-
Associations were stronger for NO2 and PM10 than SO2, suggesting that vehicle rather than power station emissions are responsible for observed effects.
Policy implications
-
Efforts should continue to be made to reduce outdoor air pollution levels caused by road traffic vehicle emissions.
Acknowledgments
We are grateful to the staff and pupils of Stoke County Primary School, Luton Road Primary School, and Chatham Girls’ Grammar School in Kent, UK who took part in this study. We thank Philip Peacock for doing the data entry. The UK Department of Health funded the statistical analysis for this study.