Article Text

Abstract
Background Retirement is a major life transition which may influence health behaviours and time use. Little is known about how sedentary behaviour changes as a result of increased time availability after retirement. The aim of this study was to examine changes in non-occupational sedentary behaviours across the retirement transition. In addition, we examined which preretirement characteristics were associated with these changes.
Methods The study population consisted of 2011 participants from the Finnish Retirement and Aging Study. Repeated postal survey including questions on sedentary behaviour domains (television viewing, computer use at home, sitting in a vehicle and other sitting) were conducted once a year across the retirement transition, covering on average 3.4 study waves. Linear regression with generalised estimating equations was used for the analyses.
Results Total sedentary time increased by 73 (95% CI 66 to 80) min/day during the retirement transition. Of the domain-specific sedentary behaviours, television viewing time increased by 28 (95% CI 25 to 32) min/day, computer use at home by 19 (95% CI 17 to 22) min/day and other sitting time by 37 (95% CI 33 to 41) min/day, while time sitting in a vehicle decreased by 6 (95% CI 4 to 9) min/day. Highest increase in total sedentary time was among women and persons who had high occupational sitting time, low physical activity level, sleep difficulties, mental disorders or poor health before retirement (all p values for interaction <0.03).
Conclusion Total and domain-specific sedentary time, except sitting in a vehicle, increased during the retirement transition.
- cohort studies
- health behaviour
- lifestyle
- longitudinal studies
- public health
Statistics from Altmetric.com
Background
Sedentary behaviour, defined as any waking behaviour characterised by an energy expenditure ≤1.5 metabolic equivalents (METs) while in a sitting or reclining posture,1 is highly prevalent among adult population.2 Older adults are the most sedentary age group spending 65%–80% of their wake time on sedentary behaviours.3 This is potentially a public health concern as sedentary behaviour is associated with poor health4 5 and mortality.6 7
Retirement is a major life transition in late mid-life which can cause changes in lifestyle.8 Indeed, previous research has shown that retirement is associated with increased leisure physical activity9 and sleep duration10 most likely due to increased time availability, restructure of leisure activities and awareness of one’s own health and well-being.11 12 However, retirement has also been listed as a strong determinant for engaging sedentary behaviour.13 To date, only a small number of studies have examined how sedentary behaviour changes during the retirement transition.14
Prior longitudinal studies have shown that retirement is associated with increased time spent on television viewing and computer use, and with decreased passive transportation time.8 14–17 However, previous studies have not been able to follow people with repeat measurements across the retirement transition nor to assess short-term and long-term changes in both total and domain-specific sedentary behaviours.8 15–17 Furthermore, prior research has examined changes in sedentary behaviour only by education and work-related factors.14 Yet, multiple other factors, such as lifestyle and health factors, are shown to be associated with sedentary behaviour18 and therefore could potentially affect the changes in sedentary behaviour during the retirement transition.
To address some of these limitations, this longitudinal study examined how non-occupational sedentary behaviours, such as television viewing, computer use at home, sitting in a vehicle and other sitting, changed across the retirement transition using repeated annual measurements. We also investigated which preretirement characteristics were associated with changes in total and domain-specific sedentary time during the retirement transition.
Methods
Study population
Finnish Retirement and Aging (FIREA) study is an ongoing longitudinal cohort study of older adults in Finland established in 2013. The aim of the FIREA study is to follow ageing workers from work to full-time retirement and to determine how health behaviours and clinical risk factors change during transition to statutory retirement. The eligible population for the FIREA study cohort included all public sector employees whose individual retirement date was between 2014 and 2019 and who were working in the year 2012 in one of the 27 municipalities in southwest Finland or in the 9 selected cities or 5 hospital districts around Finland. Information on the estimated individual retirement date was obtained from the pension insurance institute for the municipal sector in Finland (Keva). Participants were first contacted 18 months prior to their estimated retirement date by sending a questionnaire, which was thereafter sent annually, four times in total. The actual date of retirement was reported by the participants. Due to the eligibility criteria, large majority of the FIREA participants retired based on their age, and not due to disease.
By the end of 2017, 6673 (63% of the eligible sample, n=10 629) of the FIREA cohort members had responded to at least one questionnaire and of them 4311 had responded at least twice to questionnaires, 2082 both prior and after the actual retirement date reported. The final analytical sample did not differ from the eligible sample (83 vs 80% of women, 33 vs 29% of upper-grade non-manual, 37 vs 42% of manual workers, respectively).
There were two possible study waves before retirement (wave −2, wave −1) and three possible waves after retirement (wave +1, wave +2, wave +3) (table 1). Each successive wave was 1 year apart from each other. To be included in this study, the participants had to have information on total non-occupational sedentary time immediately before and after transition to statutory retirement (ie, at wave −1 and at wave +1) (n=2058). We excluded those with missing information on socioeconomic status (n=24) and those who were not working full-time or part-time at wave −1 (n=23), resulting in an analytic sample of 2011 persons. Thus, depending on the retirement date, participants’ observations came from one of the following alternative set of waves: (1) wave −2, wave −1, wave +1, wave +2, or (2) wave −1, wave +1, wave +2 and wave +3. On average, these participants provided information on total non-occupational sedentary time at 3.4 (range 2–4) of the possible four study waves.
Study design
Assessment of sedentary behaviour
Sedentary behaviour was inquired at each study wave with a question: ‘On average, how many hours on a non-weekend days you spend on sitting: (1) at the office, (2) watching television or videos at home, (3) using computer at home, (4) in a vehicle (car, train, airplane) and (5) other sitting?’ Response alternatives for each domain were 0 (sitting less than an hour or not at all), 1, 2, …, 9, ≥10 hours per day, coded as 0–10 hours, respectively. We calculated a total non-occupational sedentary time by summing up sitting time for television viewing, computer use, vehicle and other together.
Assessment of covariates
Sex, date of birth and occupational status were obtained from the pension insurance institute for the municipal sector in Finland (Keva). Occupational status was categorised into three groups according to the occupational titles by the last known occupation preceding retirement: upper-grade non-manual workers (eg, teachers, physicians), lower-grade non-manual workers (eg, registered nurses, technicians) and manual workers (eg, cleaners, maintenance workers). All other covariates were based on the responses in the last questionnaire prior to retirement (wave −1). These covariates were selected because they have been shown to be associated with sedentary behaviour18 and might influence the decision to retire.19 Work status was divided into full-time or part-time workers and marital status into married/cohabiting or not married/other. Heavy physical work (no vs yes) was assessed by using validated gender-specific job exposure matrix for physical exposures.20 21 Occupational sedentary time before the retirement transition was categorised as <4 hours, 4 to <6 hours, 6 to <8 hours and ≥8 hours daily.
Physical activity was assessed with a question on average weekly duration and intensity of leisure and commuting physical activity during the past year. Weekly physical activity was expressed as MET hours and categorised as low (<14 MET hours/week), moderate (14 to <30 MET hours/week) and high (≥30 MET hours/week) activity levels.22 Body mass index (BMI) was calculated from self-reported weight and height and categorised into underweight (<18.5 kg/m2), normal weight (18.5 to <25.0 kg/m2), overweight (25 to <30 kg/m2) and obese (≥30 kg/m2).23 The participants reported their habitual frequency and amount of beer, wine and spirits consumption, in weekly units of alcohol. Heavy alcohol use (no vs yes) was defined as >16 drinks/week for women and >24 drinks/week for men as these limits correspond with the lower limit for heavy use of alcohol set by the Finnish Ministry of Health and Social Affairs.24 Smoking status was categorised into non-smokers (never and former) and current smokers. Sleep difficulties were measured with the Jenkins Sleep Problem Scale25 and categorised as no sleep difficulties (sleep difficulties≤1 night/week), moderate sleep difficulties (2–4 nights/week) or severe sleep difficulties (5–7 nights/week).26
Data on chronic diseases were based on the question, ‘Have your doctor ever told that you have or have had ….?’ and the following diseases were taken into account: angina pectoris, myocardial infarction, stroke, claudication, osteoarthritis, osteoporosis, sciatica, fibromyalgia, rheumatoid arthritis, migraine and malign cancer. For the analyses, participants were categorised into having 0, 1, ≥2 chronic diseases. Mental disorders included depression and/or other mental diseases (no vs yes). Self-reported health was assessed with a five-point scale (1=good, …, 5=poor) and was then categorised as good (1–2), average (3) and poor (4–5) health. Psychological distress was measured with the 12-item version of General Health Questionnaire, which gives a total score ranging from 0 to 12. A cut-off point of three or more symptoms was used to indicate psychological distress (no vs yes).27
Statistical analysis
Characteristics of the study population before retirement (at wave −1) are presented as numbers and percentages for categorical variables and as means and SDs for continuous variables. We first calculated mean estimates and their 95% CIs for the total and domain-specific sedentary time in each study wave to illustrate the levels of these behaviours across the retirement transition (from wave −2 to wave +3). We used linear regression analyses with generalised estimating equations (GEEs). The GEE models control for the intraindividual correlation between repeated measurements using an exchangeable correlation structure and are not sensitive to measurements missing completely at random.28 29 The difference in the mean change in total and domain-specific sedentary time between two specific time periods—the retirement transition period (from wave −1 to wave +1) and the postretirement period (from wave +2 to wave +3)—was tested using a period*time interaction term.
We also examined whether sociodemographic and work-related factors (sex, occupational status, work status, marital status, heavy physical work, and occupational sedentary time), lifestyle factors (physical activity, BMI, heavy alcohol use, current smoking status, and sleep difficulties) and health factors (number of chronic diseases, mental disorders, self-reported health, and psychological distress) before retirement were associated with the magnitude of changes in total and domain-specific sedentary time during the retirement transition (from wave −1 to wave +1). For these analyses, the interaction term preretirement factor*time was added to the GEE models. All models were adjusted for age, sex and occupational status. The SAS V.9.4 Statistical Package was used for all of the analyses (SAS Institute).
Results
Characteristics of the study population are shown in table 2. Before the retirement transition (at wave −1), the mean age of the study population was 63.2 (SD 1.3) years, 39% had low physical activity level, 38% had normal BMI and 28% were free of chronic diseases. The mean time spent being sedentary at leisure was 4.7 (95% CI 4.5 to 4.8) hours/day. The total sedentary time before retirement differed by sex, work and marital status, physical strenuousness of the work, physical activity level, BMI category, alcohol use, severity of sleep difficulties, self-reported health status and the level of psychological distress (p<0.05 for all).
Total non-occupational sedentary time before retirement (wave −1) and mean changes in total sedentary time during the retirement transition period (from wave −1 to wave +1) by preretirement characteristics of the population
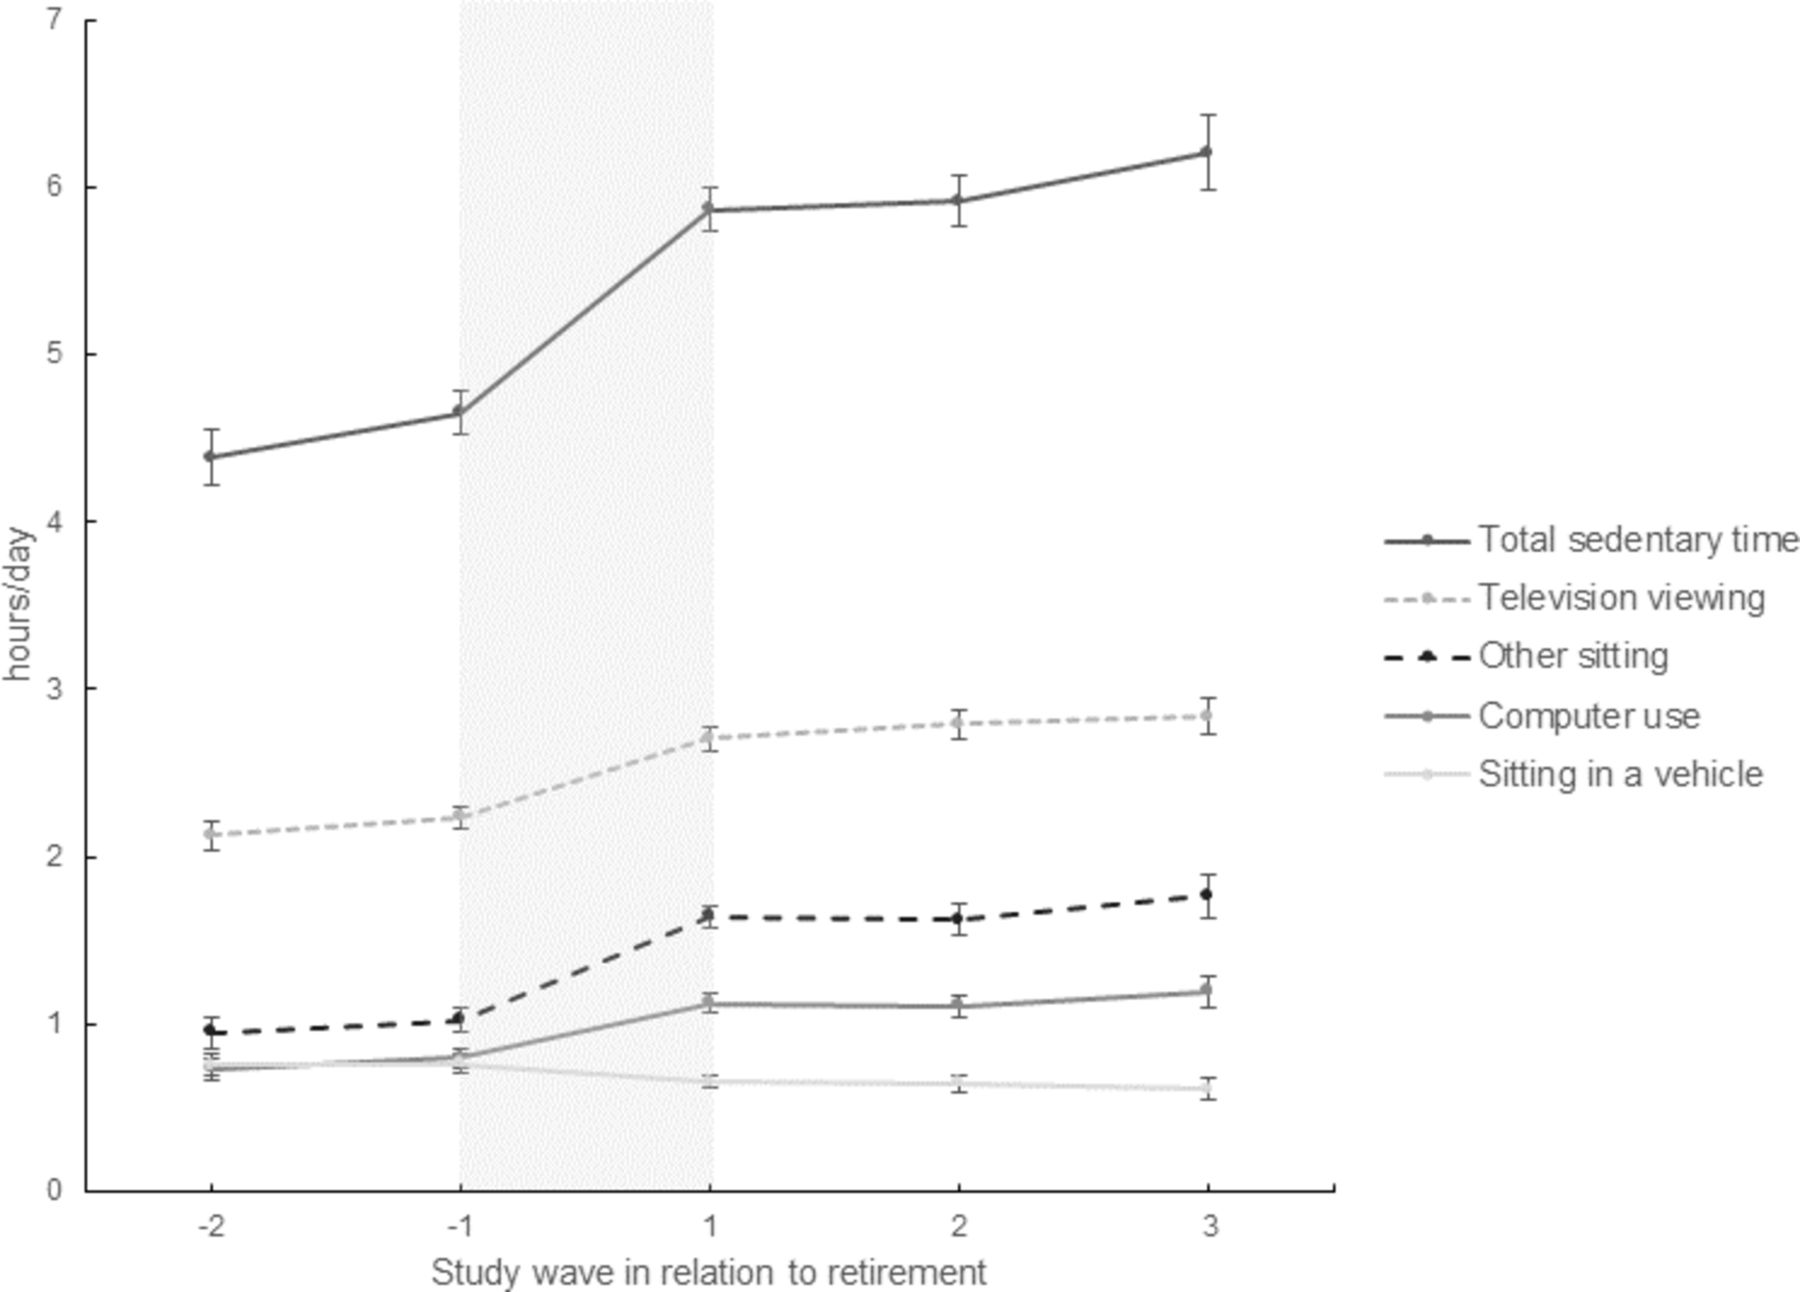
Figure 1 illustrates the changes in total and domain-specific non-occupational sedentary time across the retirement transition. The total sedentary time, including sitting time for television viewing, computer use, vehicle and other, increased by 73 min/day to 5.9 hours/day during the retirement transition and continued to increase by 18 min/day to 6.2 hours/day during the postretirement period. Thus the change in total sedentary time during the retirement transition was four times that of change during the postretirement period (period*time interaction p<0.0001). Of the domain-specific sedentary behaviours, television viewing time increased by 28 min/day to 2.7 hours/day, time spent on other sitting activities by 37 min/day to 1.6 hours/day, and computer use at home by 19 min/day to 1.1 hours/day during the retirement transition. Time sitting in a vehicle decreased by 6 min/day during retirement transition. Computer use and other sitting time continued to increase during the postretirement period (by 5 and 8 min/day, respectively).
Total and domain-specific sedentary times across the retirement transition. Adjusted for age, sex and occupational status.
Table 2 presents mean estimates for the change in total non-occupational sedentary time during the retirement transition by the preretirement characteristics. Online supplementary tables 1–3 present results for domain-specific sedentary behaviours. Women increased their total sedentary time more than men during the retirement transition (77 vs 56 min/day, sex*time interaction p=0.01). Changes in total sedentary time across the retirement transition among men and women are shown in online supplementary figure 1.
Supplementary file 4
Those who retired from full-time jobs increased total sedentary time more than those who retired from part-time jobs (78 vs 62 min/day, preretirement job status*time interaction p=0.02). This was also seen for the change in television viewing time (online supplementary table 1). Those who had high preretirement occupational sedentary time reported higher increase in total sedentary time during the retirement transition than those who had low occupational sedentary time (98 vs 65 min/day, preretirement occupational sedentary time*time interaction p<0.0001). This association was also seen for the changes in computer use (online supplementary table 2) and other sitting time (online supplementary table 3). In addition, those who had low preretirement physical activity level reported higher increase in total sedentary time during the retirement transition than those who had high preretirement physical activity level (79 vs 62 min/day, preretirement activity level*time interaction p=0.02). The preretirement physical activity level was also associated with the change in television viewing time (online supplementary table 1).
Supplementary file 1
Supplementary file 2
Supplementary file 3
Among those with severe sleep difficulties before retirement, the increase in total sedentary time during the retirement transition was reported to be higher than among those who had no preretirement sleep difficulties (89 vs 64 min/day, preretirement sleep difficulties*time interaction p=0.002). Sleep difficulties were also associated with the change in sitting time for computer use (online supplementary table 2). Those who had chronic diseases reported higher increase in total sedentary time during the retirement transition than those who had no chronic diseases before retirement (79 vs 61 min/day, preretirement disease status*time p=0.03). Furthermore, those who had mental disorders before retirement increased their total sedentary time more than those who had no preretirement mental disorders (94 vs 71 min/day, preretirement mental health*time interaction p=0.01). In addition, self-reported health before retirement was associated with the change in total sedentary time: those reporting poor health increased their total sedentary time more than those reporting good health (96 vs 68 min/day, preretirement health*time interaction p=0.03). Self-reported health showed strongest association with increased television viewing time (online supplementary table 1). Also psychological distress before retirement was associated with the changes in television viewing time (online supplementary table 1) and computer use (online supplementary table 2) during the retirement transition.
Discussion
This is apparently the first longitudinal study examining changes in non-occupational sedentary behaviours across the retirement transition. Total sedentary time as well as television viewing time, computer use at home and other sitting time increased during the retirement transition. Total sedentary time, and especially computer use and other sitting time, continued to increase during the years following retirement. Women, and those who had high occupational sedentary time, low level of physical activity, sleep difficulties, mental disorders or poor health before retirement were most likely to report an increase in total sedentary time during the retirement transition. Compared with previous studies, an advantage of the present investigation is the analysis of annual changes in sedentary behaviour using repeated measures of domain-specific sedentary behaviours across the retirement transition. In addition, we studied the associations between preretirement characteristics and the changes in total and domain-specific sedentary time during the retirement transition.
Our finding that total sedentary time, television viewing, computer use and other sitting time increase during the retirement transition corresponds to previous longitudinal findings showing higher increase in total leisure sedentary time,16 television viewing time8 15 16 and computer time16 among retiring adults than among those who remained employed. As sedentary behaviour in general2 4 and television viewing specifically30–32 are related to adverse health outcomes among older adults, our findings, among others, suggest that more attention should be paid to reducing overall sedentary behaviour and especially television viewing time after transitioning to retirement. We also observed that total, computer use at home and other sitting time continued to increase in the years following retirement. However, computer use and other sitting time increased to lower absolute level of sedentary behaviour per day than television viewing time. It is worth noting that computer use is mentally more activating than passive television viewing,33 and may not be as harmful for health among older adults.34 Despite the overall increase in non-occupational sedentary behaviour after retirement, we also observed that sitting in a vehicle decreased during the retirement transition. Similarly to our finding, a previous study has shown that passive transportation decreases more among retiring than among already retired adults.17 This decrease is probably mostly due to absence of commuting-related passive transportation after retirement.
A unique feature in our study is that we included a wide range of preretirement characteristics that could affect the magnitude of change in total and domain-specific sedentary behaviours during the retirement transition. We found that women increased their total sedentary time more than men, although men were more sedentary before retirement. Also high occupational sedentary time before the retirement transition was associated with greater increase in total, computer use and other sitting time during the retirement transition. Similar relationships were also seen in previous studies where higher work-related sitting35 and less physically demanding jobs15 associated with greater increase in screen time after retirement. Although less educated adults17 and those retiring from manual social class16 have previously been shown to be more susceptible to increase television viewing time after retirement, we did not observe similar associations.
According to our findings, high level of physical activity before retirement was associated with less increase in total and television viewing time during the retirement transition. Another novel finding is that those who had sleep difficulties, mental disorders or poor health before retirement were most likely to report an increase in total sedentary time during the retirement transition. Sleep difficulties were associated with increased sitting time for computer use whereas poor self-reported health associated with increased television viewing time. In addition, preretirement psychological distress was associated with increased television viewing and computer use after retirement. These findings add to previous studies which have found that sedentary behaviour is associated with poor sleep quality,36 poor mental health37 38 and increased risk of depression.39 40
The main limitation of this longitudinal study is the reliance on self-reported data, which can lead to bias and under-reporting of sedentary time.3 To our knowledge, the questionnaire used in this study is not validated against objective measurements of sedentary behaviour. In addition, since we calculated the total non-occupational sedentary time based on the time used in different domains, we were not able to control the simultaneity of domain-specific sedentary behaviours. This may have led to slight overestimation of the total sedentary time. However, the assessment of sedentary behaviour as self-reported hours/day is frequently used in observational studies7 and we were able to use the same question of domain-specific sedentary behaviours in each of the study waves. Future studies with objective monitoring of sedentary time are needed to fully understand the changes in sedentary behaviour during the retirement transition.
There are also some other methodological issues that deserve discussion. We only assessed sedentary time on non-weekend days. This can be a limitation because sedentary time may be different in weekend versus weekdays among older adults.41 On the other hand, by focusing on weekdays only we were able to better capture changes in non-occupational sedentary behaviour when weekday routines change after retirement. In addition, we did not include occupational sedentary time in the calculation of total sedentary time because occupational sitting disappears after retiring from work16 and this would have masked the increase in non-occupational sedentary behaviour.14 Instead we examined changes in sedentary behaviour during the retirement transition based on the levels of preretirement occupational sedentary time. Finally, the study population is representative of the Finnish public sector employees; however, the results may not necessarily be generalisable to other sectors.
Conclusions
Total non-occupational sedentary time and television viewing, computer use and other sitting time increased during the retirement transition. Total sedentary time continued to increase during the postretirement period. Women and adults who had high occupational sedentary time, low physical activity level, sleep difficulties, mental disorders or poor health before retirement were most likely to report an increase in time spent sedentary after the retirement transition. However, objective measurements are needed to fully understand the changes in sedentary behaviour across the retirement transition.
What is already known on this subject
Retirement is associated with increased time spent sedentary.
There are no longitudinal studies with repeated measures of sedentary behaviour domains across the retirement transition.
What this study adds
Total and domain-specific sedentary behaviours, except sitting in a vehicle, increase during the retirement transition.
Total non-occupational sedentary time continued to increase during the years following retirement.
Women, and those who had high occupational sedentary time, low physical activity level, sleep difficulties, mental disorders or poor health before retirement were most likely to report an increase in total non-occupational sedentary time during the retirement transition.
References
Footnotes
Contributors SS and JV designed this study and the data collection. TL analysed the data and drafted the manuscript. All authors contributed to data interpretation, revised article critically and approved the final version of manuscript.
Funding This work was supported by Juho Vainio Foundation, Finland (to TL and SS); the Academy of Finland (Grants 286294 and 294154 to SS; 311492 to MK; 309526 to TL); Finnish Ministry of Education and Culture (to SS); Nordforsk (to MK and JV); and the UK MRC (Grant K013351 to MK).
Competing interests None declared.
Patient consent Not required.
Ethics approval The FIREA study was conducted in line with the Declaration of Helsinki and was approved by the Ethics Committee of Hospital District of Southwest Finland.
Provenance and peer review Not commissioned; externally peer reviewed.
Data sharing statement The datasets used and analysed during the current study are available from the corresponding author on reasonable request.