Article Text

Abstract
Study objective: Heat and cold have been associated with increased mortality, independently of seasonal trends, but details are little known. This study explores associations between mortality and temperature in two European capitals—Sofia and London—using four years of daily deaths, air pollution, and weather data.
Design: Generalised additive models were used to permit non-linear modelling of confounders such as season and humidity, and to show the shape of mortality-temperature relations—using both two day and two week average temperatures separately. Models with linear terms for heat and cold were used to estimate lags of effect, linear effects, and attributable fractions.
Participants: 44 701 all age all cause deaths in Sofia (1996–1999) and 256 464 in London (1993–1996).
Main results: In London, for each degree of extreme cold (below the 10th centile of the two week mean temperature), mortality increased by 4.2% (95% CI 3.4 to 5.1), and in Sofia by 1.8% (0.6 to 3.9). For each degree rise above the 95th centile of the two day mean, mortality increased by 1.9% (1.4 to 2.4) in London, and 3.5% (2.2 to 4.8) in Sofia. Cold effects appeared after lags of around three days and lasted—particularly in London—at least two weeks. Main heat effects occurred more promptly. There were inverse associations at later lags for heat and cold in Sofia.
Conclusions: Average temperatures over short periods do not adequately model cold, and may be inadequate for heat if they ignore harvesting effects. Cold temperatures in London, particularly, seem to harm the general population and the effects are not concentrated among persons close to death.
- ambient temperature
- mortality
- generalised additive model
- time series
Statistics from Altmetric.com
Mortality has long been known to be seasonal, and has been associated with the effects of both heat and cold.1–4 Though the seasonality of deaths is probably attributable to a combination of factors including exercise, diet, social interactions, pollution effects, etc, hot and cold outdoor temperatures have been associated with increased mortality independently of season.4–7 In multi-country studies, cold related mortality has been found to be greater in less affluent countries, and in those with warmer winters.1,3 A multi-city study in the United States found that estimated heat effects were greater in the cooler, northern states, and that cold effects were greater in the south.5
Methods used to assess temperature related mortality have varied considerably, and so have the way in which results have been presented. In most countries, temperature and season are clearly related to each other, so that many studies have controlled for season, though others have not. Season has been controlled for in various ways, for example, by including “month” as a variable in the model,4,6 adding sinusoidal curves,8 or by digital filtering.7 Longer term trends have been added, for example a simple linear function of date.6 More recently, smoothed functions of date, for example as produced by generalised additive models, have been used to capture both seasonal and longer term trends in a flexible way.5 These smooth functions may also partially or wholly capture variation attributable to seasonal epidemics such as influenza.5 Air pollution may play a confounding part in mortality-temperature relations,9 and some researchers have controlled for this, others not.
Unlike air pollution, with its presumed monotonic, if not linear, dose-response relation, both the extremes of temperature have adverse effects upon health. This causes complications in modelling, and some researchers have dealt with the problem by concentrating only upon cold effects or heat effects—sometimes but not always by splitting the year into cold and hot seasons—sometimes even by comparing total mortality in two places, one colder than the other. In other studies, heat and cold have been modelled simultaneously—graphically, using a smoothed function of temperature, produced from a generalised additive model,5 or as slopes, linear estimates of effects above and below some threshold.3–6 Where these slopes are found to differ, for example between countries, it may not be clear how well these differences reflect actual differences in the overall impact of temperatures on mortality, given that the effects may operate over different numbers of days in different countries, or that temperatures may be reach greater extremes in one than another.
Our aim in this small study was to explore, in as transparent a way as possible, associations between mortality and temperature in two very different European capitals—London, a northern maritime city, and Sofia, at the opposite end of the continent, considerably less affluent and with a more extreme climate. We assess the associations graphically, and also produce estimates of linear effects (for heat and cold), exploring the effects of lag and of differing choices of cut off points. We also attempt to assess and compare the overall impact of heat and cold on mortality, under some simple assumptions.
METHODS
Mortality and temperature data
Four years of daily mortality were collected, from the Office for National Statistics for London, 1993–1996, and from the Civil Register of the Administrative Service for Sofia, 1996–1999. Temperature data over the same periods were collected from The British Atmospheric Data Centre and the Bulgarian National Institute for Hydrology and Meteorology. Associations were examined between all cause mortality and both two day and two week average temperatures. For the two day mean, the average was taken of the current day’s mean temperature and the previous day’s mean temperature. Similarly for the two week mean—an average of mean temperatures from the current and the previous 13 days.
Potential confounders
Data were collected on daily relative humidity, and on particulate matter levels (black smoke for London, TSP for Sofia).
Analysis
All analyses were done in STATA v6, using generalised additive (Poisson) models (GAMs).10–12 These allow some variables to be entered as linear terms, and others to be entered as smoothed functions, whose smoothness is determined by the number of degrees of freedom (the more degrees of freedom, the more flexibility is allowed in the shape of the function). The convergence tolerances of the GAM function were set to a low value, of 10−9, with a limit of 1000 iterations. We controlled for day of week, public holiday, particulate matter (with a one day lag), relative humidity and season (a smoothed function of date with seven degrees of freedom per year).13 The residual from the previous day was entered to allow for temporal autocorrelation, under the transitional model paradigm.14 Variances were multiplied by the overdispersion factor (a factor which, if greater than 1, indicates more variability than would be expected from a Poisson process). This overdispersion factor was itself estimated from the Poisson model.
(a) The shape of the mortality-temperature relation:
Smoothed mortality-temperature functions were estimated to assess visually the shape of the relations between mortality and temperature. This was done separately for the two day and the two week mean temperatures to describe prompt and possibly delayed effects respectively. As the temperature ranges differed between the two cities, the temperature terms were entered into the model with one degree of freedom allowed per five temperature degrees, rather than specifying a fixed number of degrees of freedom.
(b) Quantitative estimates, and lags, of temperature effects at upper and lower extremes:
In a second model, instead of using a smoothed mortality-temperature function, we used linear terms to represent “heat” and “cold”. Thus we obtained quantitative effect estimates of heat and cold that could be compared between cities. The “heat” term was the average, over two days, of the daily number of degrees above the 90th centile of the two day mean temperature. Similarly “cold” was the average, over two weeks, of the daily number of degrees below the 10th centile of the two week mean. By using these centile cut off points, instead of defining the same absolute cut off points in both cities, we attempt to create relative definitions of cold and heat. This allows for possible acclimatisation, for example, by which a temperature considered low in one climate may be considered moderate in a colder climate. The “heat” and “cold” terms were present simultaneously in the model. Differences in estimates between the two cities were tested for significance using z tests. We also counted the number of cold and hot “day degrees”—the total numbers of degrees above/below the cut off points over the days at risk, as measures of the total hot-ness and cold-ness over the study period.
To examine the lag of heat and cold effects, extra linear temperature terms were added for previous days or (going further back in time) averages over groups of days—a version of Schwarz’s unconstrained distributed lag model.15 Lags up to 25 days were considered using eight “heat” and eight “cold” terms: current day’s temperature (day 0), the previous day’s (day 1), and terms for day 2, day 3, days 4–6, days 7–11, days 12–18, and days 19–25. The rationale for grouping in this way is twofold. To include separate terms for each day would be to introduce unnecessarily a lot of (possibly spurious) parameters into the model. Also, the further away in time a “cause” is from its “effect”, the more imprecise is likely to be the time at which the effect occurs. Kunst and other researchers have used similar methods, to reduce collinearity between terms.8 Lags further back in time were not examined as these would be likely to be inseparable from the longer term seasonal smooth.
(c) A more absolute, and more inclusive, definition of “cold” and “heat”
The choice of 10th and 90th temperature centiles as cut off points for “cold” and “heat” represented a relative definition of heat and cold with regard to the different climates of the two cities. A second definition was used, as a contrast with the first. Here we found a single cut off point, the same in both cities, thus imposing a “V” shaped relation across the whole temperature range. The cut off point was found by trying all integer possibilities from 15°C to 25°C in both cities and identifying the one which maximised the joint likelihood. As with the centile model, the “heat” and “cold” terms were the averages over two days and two weeks respectively of the daily number of degrees above and below the cut off point. Analyses of linear associations and of lags were re-done, using this V model.
(d) Attributable fractions
For each set of cut off points above, the fractions of mortality attributable to heat and to cold were estimated as the mean of the fractions (RR−1)/RR over deaths, where RR is the relative risk due to heat(cold)on the day of death according to the logistic regression model.16
(e) The role of particulate matter in the model
Heat and cold effects (using the centiles as cut off points) were re-estimated without particulate matter in the model, to see whether it had a confounding effect on the mortality-temperature relations.
RESULTS
Temperatures ranged from −6°C (the minimum of daily minimums) to 34°C (the maximum of daily maximums) in London, and from −17°C to 37°C in Sofia. Mean winter temperature (October to March) was 8.0°C in London and 3.9°C in Sofia, summer means 17.0°C and 17.4°C respectively.
(a) Shape of mortality-temperature relation:
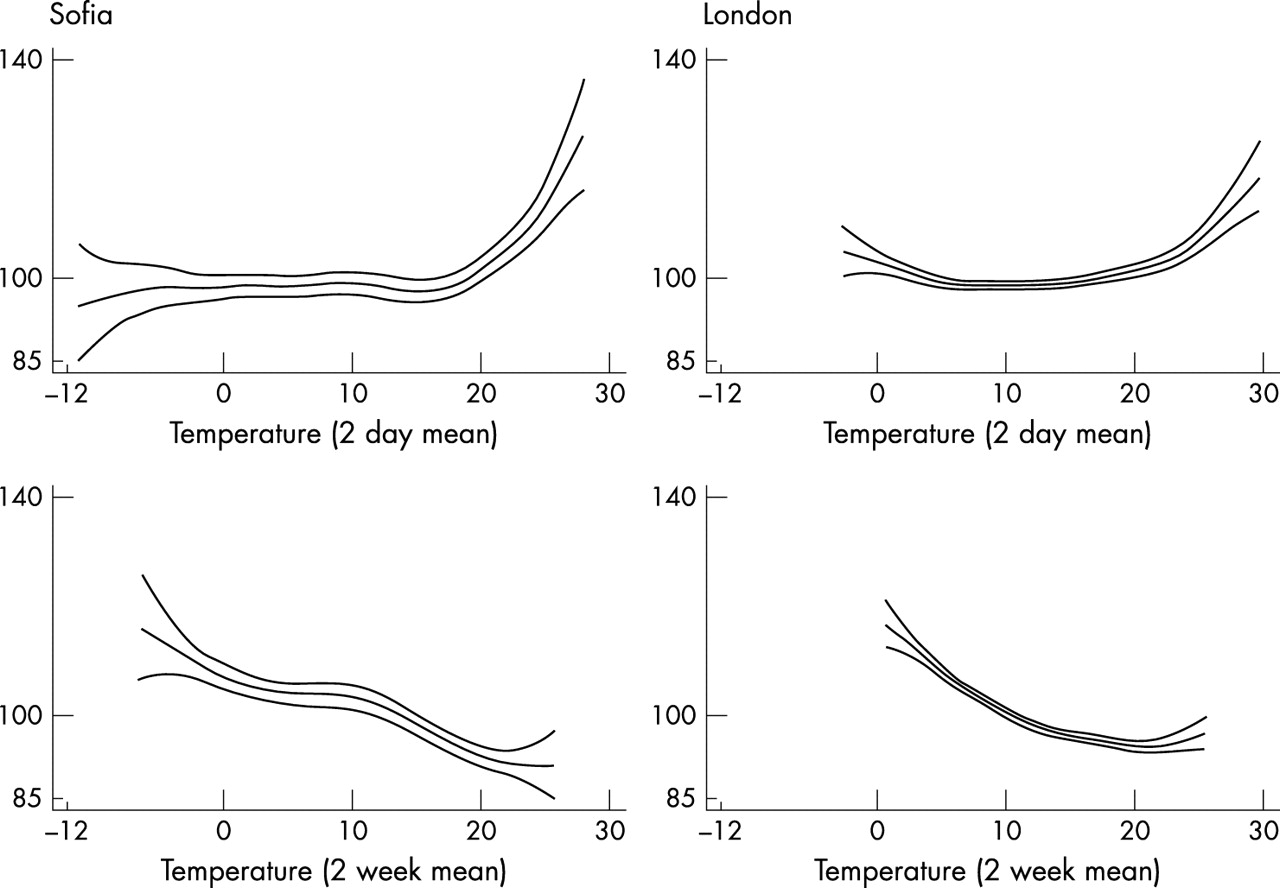
Figure 1 shows fitted mortality-temperature curves, for two day mean temperature and two week mean temperature. The curves show, for values across the temperature range, the fitted number of deaths (and 95% confidence intervals) re-scaled as a percentage of the mean number of daily deaths for that city. For reasons that will become clear below (in the results about lags of effect) the two day mean better captures heat effects and the two week mean better captures cold effects. This is apparent from figure 1.

Fitted deaths (scaled to be a percentage of mean daily deaths) in Sofia (left) and London. Plotted against temperature, two day mean (top) and two week mean.
The heat effect, as depicted in the graphs for the two day mean temperature, appears stronger in Sofia than in London.
Both cities show a rise in mortality as the two week mean temperature drops, and this extends—most strikingly in Sofia—over much of the temperature range. Wider confidence intervals in Sofia reflect lower numbers of deaths—an average of 31 per day, compared with 176 in London.
(b) Quantitative estimates, and lags, of temperature effects:
The 10th and 90th centiles of the two week and two day mean temperatures respectively were used as cut off points for cold and heat effects. These gave cold cut off points of 5.25°C in London and −0.46°C in Sofia. The heat cut off points were similar in the two cities: 21°C and 21.55°C respectively.
All the estimated linear effects were statistically significant, and differed noticeably between the two cities. For a one degree average drop below the 10th temperature centile over two weeks, mortality in London increased by 4.24% (95% CI 3.41 to 5.07) after controlling for season and other potential confounders (table 1). In Sofia, mortality increased by a smaller amount, 1.83% (0.59 to 3.90). The total number of cold day degrees, according to this definition of “cold”, was larger in Sofia than in London (492 v 426).
Total numbers of degrees above (below) cut off point, on days defined as hot (cold) using the given cut off points
Conversely, estimated heat coefficients were larger in Sofia than London. For a one degree average rise above the 90th temperature centile over two days, mortality in London increased by 1.86% (1.36 to 2.36), and in Sofia by 3.49% (2.23 to 4.76). The total number of hot day degrees was higher in London.
Before controlling for season and the other potential confounders, apparent heat effects in both cities were weaker—in fact, were inverse—and not statistically significant (table 1). The opposite was the case for the associations seen between cold and mortality—associations appeared stronger before controlling for potential confounders. The degree of confounding appeared to be greater in Sofia than in London.
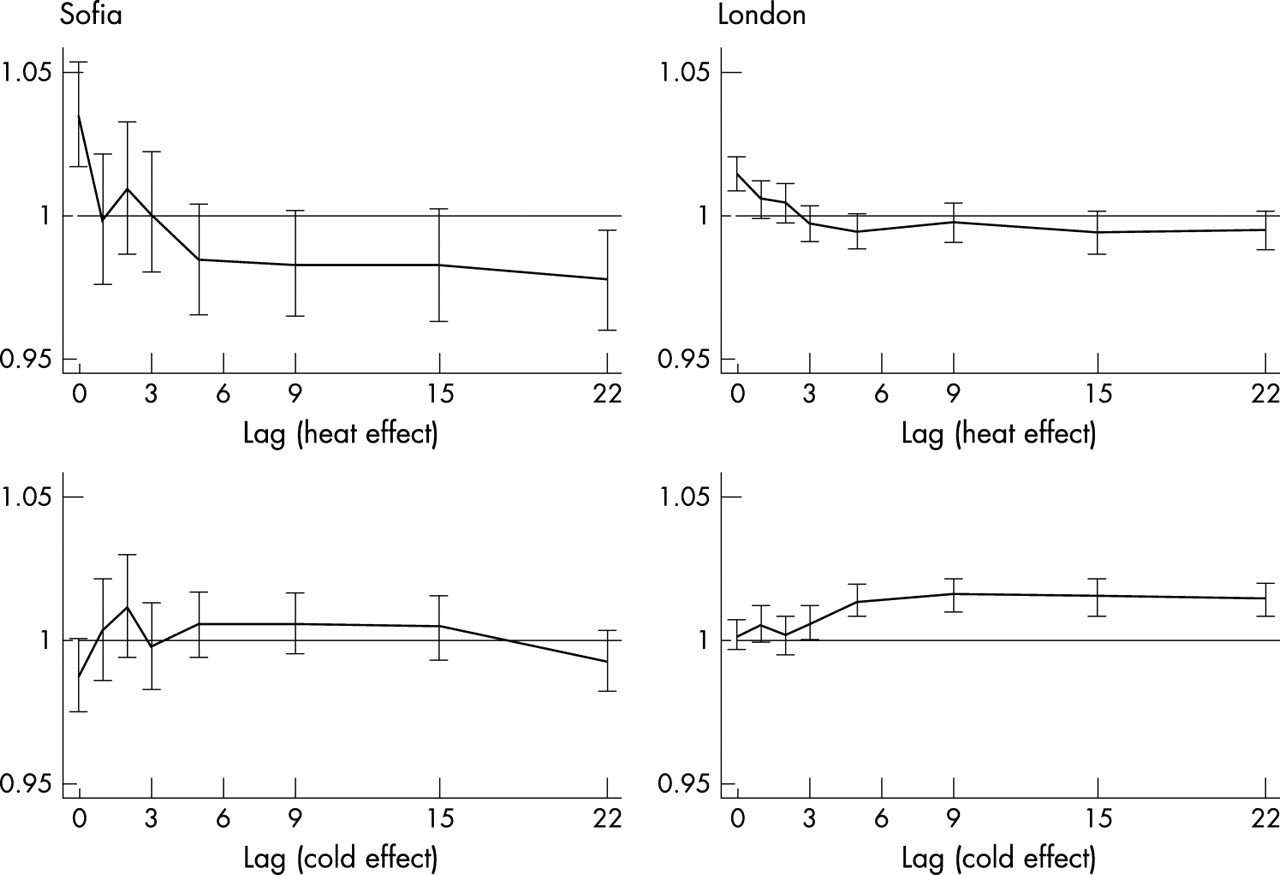
Figure 2 shows the estimated cold and heat effects, all mutually adjusted, across a range of lags. In Sofia, there was a strong heat effect on the current day, representing an increase in mortality of around 3.5% for an average one degree rise above the 90th centile, after controlling for potential confounders and the effects of previous days’ hot (or cold) weather. Between a lag of five days, and a lag centred around 22 days, estimated heat coefficients were all considerably below 1—that is, apparently beneficial. In London, a smaller heat effect of around 1.5% operated on the current day. Heat coefficients in London then dropped towards and then slightly below 1, where they remained.
Rate ratios (and 95% confidence intervals) for heat (top) and cold (bottom) effects on the current day and previous days/groups of days. Rate ratios show the change in mortality for a one degree mean rise above the 90th centile of the two day mean (top), and a one degree mean drop below the 10th centile of the two week mean (bottom).
Cold effects in London operated over a considerable period, most strongly after a lag of three days, and were still very evident at a lag of 22 days. The individual cold coefficients in Sofia, though also above 1 for much of this same period, were smaller than in London, and not individually significant, and dropped slightly below 1 at a lag of 22 days. In Sofia there was an apparent beneficial effect of cold on the current day, after allowing for effects of cold (and/or heat) on previous days.
(c) Quantitative estimates assuming a V shaped mortality-temperature relation with common cut off point
The cut off point that maximised the joint likelihood was at 18°C. The V shaped relation meant that heat or cold effects operated on all days. In particular, many more days contributed to the “cold” effects, and per degree estimates of both heat and cold coefficients were correspondingly lower. The increase in mortality in London, for a one degree rise above 18°C, was 1.30% (0.99 to 1.62), after adjusting for season and the other confounders (table 1). The increase in mortality for each degree fall below 18°C was 1.43% (1.28 to 1.58)—much smaller than the estimated linear effect below 5.25°C, the 10th centile. In Sofia, the increase in mortality for a one degree rise above the cut off point was 2.21% (1.55 to 2.87), and for a one degree fall below the cut off point was 0.70 (0.51 to 0.88).
Although coefficients were smaller than seen in the previous model, in overall pattern the results were similar.
Patterns seen for cold and heat effects across a range of lags, using this V shape model, were essentially the same as those seen previously. The greatest difference was that heat effects in London did not remain below zero at greater lags, but dropped to and stayed around zero. In Sofia, as before, heat effects beyond a lag of three days were all below zero.
(d) Crude estimates of the attributable fractions of mortality attributable to heat and cold
Around 1.4% of deaths in London were estimated as being attributable to cold (table 2), using the centile cut off points, and 0.67% of deaths in Sofia. The numbers attributable to heat were far fewer than for cold in London, 0.44%, but 0.72% of deaths were attributable to heat in Sofia—similar to the fraction for cold.
Percentage (95% CI) of deaths attributable to cold and heat, estimated using different cut off points
The sizes of linear coefficients estimated by the V shaped model were smaller, but all days contributed to heat or cold effects, not just the extremes, and the estimated attributable fractions of deaths were larger. This was particularly so for cold, with 5.75% of deaths attributable to cold in Sofia, and 8.67% in London. Attributable fractions for heat were 1.66% and 0.82% respectively.
(e) The role of particulate matter in the model
The estimated PM effect in Sofia was highly significant, after controlling for temperature, season and the other potential confounders: an increase of 0.06% (0.03 to 0.10) in mortality per 1 μg/m3 increase in TSP. The estimated increase in mortality in London per unit of black smoke was of a similar order, but of no statistical significance: 0.08% (−0.67 to 0.84).
Excluding particulate matter from the model increased estimates of both heat and cold coefficients in both cities, but only very slightly. The largest difference was in the cold coefficient for Sofia, which was 1.83% (0.59 to 3.90) with PM in the model (table 1), and 2.18% (95% CI 0.98 to 3.40) without it.
DISCUSSION
For two capital cities of Europe, Sofia and London lie far apart both geographically and economically. Their climates are similar, relative to other parts of the world, but temperatures reach much lower (and a little higher) in Sofia than in London.
Key points
-
Cold and heat are both strongly associated with mortality in both cities
-
Stronger heat effects in Sofia may be partly attributable to “harvesting”
-
Winter is harmful, and summer beneficial, independent of temperature
We found heat and cold to be highly predictive of mortality in both cities. The effect of cold was greater in London, whether measured as a mortality rate ratio per degree change, or an overall percentage of attributable deaths. Heat effects were greater in Sofia. It has been found elsewhere that cold effects tend to be lesser in areas of colder winters, and heat effects lesser in areas of warmer summers—this apparent paradox has been ascribed to acclimatisation, including, for example, differences in clothing.17 Our “cold effect” results support such a hypothesis. Defining which was the “hotter” city was less conclusive, and so it was unclear exactly how compatible our “heat” results were with such a hypothesis. Other factors besides acclimatisation are likely to be operating in the temperature-mortality effect. Previous studies have linked higher effects of heat/cold with lower socioeconomic status, and a large affluence gap may be over-riding the comparatively small difference in hot temperatures—however, other studies have cast doubt on the socioeconomic link.18–20 Hajat et al found that the presence of heatwaves increased heat effect estimates.21 Clusters of three or more days with temperatures above the 99th centile exist in both datasets—but one in London and three in Sofia, a difference that may also contribute to our findings.
We found main heat effects occurring on the current day, and perhaps lasting another day or two in London. In contrast, main cold effects did not occur immediately, but after lags of around three days, and—particularly in London—lasting for well over two weeks. Other researchers report similar findings, though Curriero found only weak associations between mortality and weather at lags greater than four days.5,6,22,23 Inverse effects of cold were seen in Sofia after about three weeks, and of heat after about four days—these may indicate harvesting, the bringing forward of imminent death. Braga remarked that, from their findings, “the hot temperature effect appears to be primarily harvesting”.22 Inverse heat effects at later lags were less evident in London, and not at all for cold.
Heat coefficients were greater in the full than in the unadjusted model, whereas cold coefficients were reduced by controlling for confounders. These changes were largely attributable to season. Adjusting, singly, for the other covariates made little difference (results not shown). This confounding in opposite directions may indicate harmful winter effects and beneficial summer effects, both acting independently of temperature, for example, because of differences in diet, sunlight, etc.
There were no major influenza epidemics in either city during the study period. However, we checked, using London influenza notifications, the impact of controlling for flu (results not shown above). Influenza was an independent predictor of mortality, but heat and cold coefficients were not significantly changed by including it in the model. We feel it unlikely that including flu would have changed our conclusions. Nor did measures of particulate matter greatly confound any mortality-temperature associations.
Possible permutations of temperature-mortality models seem almost endless, and the biological and epidemiological evidence upon which to base the choices is scarce. We have attempted to explore a few simple variations and hence to reflect upon our way forward, drawing on current time series methodologies developed by Schwartz, Dominici, and others.11,13,15
Among quantitative estimates of effect, linear temperature-mortality slopes seem the type most often presented in previous studies. These may not fully compare the impacts of temperature upon mortality. For example, city A may have a steeper cold-mortality slope than city B, but if temperatures frequently drop lower in city B, the overall impact of cold may be greater in city B. We therefore also presented fractions of mortality attributable to cold and heat, under assumptions of linearity and of the choice of cut off points. The choice of cut off point changes both types of estimate. In the event, the patterns of higher cold effects in London, and higher heat effects in Sofia, seemed robust both to the choice of cut off points and to the type of estimate, but this may not always be the case. %We used two a priori definitions of cut off points, intended to provide direct comparisons between the cities—one of effects of absolute temperature, one of relative temperature. The cut off point used for the V shape model was chosen empirically (using likelihood methods). This has been done before, sometimes allowing different cut off points for each city.4–6 The last idea is attractive—and useful in providing effect estimates for modellers, say—though makes resulting estimates less comparable between cities, as the selected cut off points may vary in both absolute and relative terms. The V shape model, though imposing some possibly undesirable constraints, removes other difficulties from analysis and interpretation associated with a two cut off point model—for example, finding that the empirically derived “hot” cut off point is below the “cold” cut off point—and may give good results for the purposes of comparison.
Using the V shaped model allows all days to contribute to the temperature-mortality effects, and estimates of attributable fractions of deaths are correspondingly higher, with over 8% of deaths in London attributable to cold. These high figures are compatible with attributable fractions published from previous studies.4,24,25 Keatinge and colleagues, albeit not controlling for season, show London/UK attributable mortality corresponding to figures of around 5% to well over 10%. Although we cannot rule confounding out, we have attempted to account for obvious factors, and the smoothed GAM function of time also helps to account for unmeasured effects. It should also be mentioned that cold is thought mainly to precipitate deaths from other causes—usually cardiovascular disease—rather than cold itself being thought of as the sole cause of all these excess deaths.26,27
The V shaped model and the centile model estimate overall and extreme effects of temperature—and, in our use of them here—give an absolute and a relative comparison. The type of estimate required would inform the choice of model. Actual fit of model would not have helped us choose between them in this instance, though it might do elsewhere. Comparing deviances, the V shaped model fitted the Sofia data better and the centile model fitted the London data better. Looking at the GAM graphs, a V shaped model with a cut off point at roughly 18°C seems not a bad approximation. Separate maximum likelihood estimates of V cut off points for Sofia and London were 17°C (95% profile interval 15 to 20) and 21°C (18 to 24) respectively.
Because of the lags of effects, we used two day temperature averages to represent heat, and two week averages to represent cold. If there is no mortality-heat association beyond a few days’ lag, then averaging over a longer period should not bias the result but is likely to reduce power. If a considerable part of heat related mortality is actually the short-term bringing forward of imminent death, then averaging over a longer period may really be more appropriate, and results using two day means may be overestimates. This seems plausible from figure 2. Conversely, for cold, averaging over a shorter time could underestimate and/or reduce power to detect effects.
Inverse mortality-cold associations seen on the current day, after controlling for previous days’ cold (and hot) temperatures, are hard to interpret. Keatinge suggests vasoconstriction, delaying deaths among the very ill, and assessment of this hypothesis would be useful.28
We consider it preferable to look at heat and cold effects together. In both cities we found “cold” days during the summer months, even with our more extreme definition of cold, and a few “hot” days in winter. To estimate the effects of one, in a time series analysis, without controlling for the other may therefore be in error.
Heat and cold have both been found to have harmful effects in both cities. Heat effects were worse in Sofia, though this may be ignoring some harvesting. Cold effects were worse in London. If inverse associations with cold at later lags are signs of harvesting, then the fact that this was seen in Sofia and not London suggest that cold temperatures in London harm the general population and the effects are not concentrated among persons close to death.