Article Text

Abstract
Study objective: This study investigated the relation between heat and mortality in London to determine the temperature threshold at which death rates increase and to quantify the effect of extreme temperatures on mortality.
Design: Daily data on all cause mortality and temperature were obtained for a 21 year period and the relation between them investigated both graphically and by using non-parametric time series methods of analysis.
Setting: Greater London.
Participants: Daily mortality counts in Greater London between January 1976 and December 1996.
Main results: A plot of the basic mortality-temperature relation suggested that a rise in heat related deaths began at about 19°C. Average temperatures above the 97th centile value of 21.5°C (excluding those days from a 15 day “heatwave” period in 1976) resulted in an increase in deaths of 3.34% (95% CI 2.47% to 4.23%) for every one degree increase in average temperature above this value. It was found that the 1976 heatwave resulted in a particularly large number of deaths in comparison with other hot periods.
Conclusions: These results suggest that heat related deaths in London may begin at relatively low temperatures. Hot days occurring in the early part of any year may have a larger effect than those occurring later on; and analysis of separate heatwave periods suggest that episodes of long duration and of highest temperature have the largest mortality effect.
- time series analsyis
- hot temperature
- death
Statistics from Altmetric.com
It has long been known that hot temperatures are associated with increases in mortality.1–3 Much work in the field has been based on isolated episodes (“heatwaves”)4–6; however, such studies are criticised on the grounds of an uncertain baseline and on the overestimates that can be produced from short-term mortality displacement.7 In contrast, a time series approach using daily data can overcome some of these problems.8–10
The increases in death rates that have been observed occur principally in the elderly10 and are observed both for cardiovascular and respiratory diseases.4 Studies in various parts of the world have shown different values at which increases in heat related mortality begin depending on the acclimatisation of the population in question to local climate.11–13 For this reason, it has not been possible to develop a consistent standardised definition of a heatwave between populations that incorporates the intensity and duration of high temperatures and the population response. In the Netherlands, a formal definition of a heatwave has been devised by The Netherlands Royal Meteorological Institute and consists of a time span of at least five days of which each day has a maximum temperature of at least 25°C and of which at least theee days reach a maximum temperature of at least 30°C.5 In the UK, however, no formal definition of a heatwave exists.
We studied the relation between heat and mortality in London using data available over a 21 year period in order to determine the temperature value at which death rates increased. In addition, we wished to determine whether the relation was linear above this value and whether it remained so even across extreme temperature ranges experienced during a “heatwave”. Also, as a form of sensitivity analysis, we assessed the effect of choosing different values above which deaths were assumed to rise, and investigated the most appropriate lag period between hot days and any increase in mortality. We also considered the separate effects on respiratory and cardiovascular deaths, the relative contribution to excess mortality of maximum and minimum temperatures, and whether the characteristics of heat episodes and their relative effects on mortality have changed over time.
METHODS
Data
Files of deaths in Greater London were obtained from the office of National Statistics. Daily mortality counts between January 1976 and December 1996 were constructed for deaths from all causes other than accidents or violence (ninth revision of the International Classification of Diseases (ICD 9) <800), all respiratory diseases (ICD-9 460–519) and all cardiovascular diseases (ICD-9 390–459). No distinction was made by sex or age and only deaths of those resident and dying in Greater London (defined by health authority boundaries and covering a population of some 7 million people at the 1991 census) were included in the analysis.
Daily maximum and minimum temperature measures at Holborn, Central London, were obtained from the Meteorological Office. The 6 am and 3 pm daily relative humidity measures were also obtained from the same site. Daily average temperature and relative humidity measures were computed as the mean of their two respective values.
Time series analyses
The first stage of the analysis concerned building up a statistical model of the daily number of deaths over the 21 year period. Time series methods of analyses were used to provide a seasonally adjusted baseline against which the measurement of the effects of high temperatures on mortality were made. These methods use Poisson regression and non-parametric smoothing techniques to model seasonal patterns (seasonality) in mortality and to make appropriate adjustments for other relevant environmental factors such as relative humidity. The inclusion in the model of terms for high temperature days allow their effects to be assessed relative to the seasonal “norm” predicted from the model.
In this study, a non-parametric smoother was used to control for seasonality as part of a generalised additive model (GAM).14 A loess smoother was used as, relative to other smoothers, it has a particular local behaviour and so should pick up awkward shapes in the data well. The span, or window, of the loess smoother was varied to control the degree of smoothing carried out on the time series. The aim was to select the span that removed long term seasonality but that left patterns of a short-term nature that may be related to acute effects of hot temperatures. To determine the amount of smoothing needed a relatively large span was initially used, around 365 days, and the model diagnostics examined; successive reductions in the smoothing window were then made, with a reassessment of model diagnostics at each step. Goodness of fit of the statistical model was assessed from the model residuals, the magnitude of the dispersion parameter, the partial autocorrelation function (PACF), and the model deviance. These diagnostics suggested using an eventual span of 183 days for the loess smoother to control for seasonality. Dummy variables were used to allow for day of week and public holiday effects, and influenza epidemics were also adjusted for by identifying individual epidemics in the mortality series and controlling for them using separate smooth functions. Temperature and humidity were not adjusted for at this stage.
Estimating the association between mortality and hot days
This part of the analysis was divided up into three stages:
-
As an indicator of extremely hot days (that is, those that are likely to contribute to a heatwave), the value of the 99th centile of the whole range of average temperature was determined. To identify periods during which the temperature was high for consecutive days, a smooth of the temperature series was created using a three day moving average. Then, hot days were identified as taking the value of average temperature on those days from the “smoothed” temperature series that were greater than the 99th centile value of average temperature.
-
A plot of the hot days against mortality suggested a linear relation between the two, and so a linear term for hot days was added to the “core” model. Also at this point, terms for humidity and moderate temperatures (that is, temperatures below our cut off value) were also incorporated into the model to adjust for the seasonal baseline. For each factor a broad loess smooth (of 50% span) was used for the average measure of lags 0 (day of death), 1 (day before death) and 2 (two days before death). This would allow evaluation of the effects of hot periods on death over and above what would be expected from weather variables for any particular time of year.
-
Diagnostic plots of this model were then investigated to check model fit. Two autoregressive terms were added to the model to allow for significant autocorrelation (the non-independence of adjacent days) remaining on the first two lags. Then, after allowance for overdispersion, Poisson GAM (quasi-likelihood) regression was used to estimate the percentage change in the number of deaths associated with a given increase in the temperature measure.
Sensitivity analyses
To investigate the nature of any relation between mortality and hot days more fully, various sensitivity analyses were conducted on our derivation of hot days.
All statistical analyses and figures were conducted using S-Plus,15 except for figures 4 and 5, which were from Excel.16
RESULTS
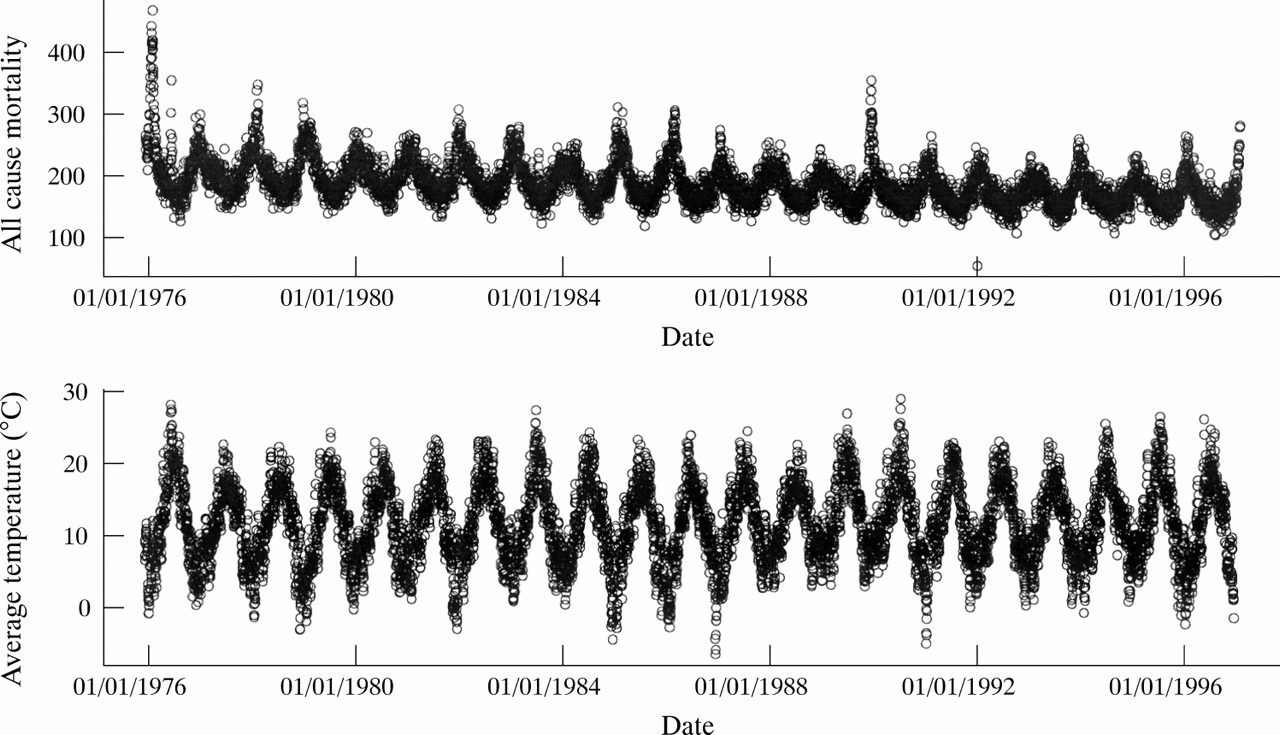
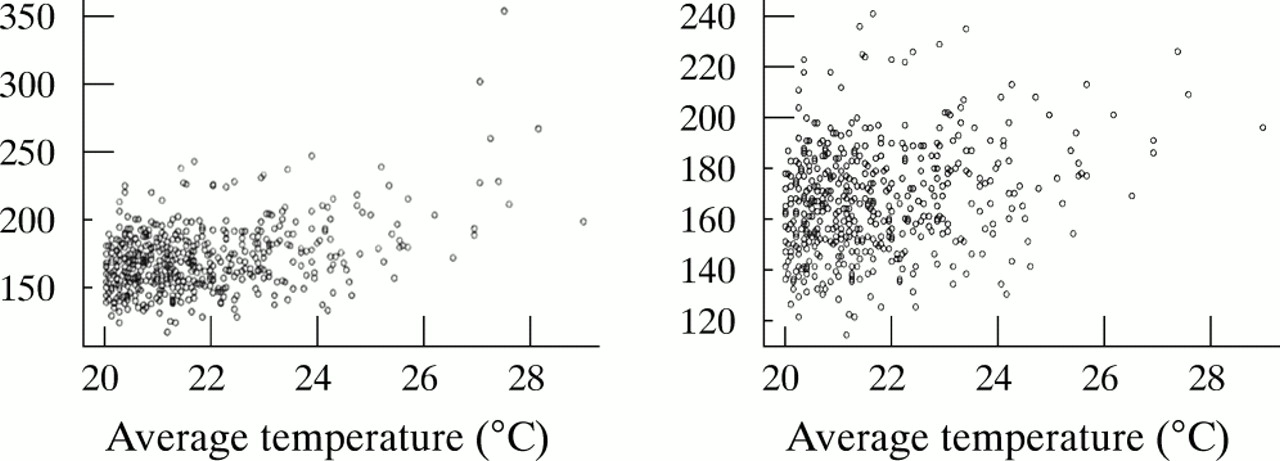
Table 1 shows the mean (SD), minimum, maximum, and 10th and 90th centile values of the daily number of total deaths and temperature variables in London between 1976 and 1996 inclusive. The maximum daily death count of 467 occurred during a serious influenza epidemic (unrelated to heat) in February 1976. Figure 1 shows the time series of the total number of daily deaths and the daily average temperature in London between 1976 and 1996. As would be expected, there is a strong yearly seasonal pattern in the mortality series with most deaths occurring in the winter months of each year. Figure 2 shows a plot of mortality against average temperature, with a 5df smoothing spline overlaid to help reveal the basic relation. As would be expected, the number of deaths are at their lowest at moderate temperatures, with an increase in deaths as the temperature drops but also when the temperature is extremely high. The cluster of high mortality values within the 0–10°C temperature range are attributable to influenza epidemics. The increase in deaths at high temperatures seems to begin at around a value of 19°C. There is a suggestion that the relation above this value is a linear one except for the very extreme temperature range where the mortality numbers seem to rise quite steeply with a temperature increase. This was investigated further in figure 3; this shows the mortality-temperature relation for temperatures of 20°C or over. The plot on the left shows all data points, and the plot on the right has days from the well documented 1976 heatwave17,18 removed. This plot shows that when the observations from this 15 day period between 23 June 1976 to 7 July 1976 are removed, the remaining relation appears to be of linear form. The hottest days in our dataset were not exclusively from this 1976 heatwave (only two of the top five hottest days came from this period, with the hottest day occurring in 1990); and so it seems that there is a possible contribution during the 1976 heatwave of some factor other than average temperature.
Mean (SD), minimum, maximum and 10th and 90th centile values of the daily number of total deaths and temperature variables in London between 1976 and 1996

Time series of the total number of daily deaths and the daily average temperature in London between 1976 and 1996.

Plot of mortality against average temperature, with a 5df smoothing spline overlaid to help show the basic relation.

Mortality-temperature relation for temperatures of 20°C or over, for all days (left) and for days from the 1976 heatwave removed (right).
Regression analyses
The following analyses present results for the effect of hot days after adjustment for all possible confounders. When hot days were defined as those days where the three day moving average was above the 99th centile value of average temperature (23.3°C), we observed a 5.71% increase in deaths (95% CI 4.30% to 7.15%) for every one degree increase in average temperature above 23.3°C. As already mentioned, our dataset contained one heatwave that had particularly unusual effects on mortality. For this reason a separate linear term for this 1976 heatwave was fitted, with a resulting estimate of a 6.73% increase in deaths (95% CI 4.57% to 8.93%) for every one degree increase in average temperature during this period. The linear estimate for the reminder of the hot days identified by the 99th centile was 3.01% (95% CI 1.07% to 4.99%). Because of the difference in effect sizes, the 1976 heatwave was modelled separately in all models discussed below.
1 Variation in centile
Figure 4 shows the percentage change in the number of deaths associated with a one degree increase in average temperature on hot days. The estimates are based on hot days as derived from using various centiles of average temperature. The definition obtained from using the 99th centile of average temperature (a value of 23.3°C) identified only 39 hot days (excluding days from the 1976 heatwave); hence the confidence interval is rather wide. Even though the estimates become more precise with a decrease in percentile because of the increase in the number of days used in the definition of hot days, the effect sizes themselves remain very similar. A 97th centile approach (21.5°C) produced an effect estimate of a 3.34% increase in deaths (95% CI 2.47% to 4.23%) for every one degree increase in average temperature above 21.5°C. This centile identified 166 hot days, 128 of which were part of sustained hot periods of three days or longer. When the centile used was reduced to 95% (a value of 20.6°C) or the 90th centile (18.9°C) the effect size was little changed. Lower centiles were not investigated as the mortality-temperature relation (fig 2) suggested no effect below temperatures of 19°C.
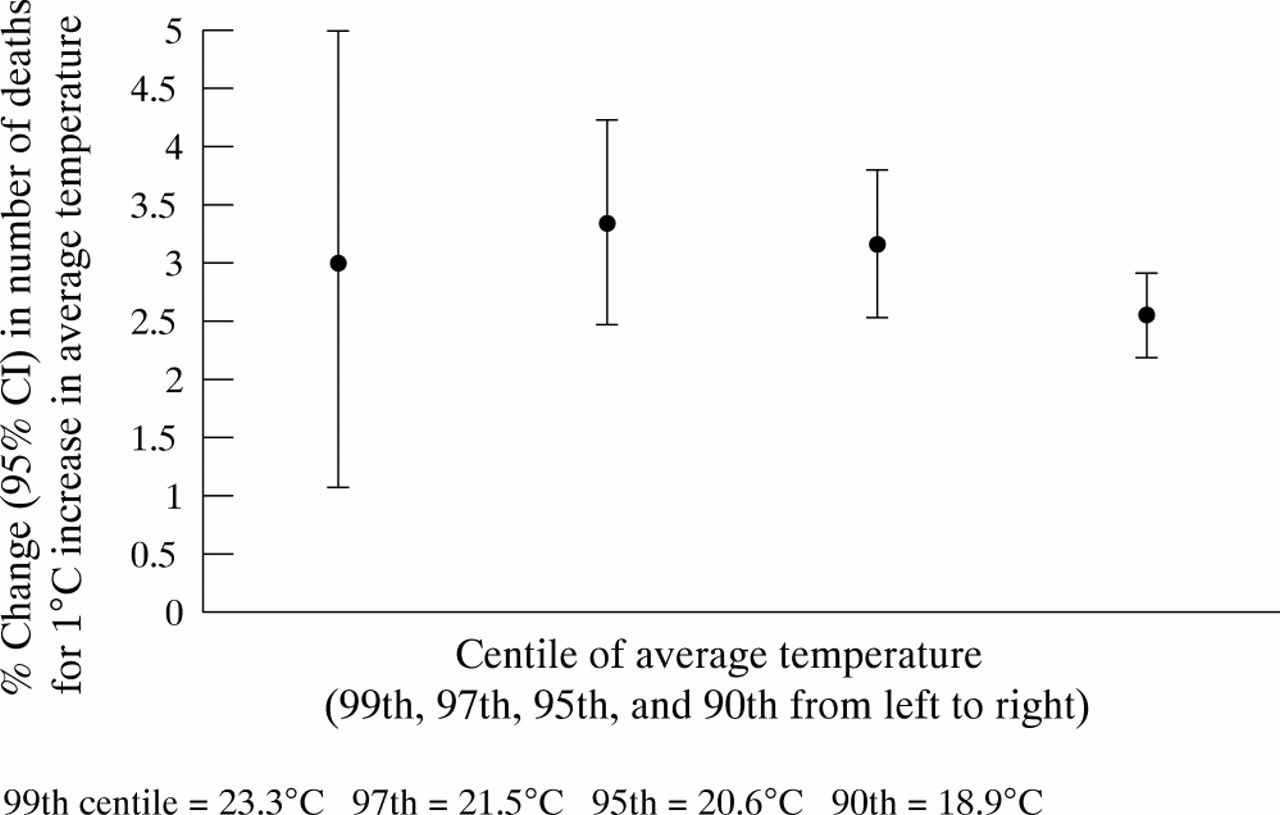
Percentage change in number of deaths associated with a one degree increase in average temperature on hot days as derived from using the 99th, 97th, 95th, and 90th centiles of average temperature (excluding 1976 heatwave).
2 Timing of hot days
Of the 166 hot days identified from the 97th centile, 142 of these were days in either July or August. The remainder were all from June, except for one day that fell in late May of 1989. When a separate term was fitted for just July/August hot days, and another for those from other months, the estimated increase in deaths associated with a one degree rise in July/August temperatures was similar to before, 3.26% (2.33 to 4.19); however, the increase associated with hot days from other months was much higher, 5.39% (2.19 to 8.69). This was the case despite the fact that the mean average temperature for the July/August hot days was higher than for the hot days from the other months (23.07°C and 22.48°C respectively).
3 Variation in lag
Figure 5 shows the percentage change in the number of deaths associated with a one degree increase in average temperature on the day of death (lag 0) and also 1, 2, and 3 days prior to death (lag 1, lag 2, and lag 3 respectively). The estimates are based on hot days as derived from using the 97th centile of average temperature. The figure shows that the percentage change in deaths diminishes with each increase in lag, with the estimate associated with high temperatures on a lag of three days not being statistically significant at the 5% level.

Percentage change in number of deaths associated with a one degree increase in average temperature on the day of death (lag 0) and also 1, 2, and 3 days prior to death (lag 1, lag 2, and lag 3 respectively).
4 Cause specific deaths
The effect of hot days was strongest for respiratory deaths, giving an increase of 5.46% (3.43 to 7.52). The effect in cardiovascular deaths was slightly less than for all causes, 3.01% (1.73 to 4.32). Estimates are based on the 97th centile of average temperature and for the same day as the day of death (lag 0).
5 Maximum and minimum temperature
When 97th centiles of maximum and minimum temperature were used instead of average temperature in the definition of hot days, the percentage change in deaths (95% CI) were 1.65% (0.89 to 2.42) and 2.75% (1.70 to 3.81) respectively. The estimates are based on temperature measures on a lag of 0.
6 Confounding by air pollution
When sulphur dioxide (SO2), ozone (O3), and black smoke were incorporated into the model the effect size of the 97th centile of average temperature was little changed, giving a 3.18% (2.14 to 4.24) increase in deaths per one degree change. The O3 effect was found to be significant, giving a modest increase in deaths of 0.81% (0.54 to 1.09) per 10 ppb increase in daily average measures of O3 using a lag of zero days. The effect of the 1976 heatwave was reduced slightly by the adjustment for O3 levels: 4.66% (2.50 to 6.87).
7 Investigation of individual hot day periods
Table 2 shows the individual hot day periods of five days or longer (“heatwaves”) identified using the definition of the 97th centile of average temperature (shorter day periods did not have enough statistical power). The number of days in each period, along with the mean average and maximum temperatures during this period, are given. The table also gives the estimated percentage change in the number of deaths (95% CI) associated with each heatwave based on a dummy term for each of the periods when simultaneously fitted into the model. The estimate obtained for the 1976 heatwave is also given, although the term has been fitted as a dummy variable rather than in linear form as before to permit comparison with the other heatwave periods. The table shows that 10 other “heatwaves” were identified, including a 15 day period in July of 1983. This period, along with one in 1989, one in early August 1990, and another in 1995 were all associated with significant increases in the number of deaths. The early August 1990 heatwave was associated with the largest rise in the number of deaths bar the 1976 heatwave: on average a 16.82% increase in deaths (95% CI 9.16% to 25.01%) on days in this period compared to other days in the dataset. Four other heatwave periods also suggested an increase in risk, although all confidence intervals were wide because of the small number of days involved. In general, the biggest effects were observed in those episodes of longest duration or where temperatures were at their highest. Two heatwaves were negatively associated with mortality, although neither of these were significant at the 5% level.
Date, duration, mean average and maximum temperature, and estimated change in number of deaths (95% CI) for individual hot day periods of five days or longer (“heatwaves”)
DISCUSSION
The results presented in this paper suggest a value of average temperature above which point heat related deaths occur. This value is estimated to be about 19°C for London and the relation between temperature and mortality above this value is linear. In addition, an effect of prolonged periods of high temperature (heatwaves) on mortality was observed.
The modelling of the time series data in this study was undertaken following an accepted methodology and checked to ensure that the model fit was satisfactory. Known confounders were adjusted for in the “core” model, including a broad smooth for temperature to allow evaluation of effects of hot periods on death relative to the seasonal “norm” predicted from the model.
This study adopted a percentile approach to identify hot days; although the effect of each degree Celsius increase on deaths was little changed between the 90th, 95th, 97th, and 99th centile values of average temperature, suggesting a linear relation. In London, the effect size for temperatures above the 97th centile value of 21.5°C resulted in an increase in deaths of 3.34% (95% CI 2.47% to 4.23%) for every one degree increase in average temperature above 21.5°C. When the 15 days during the 1976 heatwave were also included in the 97th centile definition of hot days, this estimate rose to 4.69% (3.93 to 5.45), thus suggesting the possible contribution during that particular heatwave of some other factor other than average temperature. This factor is reported to have been ozone, which was at historically high levels at that time19; however, our results suggested that ozone levels, although being a modest independent predictor of death, were not responsible for the large increases in mortality observed during the 1976 heatwave.
Key points
-
Heat related deaths in London may begin at comparatively low temperatures.
-
Heat episodes of long duration and of highest temperature have the largest mortality effect.
-
The 1976 heatwave resulted in a particularly large number of deaths in comparison with other hot periods.
Our approach of defining hot days as those days when a three day moving average of temperature was above the percentile value seemed to adequately identify periods of sustained high temperatures rather than singling out individual days. A consideration of only those days that are hotter than some designated cut off value identifies hot days rather than days for which the temperature is unusually hot for that time of year. It could be argued that “heatwaves” occurring at times other than summer may have just as strong a health impact, and so a seasonal adjustment to our percentile approach would highlight this. A separation of our identified hot days into those occurring in either July or August and those occurring at other times of the year (mainly June) indicated that it was the June hot days that produced a larger effect estimate despite June being a cooler month than either July or August. Because of the small numbers involved, there is a great deal of overlap between the respective confidence intervals, and so it is unclear how much emphasis can be placed on the difference in effect size. The suggestion however that early hot periods in any year may have a greater health impact than hotter periods later on in the year could possibly be attributable to the population in question having no opportunity to acclimatise; or alternatively could be a demonstration of the harvesting phenomenon (the “bringing forward” of deaths of susceptibles, followed by a subsequent drop in mortality).17
It was found that there was a decrease in the effect size with each increase in lag between daily mortality and high temperatures, up to a lag of three days. This suggests that the effect of summertime heat is immediate rather than having a more prolonged effect. As figure 2 suggests, a rise in mortality is also observed at extreme cold temperatures. Although the focus of this paper is the effect of hot temperatures, it is known that many cold related deaths occur and that the effect is more prolonged than for heat related deaths.10 Heat may affect different medical conditions in different ways. This paper concentrates on all cause mortality; however, cause specific deaths were also considered, with the largest effect being observed with respiratory causes. No distinction was made by either sex or age. The majority of heat related deaths occur in the elderly10 and so the effect estimates would probably increase if the elderly were considered as a separate age group.
Average temperature was used in determining the health effects of heatwaves. This is because it is probably the most realistic reflection of the amount of thermal exposure experienced throughout each whole day and night. It has been suggested that high night time temperatures may be just as culpable as high daytime temperatures in causing heat related deaths as there is no “cooling down” period. Our results suggested a larger effect of minimum temperature compared with maximum, and a much larger effect of average temperature compared to either maximum or minimum temperatures.
As life expectancy in this country has increased, the proportion of susceptibles is now greater, so the effect of heatwaves may have increased over time; conversely, as the frequency of heatwaves increases, there may be some degree of population adaptability both physiologically and in terms of behaviour, so the effect may have decreased. Investigation of individual heatwave periods in our results did not suggest any temporal trend in the effect size on deaths between 1976 and 1996 in London, however such a trend may perhaps only become apparent in much longer time series. For this dataset, 10 “heatwaves” were identified aside from the 1976 heatwave. Three of the years each contained two heatwaves, with the effect of the first each time being larger than that of the second. In the case of 1995, there was a negative association with temperature in the episode of late August; however, this period was preceded by another heatwave about two weeks before and so the negative association could perhaps be explained in this case by harvesting again.
In general, the largest increases in deaths occurred during prolonged periods of heat, suggesting that duration of exposure is an important public health issue. One exception to this was the heatwave in early August 1990 where, aside from the 1976 heatwave, the largest increase in the number of deaths was observed. This period was only six days long, however the mean average temperature during this time (25.14°C) was higher than for any of the other identified heatwaves, and the mean maximum temperature was 30.52°C, much higher than for the other periods except the 1976 heatwave. The excess of deaths during the 1976 heatwave was estimated to be almost twice as high as at any other identified period. For our analysis, a linear term was graphically deemed most appropriate for this 1976 heatwave in the majority of our models. The exception to this was the model comparing different heatwave periods; here a simple dummy term was used to permit valid comparison with the other heatwave periods. Dummy terms were used for all heatwaves here as the small number of days making up some of these periods made the functional form unclear.
As a result of climate change there is likely to be a substantial increase in the frequency of extremely high temperatures. For example, a rise in temperature of 1.6°C in the summer in mean temperatures in central England is expected to occur by about the year 2050. This is predicted to result in an increase in hot summers like that experienced in 1995 from once every 75 years based on the temperature distribution for 1961–1990 to about every three years on average.20 There have been suggestions that Weather Watch warning systems, which alert vulnerable populations to impending “heatwaves”, may prevent deaths in urban centres which, because of the heat island effect, are particularly likely to experience the adverse effects of heat.21 Our results suggest that the trigger for activating such a system in London should be a predicted temperature of 21.5°C, or possibly even earlier at 19°C when some heat effect was observed. Whether or not such systems are cost effective requires evaluation. Our results also suggest that the timing of hot periods in any year may be an important consideration. In addition, analysis of separate heatwave periods suggest that episodes of long duration and of highest temperature have the largest health effect.
Acknowledgments
We would like to thank Kristie Ebi of Electric Power Research Institute, US for her helpful comments. Funding: this work was supported by the Electric Power Research Institute, US, contact number WO8246-03. Conflicts of interest: none.
Funding: this work was supported by the Electric Power Research Institute, US, contract number WO8246–03.
Conflicts of interest: none.
REFERENCES
Linked Articles
- In this issue