The burden of air pollution on years of life lost in Beijing, China, 2004-08: retrospective regression analysis of daily deaths
BMJ 2013; 347 doi: https://doi.org/10.1136/bmj.f7139 (Published 09 December 2013) Cite this as: BMJ 2013;347:f7139
- Yuming Guo, research fellow1,
- Shanshan Li, PhD candidate1,
- Zhaoxing Tian, doctor of emergency medicine2,
- Xiaochuan Pan, professor of environmental health3,
- Jinliang Zhang, professor of environmental health4,
- Gail Williams, professor of international health and statistics1
- 1Department of Epidemiology and Biostatistics, School of Population Health, University of Queensland, Brisbane, QLD 4006, Australia
- 2Emergency Department of Peking University Third Hospital, Beijing 100191, China
- 3Department of Occupational and Environmental Health, Peking University School of Public Health, Beijing, China
- 4State Key Laboratory of Environmental Criteria and Risk Assessment, Environmental Standards Institute, Chinese Research Academy of Environmental Sciences, Beijing, China
- Correspondence to: Y Guo y.guo1{at}uq.edu.au, Z Tian tjtzx{at}126.com
- Accepted 14 November 2013
Abstract
Objectives To better understand the burden of air pollution on deaths, we examined the effects of air pollutants on years of life lost (YLL) in Beijing, China.
Design Retrospective regression analysis using daily time series.
Setting 8 urban districts in Beijing, China.
Participants 80 515 deaths (48 802 male, 31 713 female) recorded by the Beijing death classification system during 2004-08.
Main outcome measures Associations between daily YLL and ambient air pollutants (particulate matter with aerodynamic diameter <2.5 µm (PM2.5), PM10, SO2, and NO2), after adjusting for long term trends, seasonality, day of the week, and weather conditions. We also examined mortality risk related to air pollutants.
Results Mean concentrations of daily PM2.5, PM10, SO2 and NO2 were 105.1 μg/m3, 144.6 μg/m3, 48.6 μg/m3, and 64.2 μg/m3, respectively. All air pollutants had significant effects on years of life lost when we used single pollutant models. An interquartile range (IQR) increase in PM2.5, PM10, SO2, and NO2 was related to YLL increases of 15.8, 15.8, 16.2, and 15.1 years, respectively. The effects of air pollutants on YLL appeared acutely and lasted for two days (lag 0-1); these effects associated with an IQR increase in PM2.5 were greater in women than men (11.1 (95% confidence interval 4.7 to 17.5) v 4.7 (−2.9 to 12.3) YLL) and in people aged up to 65 years than those older than 65 years (12.0 (2.9 to 21) v 3.8 (−0.9 to 8.6) YLL). The mortality risk associated with an IQR increase in PM2.5 was greater for people older than 65 years (2.5% (95% confidence interval 0.6% to 4.5%) increase of mortality) than those aged up to 65 years (0.7% (−0.8% to 2.2%)).
Conclusions YLL provides a complementary measure for examining the effect of air pollutants on mortality. Increased YLL are associated with increased air pollution. This study highlights the need to reduce air pollution in Beijing, China, to protect the health of the population.
Introduction
The effects of air pollution on human health have recently attracted increasing concern in China, in part due to the increasing number of days with very high levels of air pollution.1 2 In most Chinese cities, concentrations of PM2.5 (particulate matter with aerodynamic diameter <2.5 µm) are still far above the level recommended by the World Health Organization’s guidelines on air quality (interim target 2 level) of 10 μg/m3 (annual average) and 25 μg/m3 (24 h average).3 For example, in 2004-08, mean daily PM2.5 concentration was 105 μg/m3 in Beijing. Beijing is experiencing increasing population density, car use, and expanded construction. It is surrounded by a heavy industrial region, which provides additional sources of air pollutants carried via air flow. Consequently, the ambient pollutant mixture is complex, with the potential for combined toxic effects from many constituents.
Reliable estimation of the burden of air pollution on health is essential to support evidence based government policy in this important public health area.4 5 Previous studies have examined the effects of air pollution on daily excess deaths or mortality risks using time series methods.6 7 Those studies focused on the number of deaths, but did not account for age at death, apart from broad age stratification. We argue that using the number of years of life lost (YLL) provides a complementary indicator to that of excess deaths, because it takes into account the life expectancy at death.8
Methods
Data collection
YLL data
This study was conducted in eight districts within the urban area of Beijing. Mortality data on non-accidental causes were obtained from the death classification system at the Beijing Public Security Bureau, between 1 January 2004 and 31 December 2008. These data comprised date of death, sex, and age. All deaths were registered residents of urban areas of Beijing city.
Chinese national life tables were obtained from WHO for the years 2000 and 2009 (web table S1).9 Life expectancies for 2004-08 were averaged from the years 2000 and 2009, as data were unavailable for 2004-08.
We calculated YLL for each death by matching age and sex to the life tables. Daily YLL were calculated by summing the YLL for all deaths on that day. We stratified the sums by sex and age group (≤65 and >65 years). The web appendix shows an example of this calculation.
Data on air pollution and weather conditions
PM2.5 was monitored at the main campus of Peking University, located in the urban centre.10 11 Details of the monitoring station are described elsewhere.12 The monitoring station is a few hundred metres away from major roads and about 20 m above ground level. The campus is primarily residential and commercial without industrial sources or agricultural activities. Spatial variability of PM2.5 mass and chemical composition is low across the urban area of Beijing (difference <10%). Additionally, average particle number and size distributions at this monitoring site and another regional site (50 km south of Peking University) were similar in the summer.13 Therefore, the monitoring site provided reliable estimates of pollutant levels for the urban area.12 We computed the daily average concentration from 24 h values.
We obtained daily data on particulate matter less than 10 μm in aerodynamic diameter (PM10), sulphur dioxide (SO2), and nitrogen dioxide (NO2) from the Beijing municipal environmental monitoring centre, which had eight fixed monitoring sites distributed in different part of the urban area.14 For each monitoring site, we calculated 24 h mean concentrations from non-missing data if at least 18 of 24 hourly concentrations of PM10, SO2, and NO2 were available.15 The daily mean concentrations of each air pollutant were calculated by averaging daily data over all monitoring sites.
We obtained meteorological data on daily mean temperature, relative humidity, and air pressure from the China meteorological system’s data sharing service. The monitoring station is located at Daxing district in southeast Beijing.
Data analysis
The daily YLL follows a normal distribution (web fig S1). We used daily YLL as dependent variable in a five year time series model, to examine its association with air pollutants. To control for long term trend and seasonality, we used a natural cubic spline with seven degrees of freedom per year for time. The day of week was controlled for as a categorical variable. To most effectively control for the potential effects of weather conditions on mortality, we used distributed lag non-linear models for temperature, relative humidity, and air pressure. A natural cubic spline with five degrees of freedom was used for temperature, relative humidity, and air pressure, and a natural cubic spline with four degrees of freedom for lag days (≤27 days). We used previous experience of similar analyses in selecting the above parameters.16 We validated the model fit by checking the residuals to ensure that seasonality and autocorrelation had been successfully removed.
Studies have shown that models of single day lags might underestimate the effect of air pollution on mortality,17 thus we used a moving average concentration over two days (lag 0-1) for our main analyses.18 We also examined the associations using a single day lag (from lag 0 to lag 3). For each pollutant, we fitted models of single pollutants and multiple pollutants models to assess the stability of the associations. In addition, we stratified analyses by sex and age (≤65 years and >65 years).
To examine the linearity of the associations between air pollutants and YLL, we used a natural cubic spline with four degrees of freedom for each air pollutant (lag 0-1 day) in single pollutant models. If the relations tended to be linear, we used a linear function; if not, we used a non-linear function with a natural cubic spline for air pollutants.
To compare the standard analysis of mortality and the analysis of YLL, we estimated the percentage change in daily mortality associated with changes in air pollutants. We used the same independent variables as the YLL model, but with daily count of deaths as the dependent variable following a Poisson distribution.
To check the adequacy of all models, we used an autocorrelation function to examine if the residuals were independent over time. R software was used to conduct statistical analyses.19 The dlnm package was used to perform distributed lag non-linear models.20 21
Results
The mean concentrations of daily PM2.5, PM10, SO2, and NO2 were 105.1 μg/m3, 144.6 μg/m3, 48.6 μg/m3, and 64.2 μg/m3, respectively (table 1⇓). Generally, PM2.5 and PM10 had positive correlations with all other pollutants and weather conditions, while mean temperature was negatively correlated with SO2 and NO2 (table 2⇓).
Levels of daily air pollutants, mean temperature, relative humidity, mean air pressure, and YLL in Beijing, China, 2004-08
Spearman correlation between air pollutants and weather conditions in Beijing, China, during 2004–08
YLL was higher for men than women, and higher for people aged up to 65 years than those older than 65 years. Daily death counts were higher for people older than 65 years than those aged up to 65 years (table 1). Both YLL and death counts had a seasonal trend (fig 1⇓). They were higher in the cold months (January, February, November, and December) than the hot months (May, June, July, August, and September).
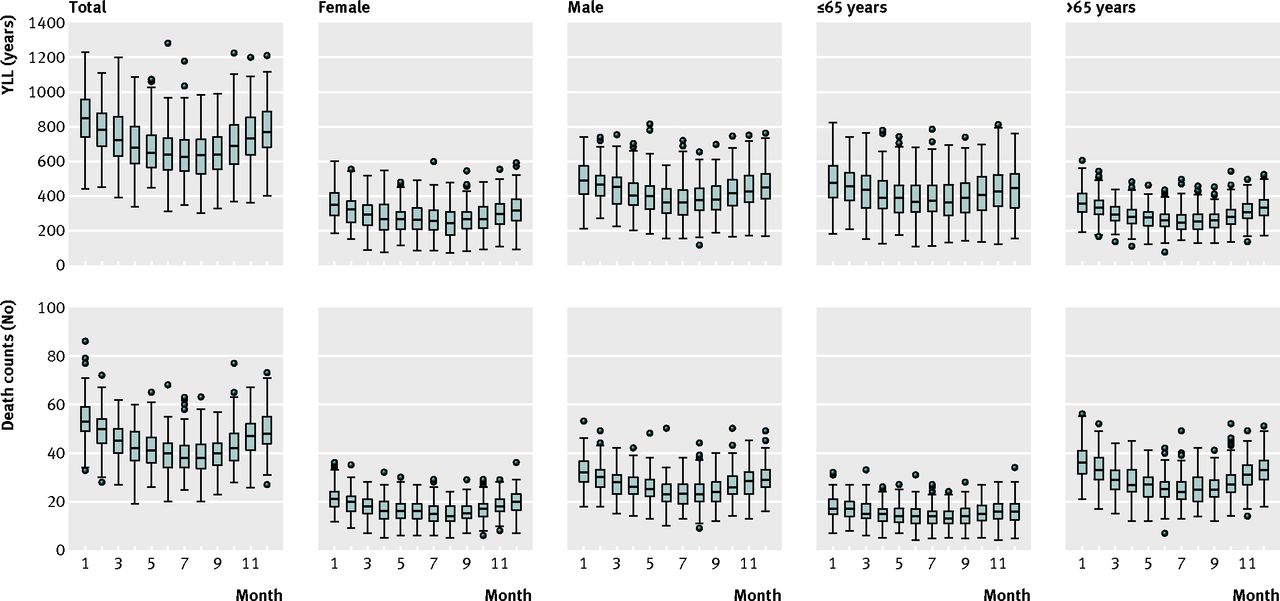
Fig 1 Boxplots of monthly YLL and death counts in Beijing, China, during 2004-08, according to sex and age
The air pollutant-YLL associations tended to be linear (fig 2⇓); therefore, we subsequently used a linear function for air pollutants. The lag pattern was similar for YLL and mortality risk (fig 3⇓). The effects of air pollutants appeared acutely and lasted for two days. Similar lag patterns were examined for women, men, people aged up to 65 years and those older than 65 years (web figs S3-S6). Therefore, use of a two day moving average of air pollutants was sufficient to capture the short term effects of air pollutants on YLL and mortality risk.

Fig 2 Association between air pollutants (lag 0-1 day) and YLL in Beijing China, during 2004-08. A natural cubic spline with four degrees of freedom for air pollutants was included in the single pollutant models, while controlling for seasonality, day of the week, temperature, relative humidity, and air pressure

Fig 3 Association between increased interquartile range in air pollutants and YLL (top) and percentage increase of deaths (bottom) for non-accidental deaths using single pollutant models at different lag days, during 2004-08. Results were controlled for seasonality, day of the week, temperature, relative humidity, and air pressure. Interquartile ranges were 94 μg/m3 for PM2.5, 106 μg/m3 for PM10, 49 μg/m3 for SO2, and 30 μg/m3 for NO2
For both YLL and mortality risk, single pollutant models produced the highest effect estimates (table 3⇓). For single pollutant models, an interquartile range increase in PM2.5 (94 μg/m3), PM10 (106 μg/m3), SO2 (49 μg/m3) and NO2 (30 μg/m3) was related to YLL increases of 15.8, 15.8, 16.2, and 15.1 years, respectively.
Association between interquartile range increase in air pollutants (lag 0-1 day) and YLL and increase in deaths for non-accidental deaths using single, two, and three pollutant models during 2004-08
The air pollutants-YLL associations differed by sex and age group (table 4⇓). Effect estimates of PM2.5 and PM10 on YLL were higher in women than men, with the opposite for SO2 and NO2. The effect estimates of air pollutants on YLL among people aged up to 65 years were significant and about twice those of people older than 65 years, although mortality risk was higher for older people than for those aged 65 years or younger.
Association between interquartile range increase in air pollutants (lag 0-1 day) and YLL and increase in deaths for non-accidental deaths using single pollutant models during 2004-08, according to sex and age
To check the robustness of our models, we performed several sensitivity analyses for associations between air pollution and YLL. All sensitivity analyses confirmed our approaches are valid (web appendix).
Discussion
Principal findings
All air pollutants had significant effects on YLL when using single pollutant models, but the effect estimates decreased when multiple pollutants were included in the models. Effects appeared acutely and lasted for two days (lag 0-1). The effects of air pollutants on YLL were higher in people aged up to 65 years than those older than 65 years, whereas these results were opposite for death counts.
Interpreting the findings
One crucial finding was that the estimated effects of air pollution were greater on the younger group of people than older group for YLL. The potential reason is that the measurement of YLL takes into account those conditions afflicting young people or children. Giving the same weight to deaths occurring at different ages could distort policy priorities and resource allocation.22 Most studies report that mortality risks related to air pollution are greater for older people than younger people.23 24 Our study suggests that focusing on death counts only could underestimate the burden of air pollution on young people.
Many studies have reported that the effects of air pollution on women are higher than men. Both biological and non-biological factors are associated with this difference. Women have smaller lungs and airway diameters. These might increase airway reactivity and exacerbate particulate deposition.25 Women and men have different socioeconomic status and stress experiences.26 27 Women also tend to spend more time outside because they are less likely to get full time jobs.28
Our results show that the harvesting effects existed only in older people and women for both YLL and mortality risk. Previous studies have confirmed this pattern.29 30 The public health significance of air pollution becomes smaller, if there is mortality displacement. However, we did not find harvesting effects in men or younger people.
All pollutants have considerable effects on YLL and mortality risk in Bejing, which implies that stricter standards should be in place for all air pollutants. When we used the two or three pollutant models, effects of air pollutants were reduced. These findings were consistent with previous studies,14 18 24 and may be caused by co-linearity between air pollutants, in turn caused by commonality of sources or photochemical interactions.
Meaning of the study
The findings strongly support the need for authorities to reduce air pollution in Beijing. Although the general population is increasingly concerning with air pollution, information is still limited. Real time data on PM2.5 have been available since 2012, after a public outcry about thick smog in China. Emergency response measures have been implemented on high smog days, including reducing industrial emissions, removing some government vehicles from the road, and halting outdoor activities for school children. The effective reduction in emissions during the 2008 Beijing Olympics demonstrates that it is possible to reduce air pollution in China.
Strengths and limitations of the study
Our study had some limitations. We used ambient pollutant concentrations as surrogates of individual exposure, which could result in measurement error. Because data were from only one city, it is difficult to generalise results to other cities. We did not control for smoking or for prevalence of chronic obstructive pulmonary disease related to smoking, because this information was unavailable. However, we assume that our results would have been little affected because the effects are short term and the time series method controls for long term and fixed term factors, such as smoking and obesity. The distribution of such fixed factors does not vary from day to day, and thus they are not associated with air pollution levels.31
This study also had some strengths. It examined the burden of air pollutants on YLL in China. Compared with mortality risk that weighs all deaths equally, YLL is a more informative indicator for quantifying premature deaths. Our findings are important in developing public policy, determining appropriate interventions to manage risk, and promoting capacity building for local responses to air pollution.
Conclusions
This study highlights the effects of exposure to air pollution on YLL and mortality risks in Beijing, China. Our findings support the need to reduce the high levels of air pollution in Beijing, China. YLL can be used as a complementary indicator for assessing the effect of air pollutants on mortality.
What is already known on this topic
Air pollution increases the risk of mortality, and is a serious problem in Beijing, China
However, no study has examined the burden of air pollution in terms of years of life lost, which combines the counts of deaths with life expectancy
What this study adds
Between 2004 and 2008, all air pollutants (PM2.5, PM10, SO2, and NO2) had significant effects on years of life lost in Beijing; the effects of air pollutants on years of life lost appeared acutely and only lasted for two days (lag 0-1)
People aged up to 65 years were more affected by air pollutants than those older than 65 years for years of life lost, while the mortality risk was higher for those older than 65 years than those aged up to 65 years
Years of life lost is more informative for quantifying premature deaths than mortality risk, which weighs all deaths equally
Notes
Cite this as: BMJ 2013;347:f7139
Footnotes
We thank the Beijing Municipal Environmental Monitoring Centre for providing air pollution data (PM10, SO2, and NO2), China Meteorological Data Sharing Service System for providing meteorology data, and Beijing Public Security Bureau for providing mortality data
Contributors: YG and GW were involved in the design of the study. YG, SL, ZT, and XP prepared and cleaned the data. YG did the statistical analysis and wrote the first draft. SL, ZT, XP, JZ, and GW helped revise the paper. YG and GW are the guarantors for the study. YG, ZT, and XP had full access to all of the data in the study and take responsibility for the integrity of the data and the accuracy of the data analysis.
Funding: This study is funded by the National Natural Science Foundation of China (#81172745), and the Australia National Health and Medical Research Council (#APP1030259).
Competing interests: All authors have completed the ICMJE uniform disclosure form at www.icmje.org/coi_disclosure.pdf and declare: support from the National Natural Science Foundation of China and the Australia National Health and Medical Research Council for the submitted work; YG is supported by the Centre for Air Quality and Health Research and Evaluation and the University of Queensland School of Population Health; no other relationships or activities that could appear to have influenced the submitted work.
Ethical approval: This study was approved by the University of Queensland’s behaviour and social sciences ethical review committee (2013000739).
Data sharing: Data on life expectancy and an example dataset showing how to calculate years of life lost are available in the web appendix. Statistical codes are available from the corresponding author at y.guo1{at}uq.edu.au.
The lead authors affirm that the manuscript is an honest, accurate, and transparent account of the study being reported; that no important aspects of the study have been omitted; and that any discrepancies from the study as planned (and, if relevant, registered) have been explained.
This is an Open Access article distributed in accordance with the Creative Commons Attribution Non Commercial (CC BY-NC 3.0) license, which permits others to distribute, remix, adapt, build upon this work non-commercially, and license their derivative works on different terms, provided the original work is properly cited and the use is non-commercial. See: http://creativecommons.org/licenses/by-nc/3.0/.