Article Text

Abstract
Aims: To describe trends in total and live birth prevalence, regional differences in prevalence, and outcome of pregnancy of selected congenital anomalies.
Methods: Population based registry study of 839 521 births to mothers resident in five geographical areas of Britain during 1991–99. Main outcome measures were: total and live birth prevalence; pregnancy outcome; proportion of stillbirths due to congenital anomalies; and secular trends.
Results: The sample consisted of 10 844 congenital anomalies, giving a total prevalence of 129 per 10 000 registered births (95% CI 127 to 132). Live birth prevalence was 82.2 per 10 000 births (95% CI 80.3 to 84.2) and declined significantly with time. The proportion of all stillbirths with a congenital anomaly was 10.5% (453 stillbirths). The proportion of pregnancies resulting in a termination increased from 27% (289 cases) in 1991 to 34.7% (384 cases) in 1999, whereas the proportion of live births declined from 68.2% (730 cases) to 58.5% (648 cases). Although similar rates of congenital anomaly groups were notified to the registers, variation in rates by register was present. There was a secular decline in the total prevalence of non-chromosomal and an increase in chromosomal anomalies.
Conclusions: Regional variation exists in the prevalence of specific congenital anomalies. For some anomalies this can be partially explained by ascertainment variation. For others (neural tube defects, diaphragmatic hernia, gastroschisis), higher prevalence rates in the northern regions (Glasgow and Northern) were true differences. Live birth prevalence declined over the study due to an increase in terminations of pregnancy.
- ascertainment
- congenital anomalies
- prevalence
- regional variation
- stillbirth rate
Statistics from Altmetric.com
Congenital anomalies are a significant cause of stillbirth and infant mortality, and are important contributors to childhood morbidity. The aetiology of most congenital anomalies is not fully understood. However, some factors are well known and these form the basis of specific preventive or screening interventions; for example, the strong association of Down’s syndrome with increasing maternal age,1 and the link between folic acid intake during the periconceptional period and neural tube defects.2 The availability of antenatal screening has implications for collecting information about congenital anomalies; cases resulting in termination of pregnancy must be recorded as well as those resulting in births, if prevalence rates are to be meaningful.
The aim of this study was to describe the prevalence of specified congenital anomalies within five well defined geographical areas of Britain, using data from high quality congenital anomaly registers.
METHODS
Study population
Data from five British registers were used: (1) Greater Glasgow EUROCAT Register; started 1979; covers 12 000 births annually in Glasgow; (2) Northern Congenital Abnormality Survey; started 1985; covers 30 000 births annually in the Northern health region; (3) North Thames West (NTW) EUROCAT Congenital Malformation Register; started 1991; covers 45 000 births annually in North West London and surrounds; (4) Wessex Antenatally Diagnosed Congenital Anomalies Register; started 1994; covers 25 000 births annually in Wessex; (5) Oxford Congenital Malformation Register; started 1991; covers 6000 births annually in Oxford.
The study period was set from 1991 to 1999. However, for Glasgow, case ascertainment in 1998 and 1999 was not complete at the start of the project, so these years are excluded; the Wessex register was only established in 1994. This study forms part of a larger project investigating the geographical variation in the distribution of congenital anomalies.3
Two registers (Glasgow and Northern) are entirely population based with registration dependent on mother’s residence within the boundaries of these regions, even if they were delivered outside the region. The registries of NTW, Wessex, and Oxford cover all deliveries in all hospitals within a geographically defined region. Residents near the edges of the regions may deliver outside the region and therefore not be covered by the registries. In order to define a population based area, the percentage of all births in each ward delivered in a hospital covered by the register was calculated based on birth data from the Office for National Statistics (ONS) which records hospital of delivery. Only those wards where 80% or more births were delivered in a hospital within the registry were included (1625 of 2062 wards; 78.8%), giving a final coverage across the entire five region study area of 94%. A further 60 wards in South Cumbria were excluded as they ceased to be part of the Northern Region in 1994.
Denominator data were obtained from ONS for England giving the number of live births and stillbirths for enumeration districts (EDs) and wards in each region. Denominator data for Glasgow were obtained from the Information & Statistics Division of the Common Services Agency of the NHS Scotland. After exclusion of wards with less than 80% coverage (n = 377), the number of births per ward was adjusted by the percentage coverage of each ward (that is, the percentage of births in those wards delivering in register hospitals) and by the percentage postcoding of register cases. The final study population was 839 521 births.
Case definition, classification, and ascertainment
Each register records information on all congenital anomalies occurring in late miscarriages (fetal deaths of ⩾20 weeks gestation), terminations of pregnancy after prenatal diagnosis, stillbirths (fetal deaths ⩾28 weeks gestation until 1992 after which the stillbirth definition was changed to fetal deaths ⩾24 weeks gestation), and live births. Cases are notified through multiple sources to ensure high case ascertainment. All the registers can record at least five congenital anomalies per case. Further details of data collection for each register have been published previously.4–7 All five registers are members of the British Isles Network of Congenital Anomaly Registers (BINOCAR),8 and the EUROCAT: European Surveillance of Congenital Anomalies.9,10
A congenital anomalies inclusion list was prepared and comprised well defined subgroups of major congenital anomalies. We excluded minor anomalies, anomalies which are variably recorded (for example, ventricular septal defects), or only recorded by one register (hypospadias), tumours and neoplasms, metabolic anomalies, and deformations (for example, isolated talipes).
A list of all cases with two or more anomalies or a syndrome was reviewed by the project’s medical geneticists (PB, DW) and classified as described previously.11 Familial cases and cases with a known teratogen (T) were excluded from further analysis. Chromosomal syndromes, other syndromes, and new dominants were analysed as separate categories.11 The remaining cases comprised the “non-chromosomal” category. Cases classified as “isolated” were assigned to their primary anomaly subgroup only. Cases classified as multiply malformed were assigned to all of their component anomaly subgroups, as well as the subgroup “multiple anomalies”.
Anomalies were coded in ICD-9 or ICD-10, and assigned to congenital anomaly subgroups compatible with EUROCAT subgroups.12 Since a case can have more than one anomaly subgroup, numbers across subgroups cannot be added to calculate the total number of cases. All analyses are based on the number of cases in the anomaly category of interest, not the number of anomalies.
Data processing, validation, and exclusions
Cases without a valid postcode were excluded. Generally the proportion with valid postcodes was very high (97.7%), with Wessex having the highest proportion of non-postcoded cases (11.4%).
Statistical analysis
Cases were grouped by the date of delivery or termination. Confidence intervals were calculated using the Confidence Interval Analysis package.13 The χ2 test for trend was used to compare differences in prevalence over time.
RESULTS
A total of 10 844 cases, as defined by our inclusion list, were retained for analysis. Sex was recorded in 97.4% of cases; 5669 (53.7%) were male and 4891 (46.3%) female giving an m:f ratio of 1.2:1.
Total and live birth prevalence of selected anomalies
Table 1 shows the total number of congenital anomalies notified, the overall total, and live birth prevalence by register. There were 839 521 registered births giving a total prevalence of 129 (95% CI 127 to 132) per 10 000 births. The total prevalence remained stable over time; 123 per 10 000 (1070 cases) births in 1991 and 129 (1108 cases) in 1999 (χ2 test for trend = 0.4, p = 0.5). Total prevalence remained stable over the study period for all individual registers except Oxford, which showed a significant increase in total prevalence from 86.3 (95% CI 61.4 to 111) per 10 000 births in 1991 to 138 (95% CI 105 to 171) in 1999 (χ2 = 7.3, p < 0.007).
Total* and live birth† prevalence of selected congenital anomalies by register
There were 6868 live births with a congenital anomaly, giving an overall live birth prevalence of 82.2 (95% CI 80.3 to 84.2) per 10 000 live births. There was a significant decline in the live birth prevalence from 84.6 (95% CI 78.5 to 90.7) per 10 000 in 1991 to 75.5 (95% CI 69.7 to 81.3) in 1999 (χ2 = 15.8, p < 0.00007). Live birth prevalence in individual registers did not show a trend, except in the Northern region which experienced a significant decline from 102 (95% CI 91.8 to 112) per 10 000 live births in 1991 to 89.3 (95% CI 78.7 to 99.9) in 1999 (χ2 = 4.9, p < 0.03).
Outcome of pregnancies
Table 2 gives the outcome of pregnancy by register. Of the 10 833 cases with known pregnancy outcome, there were 141 (1.3%) miscarriages, 3371 (31.1%) terminations, 453 (4.2%) stillbirths, and 6868 (63.4%) live births. There was a significant increase in the proportion of pregnancies resulting in a termination from 27% (289 cases) in 1991 to 34.7% (384 cases) in 1999 (χ2 = 23.5, p < 0.0001). There was a significant decrease in the proportion of live births over the nine years from 68.2% (730 cases) in 1991 to 58.5% (648 cases) in 1999 (χ2 = 12.8, p < 0.001).
Outcome of pregnancy for all cases of selected congenital anomalies by register
Contribution of congenital anomalies to stillbirths
Table 3 summarises the number (%) of stillbirths with specified congenital anomalies. The proportion of all stillbirths with a congenital anomaly was 10.5% (453 stillbirths). A greater proportion of stillbirths had a non-chromosomal anomaly (255 stillbirths) than a chromosomal anomaly (n = 171). There was an increase in the proportion of stillbirths with a congenital anomaly, but this did not reach statistical significance (from 8.8% in 1991 to 14.4% in 1999; χ2 = 3.5, p = 0.06). The contribution of chromosomal anomalies to stillbirths rose from 2.9% in 1991 to 5.9% in 1999 (χ2 = 5.6, p < 0.02). The increase in the contribution of non-chromosomal anomalies from 5.3% in 1991 to 7.8% in 1999 was not significant (χ2 = 0.1, p = 0.7).
Numbers (%) of stillbirths with a specified grouped congenital anomaly, 1991–99
Types of congenital anomaly
Table 4 presents the number and prevalence of selected congenital anomalies notified to the registers by type. Non-chromosomal anomalies accounted for 65.8% of cases analysed and chromosomal anomalies 29.5%. Among the non-chromosomal cases, congenital heart disease anomalies were reported in 21.4% (2323), nervous system anomalies in 15.3% (1659), and internal urogenital system anomalies in 13.9% (1507).
Congenital anomaly subgroups by region, number, and prevalence per 10 000 registered births
Table 4 shows clear differences between registers in the total prevalence of certain congenital anomaly subtypes. A higher proportion of non-chromosomal anomalies were notified to the Glasgow and Northern registers. The Glasgow register had higher rates for malformations of cardiac septa, transposition of the great vessels, digestive system anomalies, ano-rectal atresia and stenosis, limb reduction defects, and diaphragmatic hernia, but lower rates of chromosomal anomalies. The Northern region had the highest rate for malformations of valves (18.3 per 10 000 births). Conversely, rates for isolated cleft palate were lowest in Wessex and Oxford. In Wessex, the low prevalence of cleft palate may have been due to the exclusion of cases with missing postcodes (see footnote to table 4).
Table 4 also presents the number of pregnancies resulting in a termination by congenital anomaly type. As expected, the majority of pregnancies with an anencephaly (89.4%) resulted in a termination. Termination rates were also high for spina bifida (73.8%), bilateral renal agenesis (67.6%), trisomy 13 (65.4%), trisomy 18 (65.8%), omphalocele (44.9%), and hypoplastic left heart (42.6%).
Secular trends in selected congenital anomalies
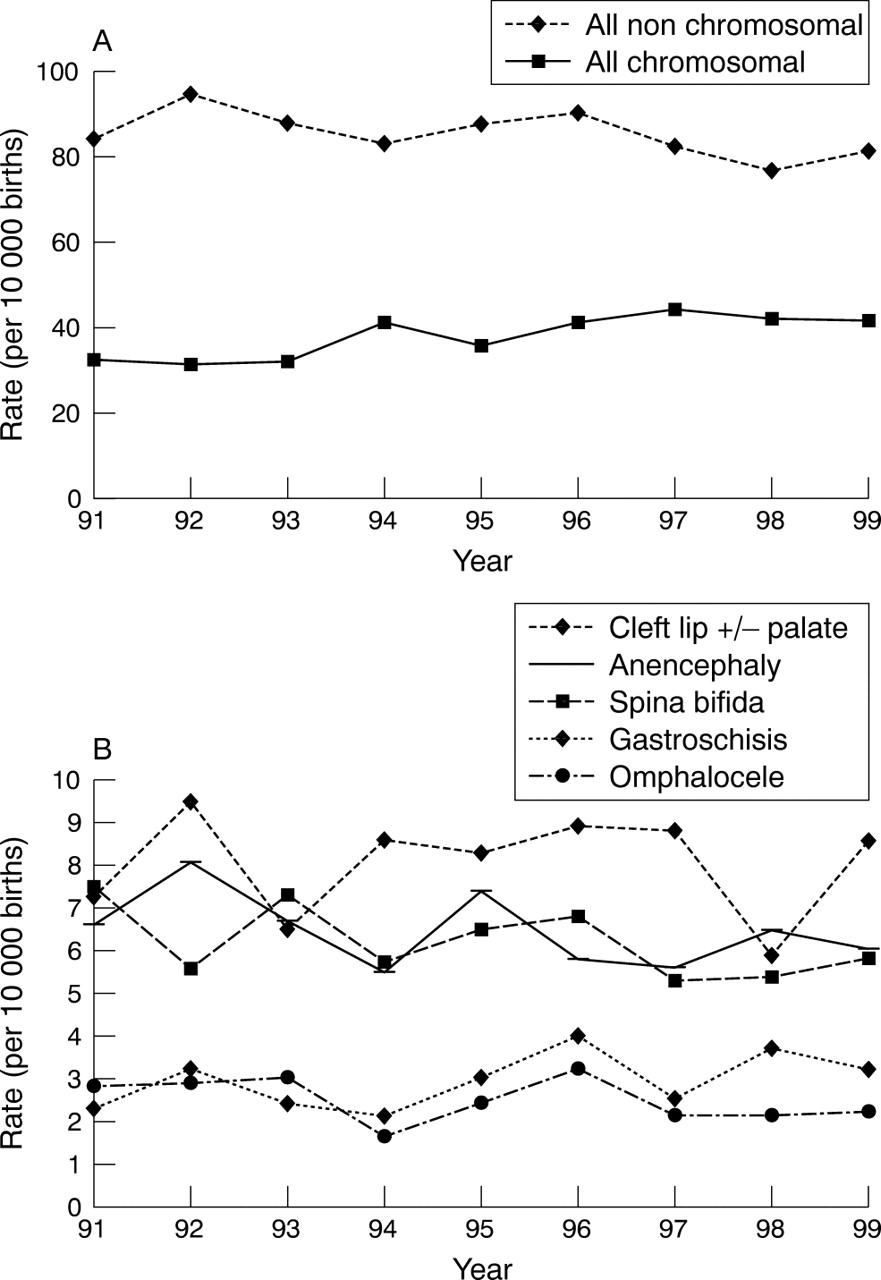
There was a significant reduction in the total prevalence of all non-chromosomal anomalies combined (fig 1A; χ2 = 7.8, p = 0.005) from 83.8 per 10 000 births in 1991 to 81.2 per 10 000 in 1999. There was a twofold significant increase in the total prevalence of all chromosomal anomalies combined (χ2 = 32.2, p < 0.00001) from 21.4 per 10 000 births in 1991 to 41.4 per 10 000 in 1999. The total prevalence for all neural tube defects declined form 15.6 per 10 000 births in 1991 to 12.9 per 10 000 in 1999 (χ2 = 5.5, p < 0.02). However, the reduction in total prevalence of anencephaly and spina bifida did not reach significance (fig 1B; anencephaly: χ2 = 1.8, p = 0.2; spina bifida: χ2 = 2.6, p = 0.1). During the study period there was a trend towards an increase in the total prevalence of gastroschisis and a decrease in the prevalence of omphalocele, but neither of these reached statistical significance (fig 1B; gastroschisis: χ2 = 2.9, p < 0.09; omphalocele: χ2 = 1.2, p < 0.3).

Secular change in (A) chromosomal and non-chromosomal anomalies, and (B) selected congenital anomalies, 1991–99.
DISCUSSION
Total and live birth prevalence
The congenital anomalies considered were well defined, major anomalies consistently notified and coded across the five registers. They do not include all congenital anomalies that occur within a population. It is therefore not possible to compare the total prevalence rate (129 per 10 000 births) with other published prevalence rates for all congenital anomalies combined. The five registers ascertain cases from multiple sources and have all conducted comparative exercises with other registries through EUROCAT and BINOCAR, confirming high levels of ascertainment. Despite overall total prevalence remaining stable over the study period, there was an increase in the prevalence of chromosomal anomalies and a decrease in non-chromosomal anomalies. The rise in total prevalence in Oxford may be ascertainment related. The three registers concentrating on antenatal diagnoses (NTW, Wessex, Oxford) acknowledge under-ascertainment of malformations diagnosed after the neonatal period, particularly congenital heart disease, as discussed further below.
Just over 10% of all stillbirths were attributable to a congenital anomaly, with a greater proportion resulting from a non-chromosomal anomaly. There was an increase in the proportion of stillbirths with a chromosomal anomaly over the study period, a finding which has been previously reported for the Northern Region.14 This increase may be partially explained by increased karyotyping following a miscarriage or termination.
Prenatal diagnosis and termination of pregnancy
Regions differ in the availability and accuracy of antenatal diagnostic technology over time, prenatal screening policy and methods, and possibly the uptake of termination of pregnancy as an option when an anomaly is diagnosed prenatally. NTW, Wessex, and Oxford reported a greater proportion of terminations (37–40% of all cases) and correspondingly lower live birth prevalence rates than Glasgow and the Northern Region. This difference may be exaggerated by the higher ascertainment of postnatally diagnosed cases in Glasgow and the Northern Region. During the 1990s, the proportion of terminations remained relatively stable in all regions except the Northern Region where it increased, with a corresponding decrease in live births. The proportion of late terminations varied between registries, highlighting that there is some variation in late termination (from 24 weeks gestation) practice.
The proportion of terminations was high for conditions known to be associated with a very poor outcome and high prenatal detection rates such anencephaly, spina bifida, and bilateral renal agenesis.
Total prevalence and secular trends of specific congenital anomaly subtypes
The selected anomalies were considered to be consistently diagnosed and recorded. However, there is still evidence of ascertainment variation between regions, as has been found by others,15 although it should be noted that some of the statistical differences may have resulted from chance.
The registers showed similar rates in cardiac defects which can be diagnosed antenatally, for example, transposition of the great arteries, hypoplastic left heart, and atrioventricular septal defect, but greater variation was seen across the registers for late postnatally diagnosed cardiac defects, for example, tetralogy of Fallot, malformations of valves. The higher rates of some cardiac defects reported by the Glasgow and Northern registers, especially the less life threatening anomalies, reflect the very close relation these registers have with paediatric cardiology departments, the ascertainment of postneonatal diagnoses, and possibly the expertise in these departments to accurately diagnose and notify defects whether diagnosed antenatally or postnatally.
Another source of ascertainment variation is the ascertainment of less severe forms of the selected anomalies. For example, differences in the prevalence of limb reduction defects, with a higher rate in Glasgow, may reflect differential ascertainment of (or registration of) less severe cases (for example, missing parts of fingers or toes). Coding differences can also underlie variation.
The registers have high case ascertainment for chromosomal anomalies as they undertake cross validation with cytogenetic laboratories. The total prevalence of autosomal trisomies (Down’s syndrome, trisomy 13, trisomy 18) is dependent on the maternal age structure of the population. The prevalence of chromosomal anomalies doubled over the study period, which may be partly explained by rising maternal age.10
However, the prevalence of diagnosed chromosome anomalies will also be affected by the proportion of pregnancies prenatally karyotyped. A proportion of pregnancies terminated because of a chromosome anomaly would have spontaneously aborted and never been diagnosed. Antenatal karyotyping can also detect chromosome anomalies which in many cases would otherwise go undetected throughout the individual’s life (47XXX, 47XYY) or might only be diagnosed later in life (Klinefelter syndrome (47XXY), Turner syndrome (45X)). The lower termination rate in Glasgow may reflect a lower rate of antenatal karyotyping. In addition, there may be some coding differences. For example, microdeletions are coded as chromosomal anomalies within the NTW register but not in the other registers, leading to a further difference in prevalence, although small.
Other examples of regional variation in prevalence cannot be readily explained as ascertainment variation or chance differences and may reflect true differences in prevalence. Glasgow has a particularly high prevalence rate of cleft palate (6.9 per 10 000 births).16 The Glasgow and Northern registers experienced a higher rate of diaphragmatic hernia, gastroschisis, and neural tube defects, as has been reported previously.17–22
There was a decline in non-chromosomal anomalies combined over the study period. It is not clear whether this is a true decline or resulting from differences in notification period. The Glasgow register contributed data until 1997, while the Wessex register only provided data from 1994. As a group, the total prevalence of neural tube defects significantly declined during the nine years, but this was not the case for anencephaly and spina bifida. Whether this decline can be attributed to the national policy recommending periconceptional folic acid supplementation,2 would need further investigation.
Likewise, there were secular trends in the prevalence of gastroschisis and omphalocele, but these did not reach significance. A rise in the prevalence of gastroschisis, without a corresponding increase in omphalocele, has been reported by a number of authors.17,18,23 A geographical gradient in the prevalence of gastroschisis has been reported24 and there was a significant difference in reported prevalence between the registers, with higher rates in the registers in the north of Britain (Glasgow, Northern), further suggesting a geographical gradient.
It is not possible to determine how much of the range in prevalence between registers (from 110 per 10 000 to 140 per 10 000) is due to true differences in prevalence, and how much is due to ascertainment differences. This range is however quite narrow when compared to the range of prevalence that generally results when comparing the total prevalence of all congenital anomalies reported to registers.10 It is important to understand that differences in prevalence, even of a selected list of congenital anomalies, can easily occur due to ascertainment differences, and epidemiological studies must take this into account in study design.
What is already known on this topic
-
Congenital anomalies are a major cause of stillbirths and infant mortality
-
The aetiology of most congenital anomalies is not fully understood
What this study adds
-
During the 1990s the prevalence of congenital anomalies in Britain remained stable
-
Live birth prevalence declined due to an increase in the proportion of pregnancies resulting in a termination
-
Regional variation in the prevalence of selected congenital anomalies exists which can only partly be explained by ascertainment variation
-
Geographical and epidemiological studies must take ascertainment differences into account in their design
Acknowledgments
We wish to acknowledge Michael Rosato (University of Ulster) for computing attribution of anomaly subgroups to the register and ONS data based on ICD-9 and ICD-10 codes, and Bev Botting and Nigel Physick at the ONS. We thank Mrs Marjorie Renwick, Operation Manager, and other staff at the Regional Maternity Surveys Office and the Northern Congenital Abnormality Survey Steering Group for access to the data. We are grateful to all the Link Clinicians in the Northern Region for their continued collaboration and support of the NorCAS. We thank Hayley Williamson-North and Sheila Sargent for collecting and preparing the data for the North Thames West register. We acknowledge staff in the Prenatal Diagnosis Unit, Oxford for help in registering cases and the Fetal Medicine Team in Southampton. We are grateful to the following funders: Greater Glasgow Health Board, the North Thames Genetic Commissioning Group, and the Department of Health (NorCAS and OXCAR).
REFERENCES
Footnotes
-
Funding: the study was funded by the Department of Health/Department for the Environment, Transport and Regions/Environment Agency Joint Research Programme on Landfill sites
-
Competing interests: none declared