Article Text

Abstract
Objective To examine the appropriateness of different statistical models in analysing falls count data.
Methods Six count models (Poisson, negative binomial (NB), zero-inflated Poisson (ZIP), zero-inflated NB (ZINB), hurdle Poisson (HP) and hurdle NB (HNB)) were used to analyse falls count data. Empirical evaluation of the competing models was performed using model selection criteria and goodness-of-fit through simulation. Data used were from a prospective cohort study of women aged 40–80 years.
Results Of the 465 women analysed, 330 (71%) did not fall at all. The analyses identified strong evidence of overdispersion in the falls data. The NB-based regression models (HNB, ZINB, NB) were better performed than the Poisson-based regression models (Poisson, ZIP, HP). Vuong tests favoured the HNB model over the NB and ZINB models and the NB model over the ZINB model. Model accuracy measures and Monte Carlo simulation of goodness-of-fit confirmed the lack of fit of the Poisson-based regression models and demonstrated the best fit for the HNB model with comparable good fit for the ZINB and NB models.
Conclusions Falls count data consisting of a considerable number of zeros can be appropriately modelled by the NB-based regression models, with the HNB model offering the best fit. The evaluation procedure presented in this paper provides a defensible guideline to appropriately model falls or similar count data with excess zeros.
- Falls count data
- poisson
- negative binomial
- zero-inflated models
- hurdle models
- methods
Statistics from Altmetric.com
Introduction
Falls and associated fall injuries are a major public health concern in developed countries. It is estimated that 30–60% of adults living in the community fall each year in Australia, and up to 10% of these falls result in serious injuries including fracture, head injury and serious laceration,1 costing more than the treatment costs of motor vehicle injuries.2 It is therefore important to understand the epidemiology of falls more precisely in order to reveal the true burden of falls and their related injuries. Appropriate statistical modelling can generate accurate and reliable information about the epidemiology of falls. However, methodological challenges and the nature of the data must be taken into account when choosing statistical methods to analyse falls count data.3
The distribution of falls is highly skewed to the right and, as such, the usual assumption of normality of many statistical tests is violated. However, numerous studies have disregarded this requirement and still employed inappropriate statistical techniques.4 A recent systematic review reported that fewer than one-third of 83 reviewed papers used appropriate statistical methods to analyse recurrent fall events.5
The Poisson model is considered the basic approach in analysing count data,6 with the assumption of the mean being equal to its variance. However, count data often exhibit greater variability (variance > mean) called overdispersion.6 Failure to deal with overdispersion leads to serious underestimation of standard errors of regression parameters and narrower CIs.7–9 A flexible alternative to the Poisson model is the negative binomial (NB) model with a built-in dispersion parameter that can account for greater variability due to unobserved heterogeneity and/or temporal dependency. However, the NB model may not be adequate to deal with overdispersion resulting from excess zeros.10
Excess zeros in count data can be categorised as either ‘structural zeros’ which are inevitable true zeros and ‘sampling zeros’ which occur by chance. Two commonly used zero-modified models are zero-inflated models7 and hurdle models.11 Zero-inflated models (zero-inflated Poisson (ZIP) and zero-inflated NB (ZINB)) are mixture models of two data generation processes12 where the first stage deals with the probability that its counts will move from a ‘zero only’ state to an ‘other than zero’ state. The other stage is characterised by non-zero counts, which are assumed to follow a known distribution such as Poisson or NB. Hurdle models (hurdle Poisson (HP), hurdle NB (HNB)) consist of two parts: the first part induces a binary event to investigate whether a count event falls below or above the hurdle. Once the hurdle to the first event has been cleared, the second part determines the number of subsequent events to explain the observations above the hurdle.10
Count data modelling discussed above has received considerable attention in recent years in many areas including analysis of traffic injuries,9 highway safety,13 vaccine adverse events,10 smoking behaviour14 and microbial data.15 However, little is known about the applications of such models in the analysis of falls data.3 4 Ullah and colleagues recently compared four count models (Poisson, NB, ZIP, ZINB) to analyse falls data,16 but their assessment did not include hurdle models where zero can occur only by chance.
Our purpose was to investigate the appropriateness of different count models in analysing falls count data. Six count models (Poisson, NB, ZIP, ZINB, HP and HNB) were compared in order to provide a defensible suggestion on how to appropriately model falls count data which are likely to have excess zeros. A real-life prospective falls dataset was used in this study to assess the suitability of different count models.
Methods
Six statistical models for modelling falls count data are considered in the present paper: Poisson, NB, ZIP, ZINB, HP and HNB (see appendix A in online supplement). A brief account is presented on tests for overdispersion in the falls count data and the evaluation of fitted competing models.
Tests for overdispersion
Cameron and Trivedi6 introduced a simple test for overdispersion based on an auxiliary ordinary least square regression without the intercept:
The significance of the Z-statistic for the regression coefficient implies the existence of overdispersion.
Another test of overdispersion in the Poisson model is based on the Lagrange Multiplier (LM) statistic17:
This follows a χ2 distribution with 1 degree of freedom. A significant LM statistic suggests evidence of overdispersion.
Evaluation of fitted models
Empirical evaluation and comparison of the fitted models was performed at two levels.6 First, a set of model selection criteria were used to choose among the competing models. Next, goodness-of-fit (GoF) criteria were used to evaluate whether the preferred model provided a good fit to the observed data.
Model selection criteria
A number of tests can be used to examine whether one model is preferred over the other. These are described in table 1.
Model selection criteria for nested and non-nested models
Goodness-of-fit criteria
The usual GoF tests are based on the assumptions that the expected cell frequencies should be large enough. Nonetheless, the expected frequencies of fall counts are expected to be small when the number of falls is large. As such, exact p values for the Pearson χ2 and log likelihood ratio (LR) tests of GoF were estimated using Monte Carlo simulation.20 This approach offers a better estimation of the exact distribution than most commonly used asymptomatic approximations.21
Furthermore, a number of accuracy measures were used to assess the competing models. If ei=Oi−Ei represents the difference between the observed (Oi) and expected (Ei) counts, then mean squared errors (MSE) is defined as: MSE=mean (ei2). The mean absolute error (MAE=mean (|ei|)) is less sensitive to extreme values than both the MSE and RMSE. Another widely used measure is the mean absolute percentage error (MAPE)=mean(|pi|) where pi=100ei/Oi. This approach has the advantage of being scale-independent, easy to interpret and to support statistical evaluations.22 In addition, the error (observed−predicted) probabilities of falls were plotted for each model to obtain a graphical illustration of fit.
Data and software considerations
To illustrate the evaluation procedures, falls data were used from a prospective observational cohort study (see Nitz and Low-Choy23 for details). The total number of falls over a 5-year period was used as the outcome event of interest. Intercept-only models were estimated for this study in order to reflect the real distribution of falls, disregarding the effects of covariates on falls. The models outlined above were estimated in Stata Version 10.1 using commands ‘poisson’, ‘nbreg’, ‘zip’, ‘zinb’, ‘hp’ and ‘hnb’ along with their post-estimation commands. A Stata command ‘mgofi’ was used to implement the Monte Carlo simulation to compute exact-test probabilities. Vuong tests were performed using R version 2.11.1.
Results
Of the 465 women analysed in the study, 330 (71%) did not fall at all, 78 (17%) fell once, 28 (6%) fell twice and 29 (6%) fell more than twice. The observed mean and the variance of falls were 0.61 and 2.42, respectively. The variance was 3.97 times larger than the mean. These findings indicate strong evidence of overdispersion in the falls data, which is supported by a significant result in the Cameron and Trivedi test (Z=2.73, p=0.007) and the LM statistic (χ2(1)=24.27, p<0.001).
Parameter estimates
Table 2 gives the estimates of the parameters of the six count models. The dispersion parameter (
Parameter estimates (with 95% CI) of the six count models fitted to falls count data
Model selection criteria
As shown in figure 1, Poisson modelling was unable to fit the observed falls data. It considerably underestimated the observed zero counts (54% compared with 71% observed), while overestimating the incidence of single and two falls.
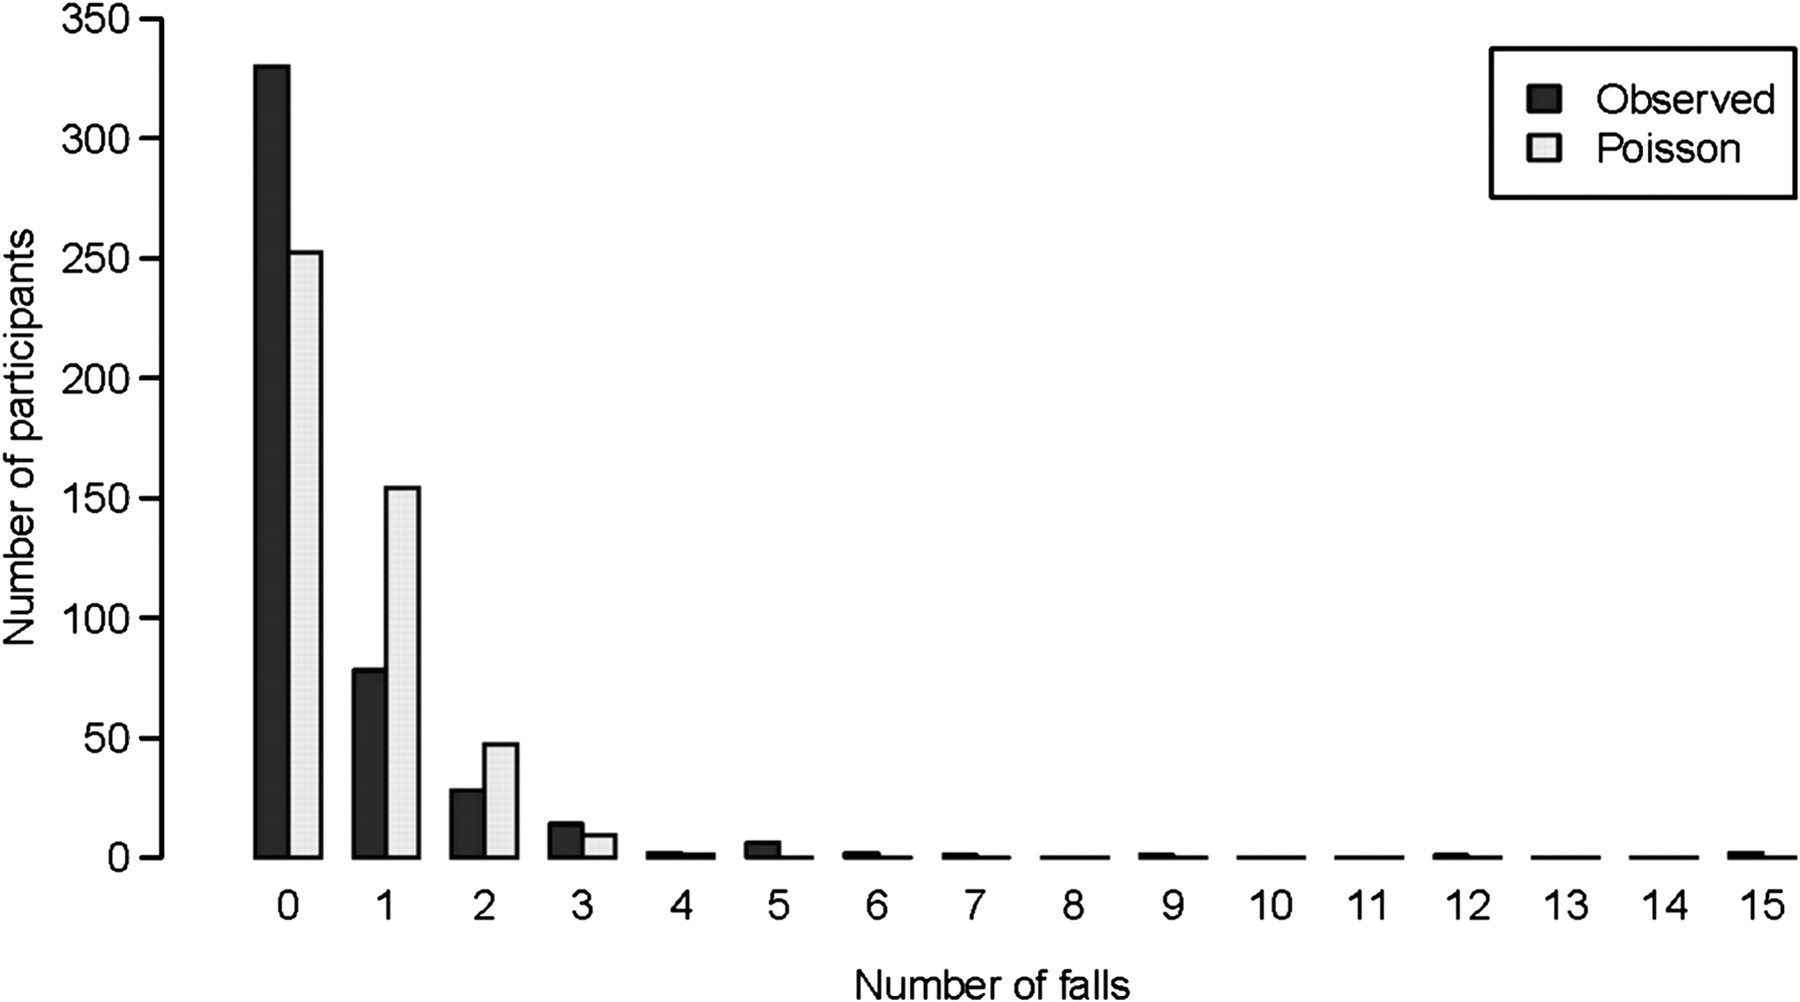
Observed and Poisson predicted count of falls (n=465).
The poor fit of the Poisson model was significantly improved by the NB model, as evidenced by a significant LR test (χ2(1)=285.71, p<0.001). The better performance of the NB model was also evident from the reduction in overdispersion parameters (from 1.94 to 1.21 in deviance and from 3.95 to 2.45 in the Pearson χ2 test). However, these reductions demonstrate the inability of the NB model to fully adjust the effects of overdispersion, which may be due to excess zeros in the falls data.
Zero-modified models were implemented to deal with excess zeros. Significant LR tests favoured ZINB over the ZIP model (χ2(1)=83.0, p<0.001) and HNB over the HP model (χ2(1)=87.62, p<0.001). These results suggest that the NB-based models fitted the observed data much better than their Poisson-based counterparts. The Vuong test overwhelmingly favoured the ZIP over the Poisson model (p<0.001) and moderately favoured the NB model over the ZINB model (p=0.016). The HNB model performed better than the NB (p=0.027) and ZINB (p=0.031) models.
Table 3 shows log-likelihood (LL), Akaike's information criterion (AIC) and Bayesian information criterion (BIC) for the fitted models. Both AIC and BIC provide strong evidence in favour of the NB-based models over the Poisson-based models. There is moderate evidence to suggest that the HNB is preferred over the ZINB (∆AIC=4.61). The BIC results reveal positive evidence in favour of the NB and HNB over the ZINB model (∆BIC=6.14 and ∆BIC=4.62, respectively).
Model selection criteria (log-likelihood (LL), Akaike's information criterion (AIC) and Bayesian information criterion (BIC)) of the fitted models for falls count data
Goodness-of-fit statistics
Exact p values, estimated using Monte Carlo simulation, confirmed the lack of fit (p<0.001) of the Poisson, ZIP and HP models to the observed falls data with respect to both the Pearson χ2 and LR tests (table 4). However, the exact p values were highly insignificant for the NB-based models with substantial improvements in fit. The HNB model offered the best fit with exact p values for the χ2 and log-LR tests being 0.67 and 0.51, respectively. The ZINB and NB offered comparable and reasonably good fit to the observed data (exact p=0.40).
Simulated estimates of exact probability of goodness-of-fit (GoF) statistics (Pearson χ2 and log likelihood ratio (LR) tests) of the fitted models for falls count data
When considering accuracy measures of the models, the NB-based models were found to have minimal error measures compared with the Poisson-based models (table 5). The fit was largely comparable between the HNB, ZINB and NB models (eg, RMSE range from 2.14 to 3.90), while the HNB regression model had minimum error measures.
Measures of accuracy (mean squared error (MSE), root mean squared error (RMSE), mean absolute error (MAE) and mean absolute percentage error (MAPE)) of the fitted models for falls count data
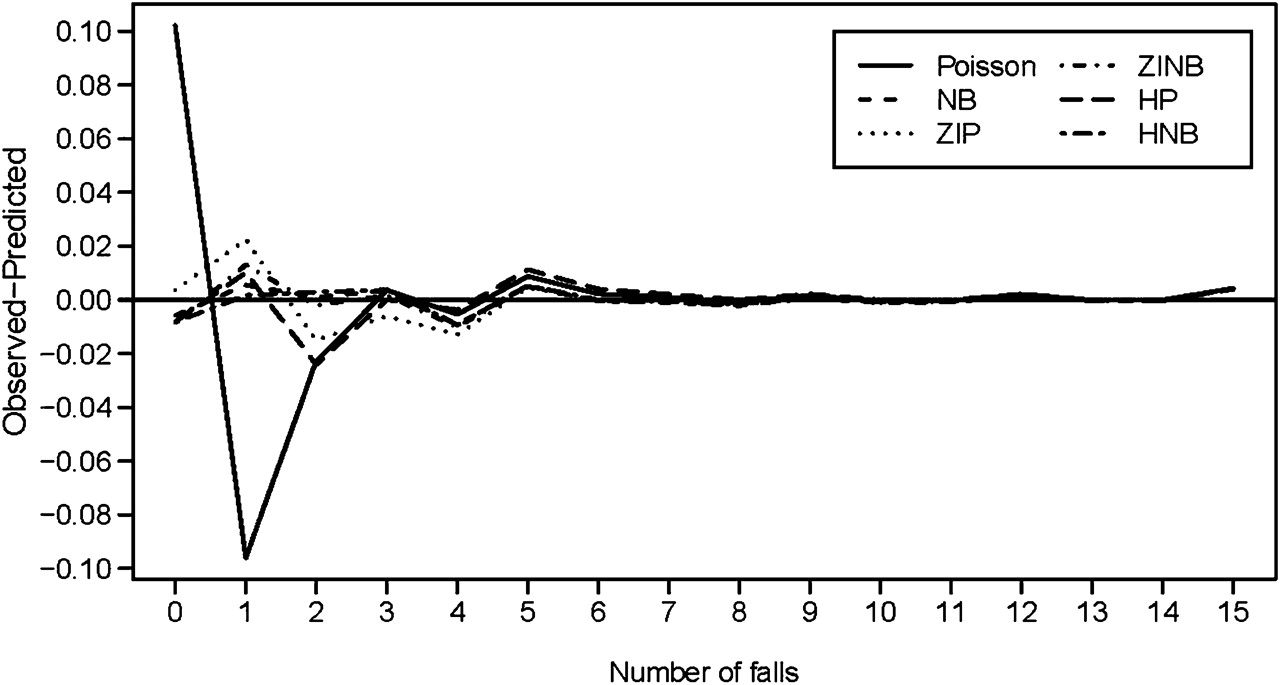
To demonstrate the fit graphically, the differences between the observed and predicted probabilities with the number of fall counts from the six models are plotted in figure 2. The NB-based models predicted the falls better than the Poisson-based models, with the HNB model having more accurate predicted probabilities than that of the other models.
Difference between observed proportions and mean predicted probabilities of falls data for six count models: Poisson, negative binomial (NB), zero-inflated Poisson (ZIP), zero-inflated negative binomial (ZINB), hurdle Poisson (HP) and hurdle negative binomial (HNB).
Discussion
Although there are some guidelines on how to analyse falls count data, little attention has been paid to the implementation of zero-modified count models in such data. The present study offers a more comprehensive approach to how different count models may have to be adopted when modelling falls count data with excess zeros. In addition, this study demonstrates how overdispersion can be assessed using the Z-test and LM statistic.
Where the Poisson model has failed to take into account the extra variability of the falls data, the NB model has provided a substantial improvement. Nonetheless, the NB model is unable to completely adjust the effects of overdispersion with an α parameter of 2.02. This leads to the implementation of zero-modified models which are capable of dealing with the overdispersion caused by both heterogeneity and excess zeros.10 15
Using standard model selection criteria and goodness of fit through Monte Carlo simulation, the present study has shown that the NB-based models (HNB, ZINB and NB) are better performed and well fitted than their Poisson-based counterparts (Poisson, ZIP and HP) in analysing falls data with excess zeros. This finding is supported by recent research on modelling microbial count data15 and vaccine adverse event count data10 with excess zeros. In particular, the present study has evidence to conclude that the HNB model is likely to offer the best performance of the count models in analysing falls count data. This complies with the theoretical understanding that all subjects are at risk of falling (ie, there is no structural zero) and, as such, the HNB model is more appropriate for modelling count data with excess sampling zeros. The present study also found comparable fitting of the ZINB and NB models in analysing falls count data, which is supported by a recent study of falls data.16 However, the marginal significance of the ZINB parameter has compromised the suitability of ZINB in fall data modelling, while the NB model has been inadequate in adjusting the greater variability in falls data with excess zeros. The present study has contributed to the field by directly comparing six count models including hurdle parameterisations of the Poisson and NB regression models. To the best of our knowledge, this is the first study of this kind that has compared six standard and zero-modified count models in modelling falls count data, which is an important step forward in modelling falls count data with excess zeros.
Although the HNB model offered the best fit to the falls count data under study, this does not guarantee that this model would offer the same for any falls data. In addition, the theoretical improvement of the HNB over the ZINB or NB model remains to be proven in falls data with excess zero counts. Nevertheless, the fitting procedures presented in this paper with various model selection and GoF criteria may be used as a defensible guideline in modelling falls count data, which has potential applications in modelling other count data of similar nature with excess zeros. Furthermore, the count models used in this evaluation can be implemented using standard statistical software such as Stata and SAS.
What is already known on this subject
Falls count data have excess zeros (no fall) and provide strong evidence of overdispersion.
Negative binomial and zero-inflated models are used to analyse falls count data with excess zeros.
What this study adds
Using extensive empirical evaluation and simulation, the present study adds hurdle models to the evaluation framework for modelling falls count data with excess zeros.
The hurdle negative binomial (HNB) model offers the best performance in modelling falls count data with comparable performance of zero-inflated NB and standard NB models and poor performance of Poisson-based regression models.
The evaluation procedure presented in this paper provides a defensible guideline to appropriately model falls count data with excess zeros.
Acknowledgments
The authors thank Professor S K Khoo, Dr Sheila O'Neill and staff at the Betty Byrne Henderson Centre for Women's Health Research at the Royal Brisbane and Women's Hospital, Brisbane for their assistance with recruitment and project management during the balance assessment and falls data collection aspect of the LAW study. They are also grateful to all the women who participated in the study.
References
Supplementary materials
Web Only Data
Files in this Data Supplement:
Footnotes
Funding This work was supported in part by the University Queensland Start-up Grant (grant number 2007001006).
Competing interests None
Provenance and peer review Not commissioned; externally peer reviewed.