


Abstract
Consistent evidence has shown a positive association between particulate matter with an aerodiameter of less than or equal to 10 μm (PM10) and daily mortality. Less is known about the modification of this association by factors measured at the individual level. The authors examined this question in a case-crossover study of 20 US cities. Mortality events (1.9 million) were obtained for nonaccidental, respiratory, heart disease, and stroke mortality between 1989 and 2000. PM10 concentrations were obtained from the US Environmental Protection Agency. The authors examined the modification of the PM10–mortality association by sociodemographics, location of death, season, and secondary diagnoses. They found different patterns of PM10–mortality associations by gender and age but no differences by race. The level of education was inversely related to the risk of mortality associated with PM10. PM10-related, out-of-hospital deaths were more likely than were in-hospital deaths, as were those occurring during spring/fall versus summer/winter. A secondary diagnosis of diabetes modified the effect of PM10 for respiratory and stroke mortality. Pneumonia was a positive effect modifier for deaths from all causes and stroke, while secondary stroke modified the effects for all-cause and respiratory deaths. The findings suggest that more attention must be paid to population characteristics to identify greater likelihood of exposures and susceptibility and, as a result, to improve policy making for air pollution standards.
Particles in air have been shown to increase morbidity and mortality (1–7). These effects could not be explained by high concentrations of other co-pollutants, weather, or seasonal patterns (4, 5, 8–11), thus strengthening the ground for a causal relation. Nevertheless, much remains to be understood about individual-level factors that might modify these risks, including sociodemographic factors, medical conditions, and modifiers of exposure. Better knowledge of these modifiers will increase the power to detect risk in future studies and also help to identify the potential mechanisms of the particulate matter effects (12). In addition, a better understanding of differential risks will aid in public policy determinations and, hence, benefit risk assessment and the making of air pollution standards.
Although many studies have examined the effects of particles on human health, only a limited number of studies have explored the differences in these effects among population subgroups defined by group-level (5, 13–15) or individual-level modifying factors (16–25). Different factors, including sociodemographics, location of death, specific medical conditions, season and ventilation characteristics, and the focus of the present work, have all been described as potential modifiers of air pollution effects on morbidity and mortality events (5, 13–26). Many of these earlier studies were conducted in only a limited number of cities and examined only some of the potential modifiers. Most studies of socioeconomic status have used area-level, including city-level, ecologic data rather than individual-level variables (5, 15, 27). The present study examined these factors at the individual level in a case-crossover design across 20 cities in the United States.
MATERIALS AND METHODS
Study data
Daily mortality.
We obtained detailed mortality files of the US population between 1989 and 2000 from the National Center for Health Statistics. We defined all-cause daily mortality after excluding any deaths from accidental causes (International Classification of Diseases, Tenth Revision, codes V01–Y98). Specific causes of death included mortality from heart disease (codes I01–I51), acute myocardial infarction (codes I21 and I22), respiratory disease (codes J00–J99), and stroke (codes I60–I69).
Air pollution data.
Air pollution data for particulate matter with an aerodiameter of equal to or less than 10 μm (PM10) were obtained from the US Environmental Protection Agency Aerometric Information Retrieval System for the same years (28). This system retrieves data from multiple monitors in each county for both daily and hourly average measurements. The sampling method for hourly data uses monitors that are susceptible to a greater loss of semivolatile particles from traffic than the integrated 24-hour monitors (29, 30). Therefore, we used the integrated PM10 data for our analyses.
Exposure assignment in our study was done for each city (a city may include more than one county). Such assignment required that the different monitored daily values in each city be averaged to one daily value. Because not all monitors in a city work every day, the average daily values for that city could vary because of the number of included monitors and not just because of true concentration variability. To avoid such a problem, we applied an algorithm described by Schwartz (15) that removes monitor influence in the city daily values.
Although we selected cities with daily PM10 monitoring, daily concentrations of PM10 were occasionally missing. Even small numbers of missing data can present a problem when examining multiple lags of exposure in a model. We used regression models to predict missing PM10 daily values utilizing local meteorologic data obtained form the US Surface Airways and Airways Solar Radiation hourly data (including extinction coefficient (31), a measure of light scattering by fine particles) and PM10 concentrations the day before and the day after. We included only those months missing less than 25 percent of the days and PM10 daily values of less than or equal to 300 μg/m3. On average, 9.5 percent of missing data were filled in.
We focused on 20 cities in the United States with sufficient series of mortality and daily air pollution data: Birmingham, Alabama; Boulder, Colorado; Canton, Ohio; Chicago, Illinois; Cincinnati, Ohio; Cleveland, Ohio; Colorado Springs, Colorado; Columbus, Ohio; Denver, Colorado; Detroit, Michigan; Honolulu, Hawaii; Minneapolis, Minnesota; Nashville, Tennessee; New Haven, Connecticut; Pittsburgh, Pennsylvania; Provo, Utah; Salt Lake City, Utah; Seattle, Washington; Terra Haute, Indiana; and Youngstown, Ohio.
An earlier case-crossover study (32) used distributed-lag models (33) to examine the temporal effects of PM10 concentrations on the same day and 1 and 2 days before the event on the risk of mortality, using the same data as the present study. This previous study reported the persistent effects of PM10 concentrations over several days for all-cause mortality (1 and 2 days prior to the event), respiratory disease (across all 3 days), and heart disease mortality (1–2 days before the event). For deaths from myocardial infarction, the effect of PM10 was mainly on the same day as the event and, for stroke mortality, mainly with exposures the day before the event (32). Because the focus of the present paper was effect modification, we had to reduce these observed associations to a simple measure of PM10. For those associations where the effects persisted for more than 1 day, the average concentration of PM10 over those days was used, while for those with PM10 concentrations for only 1 day, that day's exposure concentration was used in the analyses.
Effect modification
Detailed mortality files included individual-level data on the secondary causes of death and the individual characteristics of the event cases. This information was used to examine effect modification of the mortality–PM10 association by sociodemographic factors, location of death, season, and contributing causes of death.
Sociodemographic characteristics.
Variability in the effects of particulate matter on mortality could be attributed to differences in individual-level characteristics, for example, gender, race, and age group. Analyses were stratified by gender (males and females), race (White and Black), and age group (>0–65 years, >65–75 years, and >75 years).
We used education as an indicator of socioeconomic status. We used three levels of education: low education for less than 8 years of schooling, medium education for 8–12 school years, and high education for 13 years or more.
Location of death.
Different patterns of mortality from air pollution have been described for different placement of death (24, 25). In our study, we defined location of death as “in-hospital deaths,” which included hospital, clinic, or medical center inpatients, as well as outpatients admitted to the emergency room; and “out-of-hospital deaths” defined as all other deaths.
Season.
The effect of PM10 was examined for winter, summer, and transition period (spring and fall). The effect of season may be related to an interaction between temperature and other weather conditions with particulate matter (34, 35) or to differences in level of exposure due to the rate of ventilation of indoor environments with outdoor concentrations (36–38).
Contributing causes of death.
Poor health has been shown to increase the risk of death from increased concentrations of PM10 (12, 16–18, 24, 39), because of increased susceptibility. For example, among those affected with cardiac disease, increased lung inflammation may lead to the release of inflammatory mediators, exacerbation of lung conditions, and increased blood coagulability, leading to exacerbation of cardiovascular disease (12, 17, 22).
Diabetes as a secondary condition has been hypothesized to increase the susceptibility of the capillary system to influences from exposures to particulate matter (20, 21, 40).
We examined secondary diagnoses of pneumonia, heart failure, stroke, and diabetes as modifiers of the PM10 effects on daily mortality.
Statistical method of analysis
The study used a case-crossover design to examine the association between daily mortality and PM10. The case-crossover design is similar in concept to that for a case-control study (41), except that now the case and its controls are the same subject, but in different times. The time (day) of the event defines a case, and the times (days) free of the event are its controls. To control for confounding by season or confounding by time trends, we selected control days to be close to the event day, using a time-stratified approach (the same month of the same year as the event) (8, 9, 42, 43).
Controls were selected as every third day within each stratum (month/year of the event) to eliminate any serial correlation. As in a case-control study, conditional logistic regression was applied to the matched strata, to compare different characteristics between the case day and its controls.
Two-level analyses
Analyses were carried out in two hierarchical stages. All analyses were stratified on each modifying factor being examined. For example, when examining the effect of PM10 by gender, separate analyses were carried out for males and females. In the first stage, the effects of PM10 on mortality risk were estimated through city-specific models. These models additionally included indicator variables for “day of week” and quadratic functions for apparent temperature (46, 47) on the same day and the day before the event to control for the effect of weather (32, 48, 49).
We estimated the overall effects across all cities in the second-stage analyses, applying random-effect meta-regression models to allow for heterogeneity in the city-specific response (50), using the estimates from the city-specific models of the first stage.
Sensitivity analyses
We carried out sensitivity analyses using a common lag structure of PM10 (average PM10 concentration on 3 days) for all-cause and heart disease mortality, to compare with main analyses. We then examined effect modification by education, age, and season.
To test the sensitivity of our results to filling in missing PM10 data, we used multiple imputation methods in several large cities with the greatest number of days with missing data and compared the results with those of the main analyses.
For age, education, and season, we carried out trend analyses and report two-sided p values of these.
The estimates of the PM10–mortality association reported in this paper refer to the percentage of increase in mortality per any 10-μg/m3 increment of PM10 concentration. SAS software (SAS Institute, Inc., Cary, North Carolina) was used for statistical analyses of the first stage, and S-PLUS software (Insightful Corporation, Seattle, Washington) was used to implement random meta-regression analyses.
RESULTS
Average annual mortality events per 100,000 were higher in Birmingham, Alabama; Minneapolis, Minnesota; Nashville, Tennessee; Pittsburgh, Pennsylvania; and Terra Haute, Indiana (table 1). Deaths from any respiratory disease were about 10 percent of all-cause mortality. One third of all deaths were from heart disease, and about a third of these (26 percent) were deaths from myocardial infarction. Mortality from stroke was about 7 percent of all-cause mortality. In total, the study included 1,896,306 deaths.
City | All-cause mortality‡ | Respiratory disease (% of all-cause mortality) | Heart disease (% of all-cause mortality) | Stroke (% of all-cause mortality) | Minimum summer apparent temperature (°C) | Maximum winter apparent temperature (°C) | Mean PM10 (μg/m3) | Mean variance of PM10 by strata (μg/m3)§ | ||
|---|---|---|---|---|---|---|---|---|---|---|
| Total deaths | Deaths/ 100,000¶ | |||||||||
| Birmingham, Alabama | 41,398 | 1,401 | 9 | 32 | 8 | 29.3 (3.3)# | 6.7 (5.8) | 31.9 (18.0) | 300.7 (227.2) | |
| Boulder, Colorado | 9,551 | 441 | 12 | 31 | 8 | 20.1 (3.3) | −1.2 (5.4) | 22.1 (11.3) | 114.0 (127.4) | |
| Canton, Ohio | 34,061 | 1,055 | 11 | 35 | 7 | 22.5 (4.6) | −3.0 (5.5) | 26.6 (11.5) | 113.0 (90.8) | |
| Chicago, Illinois | 534,793 | 921 | 9 | 36 | 6 | 23.6 (5.3) | −3.5 (4.9) | 33.7 (16.4) | 257.0 (196.2) | |
| Cincinnati, Ohio | 82,455 | 1,136 | 10 | 33 | 7 | 25.1 (4.5) | −0.5 (6.0) | 31.4 (13.9) | 165.4 (131.3) | |
| Cleveland, Ohio | 188,434 | 1,192 | 8 | 38 | 6 | 23.2 (4.8) | −2.2 (5.7) | 37.5 (18.7) | 331.7 (247.1) | |
| Colorado Springs, Colorado | 17,518 | 508 | 14 | 28 | 9 | 18.3 (3.6) | −0.9 (5.3) | 24.0 (13.2) | 135.3 (193.8) | |
| Columbus, Ohio | 33,472 | 886 | 8 | 34 | 6 | 24.6 (4.7) | −1.4 (4.7) | 28.5 (12.5) | 132.0 (82.6) | |
| Denver, Colorado | 41,313 | 1,049 | 13 | 29 | 7 | 20.1 (3.6) | −0.9 (5.6) | 28.5 (12.8) | 153.1 (250.3) | |
| Detroit, Michigan | 213,352 | 1,024 | 8 | 39 | 6 | 23.2 (4.9) | −3.1 (4.4) | 32.1 (17.7) | 322.8 (236.2) | |
| Honolulu, Hawaii | 17,255 | 663 | 10 | 32 | 10 | 29.0 (1.3) | 24.9 (1.9) | 15.9 (6.8) | 42.1 (153.0) | |
| Minneapolis, Minnesota | 155,078 | 1,265 | 10 | 27 | 8 | 22.3 (4.9) | −6.6 (4.5) | 24.7 (12.3) | 148.3 (142.8) | |
| Nashville, Tennessee | 64,187 | 1,254 | 10 | 33 | 8 | 28.7 (3.8) | 3.8 (6.0) | 30.1 (12.1) | 129.5 (101.4) | |
| New Haven, Connecticut | 94,502 | 1,019 | 10 | 35 | 6 | 23.1 (4.6) | −2.0 (4.2) | 25.4 (14.4) | 216.9 (217.7) | |
| Pittsburgh, Pennsylvania | 169,098 | 1,387 | 9 | 37 | 7 | 23.3 (4.4) | −1.5 (5.3) | 30.2 (18.5) | 302.2 (256.9) | |
| Provo, Utah | 15,289 | 392 | 11 | 31 | 9 | 22.4 (4.3) | −2.0 (4.1) | 33.7 (22.2) | 370.3 (629.5) | |
| Seattle, Washington | 101,626 | 709 | 11 | 31 | 8 | 17.0 (3.6) | 3.1 (3.5) | 26.4 (14.7) | 188.1 (194.4) | |
| Salt Lake City, Utah | 54,825 | 579 | 10 | 28 | 7 | 22.4 (4.4) | −2.1 (4.1) | 35.0 (20.8) | 354.2 (457.0) | |
| Terra Haute, Indiana | 5,035 | 1,352 | 9 | 37 | 8 | 24.8 (4.4) | −3.6 (5.4) | 29.2 (14.6) | 159.4 (143.4) | |
| Youngstown, Ohio | 23,064 | 1,122 | 8 | 38 | 8 | 22.1 (4.7) | −2.9 (4.8) | 30.8 (13.9) | 164.0 (120.1) | |
PM10, particulate matter with an aerodiameter of less than or equal to 10 μm.
All descriptive statistics for weather and PM10 concentrations were extracted from the available data between 1989 and 2000.
The primary cause of death from injuries was excluded.
Strata were defined by each event case (day of event), and its control days were selected every third day of the same month and year as the case day.
Numbers represent the average annual mortality per 100,000.
Numbers in parentheses, standard deviation.
City | All-cause mortality‡ | Respiratory disease (% of all-cause mortality) | Heart disease (% of all-cause mortality) | Stroke (% of all-cause mortality) | Minimum summer apparent temperature (°C) | Maximum winter apparent temperature (°C) | Mean PM10 (μg/m3) | Mean variance of PM10 by strata (μg/m3)§ | ||
|---|---|---|---|---|---|---|---|---|---|---|
| Total deaths | Deaths/ 100,000¶ | |||||||||
| Birmingham, Alabama | 41,398 | 1,401 | 9 | 32 | 8 | 29.3 (3.3)# | 6.7 (5.8) | 31.9 (18.0) | 300.7 (227.2) | |
| Boulder, Colorado | 9,551 | 441 | 12 | 31 | 8 | 20.1 (3.3) | −1.2 (5.4) | 22.1 (11.3) | 114.0 (127.4) | |
| Canton, Ohio | 34,061 | 1,055 | 11 | 35 | 7 | 22.5 (4.6) | −3.0 (5.5) | 26.6 (11.5) | 113.0 (90.8) | |
| Chicago, Illinois | 534,793 | 921 | 9 | 36 | 6 | 23.6 (5.3) | −3.5 (4.9) | 33.7 (16.4) | 257.0 (196.2) | |
| Cincinnati, Ohio | 82,455 | 1,136 | 10 | 33 | 7 | 25.1 (4.5) | −0.5 (6.0) | 31.4 (13.9) | 165.4 (131.3) | |
| Cleveland, Ohio | 188,434 | 1,192 | 8 | 38 | 6 | 23.2 (4.8) | −2.2 (5.7) | 37.5 (18.7) | 331.7 (247.1) | |
| Colorado Springs, Colorado | 17,518 | 508 | 14 | 28 | 9 | 18.3 (3.6) | −0.9 (5.3) | 24.0 (13.2) | 135.3 (193.8) | |
| Columbus, Ohio | 33,472 | 886 | 8 | 34 | 6 | 24.6 (4.7) | −1.4 (4.7) | 28.5 (12.5) | 132.0 (82.6) | |
| Denver, Colorado | 41,313 | 1,049 | 13 | 29 | 7 | 20.1 (3.6) | −0.9 (5.6) | 28.5 (12.8) | 153.1 (250.3) | |
| Detroit, Michigan | 213,352 | 1,024 | 8 | 39 | 6 | 23.2 (4.9) | −3.1 (4.4) | 32.1 (17.7) | 322.8 (236.2) | |
| Honolulu, Hawaii | 17,255 | 663 | 10 | 32 | 10 | 29.0 (1.3) | 24.9 (1.9) | 15.9 (6.8) | 42.1 (153.0) | |
| Minneapolis, Minnesota | 155,078 | 1,265 | 10 | 27 | 8 | 22.3 (4.9) | −6.6 (4.5) | 24.7 (12.3) | 148.3 (142.8) | |
| Nashville, Tennessee | 64,187 | 1,254 | 10 | 33 | 8 | 28.7 (3.8) | 3.8 (6.0) | 30.1 (12.1) | 129.5 (101.4) | |
| New Haven, Connecticut | 94,502 | 1,019 | 10 | 35 | 6 | 23.1 (4.6) | −2.0 (4.2) | 25.4 (14.4) | 216.9 (217.7) | |
| Pittsburgh, Pennsylvania | 169,098 | 1,387 | 9 | 37 | 7 | 23.3 (4.4) | −1.5 (5.3) | 30.2 (18.5) | 302.2 (256.9) | |
| Provo, Utah | 15,289 | 392 | 11 | 31 | 9 | 22.4 (4.3) | −2.0 (4.1) | 33.7 (22.2) | 370.3 (629.5) | |
| Seattle, Washington | 101,626 | 709 | 11 | 31 | 8 | 17.0 (3.6) | 3.1 (3.5) | 26.4 (14.7) | 188.1 (194.4) | |
| Salt Lake City, Utah | 54,825 | 579 | 10 | 28 | 7 | 22.4 (4.4) | −2.1 (4.1) | 35.0 (20.8) | 354.2 (457.0) | |
| Terra Haute, Indiana | 5,035 | 1,352 | 9 | 37 | 8 | 24.8 (4.4) | −3.6 (5.4) | 29.2 (14.6) | 159.4 (143.4) | |
| Youngstown, Ohio | 23,064 | 1,122 | 8 | 38 | 8 | 22.1 (4.7) | −2.9 (4.8) | 30.8 (13.9) | 164.0 (120.1) | |
PM10, particulate matter with an aerodiameter of less than or equal to 10 μm.
All descriptive statistics for weather and PM10 concentrations were extracted from the available data between 1989 and 2000.
The primary cause of death from injuries was excluded.
Strata were defined by each event case (day of event), and its control days were selected every third day of the same month and year as the case day.
Numbers represent the average annual mortality per 100,000.
Numbers in parentheses, standard deviation.
Higher summer apparent temperature was seen for Birmingham, Alabama; Cincinnati and Columbus, Ohio; Nashville, Tennessee; and Terra Haute, Indiana. The overall mean concentration of PM10 varied by city and across time within each city. The large variation of PM10 concentrations within strata ensured sufficient power for this study.
All-cause mortality increased 0.42 percent (95 percent confidence interval (CI): 0.26, 0.58) for PM10 concentrations 1 and 2 days prior (figure 1). For respiratory deaths, the effect was doubled at 0.87 percent (95 percent CI: 0.38, 1.36).
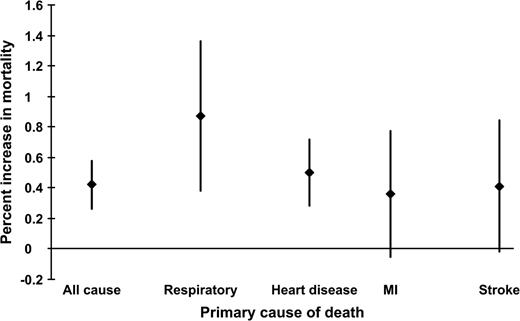
Percent increase in mortality per 10-μg/m3 increase in PM10 in 20 US cities between 1989 and 2000. The association for all-cause mortality and PM10 is for average concentrations on the day before and 2 days before the event. The respiratory mortality–PM10 association is evaluated for concentrations on all 3 days. The association between heart disease mortality and PM10 is for the 2 days before the event, the myocardial infarction (MI)–PM10 association is evaluated for concentrations on the same day as the death, and the association for stroke mortality and PM10 concentrations is for the day prior. The diamonds represent percent increase in mortality, and the vertical bars indicate the 95 percent confidence intervals. PM10, particulate matter with an aerodiameter of less than or equal to 10 μm.
Sociodemographic factors
PM10-associated mortality from all causes and the broad groupings of respiratory and heart disease did not differ by gender or race (table 2). Although dividing by cause and gender reduced numbers and precision, the effect estimate for stroke was more than five times higher in females than in males, and for myocardial infarction it was more than double, although neither difference was statistically significant. An approximately fourfold increase for deaths from myocardial infarction was seen among Blacks, while stroke deaths were mainly among Whites.
Effects of the demographic factors gender, race, and age as modifiers of the PM10*–all-cause and cause-specific daily mortality associations in 20 US cities between 1989 and 2000
Primary cause of death | Gender | Race | Age | ||||||||||||||||||||||
|---|---|---|---|---|---|---|---|---|---|---|---|---|---|---|---|---|---|---|---|---|---|---|---|---|---|
| Male | Female | White | Black | <65 years | 65–75 years | >75 years | |||||||||||||||||||
| %† | 95% confidence interval | % | 95% confidence interval | % | 95% confidence interval | % | 95% confidence interval | % | 95% confidence interval | % | 95% confidence interval | % | 95% confidence interval | ||||||||||||
| All cause | 0.46 | 0.28, 0.64 | 0.37 | 0.17, 0.57 | 0.40 | 0.22, 0.58 | 0.37 | −0.02, 0.76 | 0.25‡ | 0.01, 0.49 | 0.23‡ | −0.06, 0.52 | 0.64‡ | 0.44, 0.84 | |||||||||||
| Respiratory disease | 0.71 | 0.004, 1.42 | 1.04 | 0.33, 1.75 | 0.88 | 0.33, 1.43 | 0.71 | −0.56, 1.98 | 0.94 | −0.31, 2.19 | 0.87 | −0.25, 1.99 | 0.88 | 0.17, 1.59 | |||||||||||
| Heart disease | 0.54 | 0.23, 0.85 | 0.46 | 0.15, 0.77 | 0.50 | 0.25, 0.75 | 0.64 | 0.13, 1.15 | 0.04§ | −0.45, 0.53 | 0.60 | 0.13, 1.07 | 0.65§ | 0.30, 1.00 | |||||||||||
| Myocardial infarction | 0.21 | −0.40, 0.82 | 0.59 | 0.08, 1.10 | 0.24 | −0.27, 0.75 | 0.99 | 0.05, 1.93 | 0.12 | −0.76, 1.00 | 0.92 | 0.21, 1.63 | 0.16 | −0.58, 0.90 | |||||||||||
| Stroke | 0.11 | −0.58, 0.80 | 0.59 | −0.04, 1.22 | 0.48 | 0.01, 0.95 | 0.13 | −0.87, 1.13 | 0.09 | −1.09, 1.27 | −0.46¶ | −1.42, 0.50 | 0.80¶ | 0.27, 1.33 | |||||||||||
PM10, particulate matter with an aerodiameter of less than or equal to 10 μm.
Estimates are presented as the percent increase in mortality per any 10-μg/m3 increment of PM10 concentration.
Differences between >75 years and <65/65–75 years were significant at α = 0.05.
The difference between >75 years and <65 years was significant at α = 0.05.
The difference between >75 years and 65–75 years was significant at α = 0.05.
Those aged 75 or more years were significantly more affected by PM10 for all-cause mortality (table 2). However, the specific grouping of mortality causes showed differences in the magnitude and trend of the effects in the three age groups. For respiratory mortality, the effect was essentially identical across age groups. In contrast, deaths from heart disease (between >75 and ≤65 years: difference = 0.62 percent, 95 percent CI: 0.01, 1.12) and stroke showed higher effects in the oldest age group, while for myocardial infarction events, the effect on those aged 65–75 years was several times larger than that in older or younger age groups, although the difference of effect estimates of age strata was imprecise.
We tested the hypothesis that postmenopausal women had a different risk from premenopausal women, in particular for heart disease mortality, by further stratifying deaths among females by age (<60 years vs. older). The magnitude of the PM10-associated risk for females aged 60 or more years for heart disease (0.50 percent, 95 percent CI: 0.17, 0.83) was fivefold that of the younger group (0.10 percent, 95 percent CI: −1.31, 1.51). In comparison, the effect in males aged 60 or more years was only twice (0.62 percent, 95 percent CI: 0.27, 0.97) that of the younger group (0.29 percent, 95 percent CI: −0.36, 0.94).
As with age, deaths from respiratory disease showed no trend across educational categories. In contrast, for all-cause mortality, the increase in the PM10-associated risk was about 72 percent, comparing low with medium education, and about 130 percent, comparing low with high education, although again power issues resulted in an insignificant trend (p = 0.29).
Location of death
More than a threefold effect on all-cause mortality from high concentrations of PM10 was observed for deaths occurring out of hospital, when compared with in-hospital deaths (table 3) (difference of estimates: 0.49 percent, 95 percent CI: 0.23, 0.75). This effect appeared driven by heart disease and stroke.
Effects of the modifiers educational attainment and location of death on PM10*–all-cause and cause-specific daily mortality associations in 20 US cities between 1989 and 2000
Primary cause of death | Education | Location of death (in or out of hospital) | ||||||||||||||||
|---|---|---|---|---|---|---|---|---|---|---|---|---|---|---|---|---|---|---|
| Low (<8 years) | Medium (8–12 years) | High (>12 years) | In | Out | ||||||||||||||
| %† | 95% confidence interval | % | 95% confidence interval | % | 95% confidence interval | % | 95% confidence interval | % | 95% confidence interval | |||||||||
| All cause | 0.62 | 0.29, 0.95 | 0.36 | 0.12, 0.60 | 0.27 | −0.004, 0.54 | 0.22‡ | 0.04, 0.40 | 0.71‡ | 0.51, 0.91 | ||||||||
| Respiratory disease | 0.82 | −0.32, 1.96 | 0.88 | 0.12, 1.64 | 0.88 | −0.04, 1.80 | 0.78 | 0.17, 1.39 | 1.09 | 0.25, 1.93 | ||||||||
| Heart disease | 0.72 | 0.23, 1.21 | 0.38 | 0.07, 0.69 | 0.54 | 0.13, 0.95 | 0.15‡ | −0.14, 0.44 | 0.93‡ | 0.60, 1.26 | ||||||||
| Myocardial infarction | 0.33 | −0.83, 1.49 | 0.79 | 0.28, 1.30 | −0.13 | −0.82, 0.56 | 0.34 | −0.11, 0.79 | 0.48 | −0.23, 1.19 | ||||||||
| Stroke | 0.07 | −1.44, 1.58 | 0.29 | −0.32, 0.90 | 0.52 | −0.28, 1.32 | 0.06‡ | −0.49, 0.61 | 0.87‡ | 0.05, 1.69 | ||||||||
PM10, particulate matter with an aerodiameter of less than or equal to 10 μm.
Estimates are presented as the percent increase in mortality per any 10-μg/m3 increment of PM10 concentration.
The difference between in and out of hospital is significant at α = 0.05.
Season
PM10-associated deaths from all causes, especially from respiratory disease, showed higher effects during the transition periods (spring/fall) than in the winter or summer (table 4). Heart disease risk seemed consistent across season. Only the respiratory death seasonal differences showed a significant trend (p = 0.03).
Effects of the modifier season (ventilation) on PM10*–all-cause and cause-specific daily mortality associations in 20 US cities between 1989 and 2000
Primary cause of death | Season | ||||||||||
|---|---|---|---|---|---|---|---|---|---|---|---|
| Winter | Summer | Transition (spring/fall) | |||||||||
| %† | 95% confidence interval | % | 95% confidence interval | % | 95% confidence interval | ||||||
| All cause | 0.28 | 0.04, 0.52 | 0.19 | −0.22, 0.60 | 0.49 | 0.25, 0.73 | |||||
| Respiratory disease | −0.007‡ | −0.87, 0.86 | 0.69 | −0.68, 2.06 | 1.57‡ | 0.86, 2.28 | |||||
| Heart disease | 0.41 | −0.002, 0.82 | 0.52 | 0.03, 1.01 | 0.56 | 0.13, 0.99 | |||||
| Myocardial infarction | 0.32 | −0.37, 1.01 | 0.30 | −0.82, 1.42 | 0.38 | −0.31, 1.07 | |||||
| Stroke | −0.09 | −0.93, 0.75 | 0.67 | −0.31, 1.65 | 0.51 | −0.20, 1.22 | |||||
PM10, particulate matter with an aerodiameter of less than or equal to 10 μm.
Estimates are presented as the percent increase in mortality per any 10-μg/m3 increment of PM10 concentration.
The difference is significant at α = 0.05.
Contributing causes of death
We found that the risk of mortality associated with PM10 for all causes doubled by the presence of a secondary diagnosis of pneumonia and positive evidence for modification by coexisting stroke (difference of estimates: 0.53 percent, 95 percent CI: −0.05, 1.11) (table 5).
Contributing causes of death as modifiers of PM10*–all-cause and cause-specific daily mortality associations in 20 US cities between 1989 and 2000
Primary cause of death | Secondary pneumonia | Secondary heart failure | Secondary stroke | Diabetes | ||||||||||||||||||||||||
|---|---|---|---|---|---|---|---|---|---|---|---|---|---|---|---|---|---|---|---|---|---|---|---|---|---|---|---|---|
| Present | Absent | Present | Absent | Present | Absent | Present | Absent | |||||||||||||||||||||
| %† | 95% confidence interval | % | 95% confidence interval | % | 95% confidence interval | % | 95% confidence interval | % | 95% confidence interval | % | 95% confidence interval | % | 95% confidence interval | % | 95% confidence interval | |||||||||||||
| All cause | 0.67 | 0.16, 1.18 | 0.34 | 0.16, 0.52 | 0.42 | 0.01, 0.83 | 0.37 | 0.19, 0.55 | 0.85‡ | 0.30, 1.40 | 0.32‡ | 0.14, 0.50 | 0.57 | 0.02, 1.12 | 0.34 | 0.14, 0.54 | ||||||||||||
| Respiratory disease | 1.28 | −0.33, 2.89 | 0.78 | 0.15, 1.41 | 1.48 | 0.07, 2.89 | 0.79 | 0.26, 1.32 | 1.95 | −0.11, 4.01 | 0.80 | 0.29, 1.31 | 1.96 | −0.22, 4.14 | 0.82 | 0.31, 1.33 | ||||||||||||
| Heart disease | 0.66 | −0.63, 1.95 | 0.49 | 0.27, 0.71 | NA* | 0.73 | −0.05, 1.51 | 0.48 | 0.24, 0.72 | 0.34 | −0.42, 1.10 | 0.52 | 0.28, 0.76 | |||||||||||||||
| Myocardial infarction | 1.54 | −1.05, 4.13 | 0.42 | 0.05, 0.79 | NA | 0.50 | −1.38, 2.38 | 0.36 | −0.05, 0.77 | 0.70 | −0.38, 1.78 | 0.41 | 0.04, 0.78 | |||||||||||||||
| Stroke | 1.74‡ | 0.35, 3.13 | 0.29‡ | −0.16, 0.74 | 1.01 | −0.77, 1.79 | 0.38 | −0.05, 0.81 | NA | 1.02 | −0.53, 2.57 | 0.37 | −0.08, 0.82 | |||||||||||||||
PM10, particulate matter with an aerodiameter of less than or equal to 10 μm; NA, nonapplicable.
Estimates are presented as the percent increase in mortality per any 10-μg/m3 increment of PM10 concentration.
The difference is significant at α = 0.10.
There was about a twofold relative effect modification by heart failure, stroke, and diabetes for respiratory mortality, although the differences in effects were imprecise. No modifying effect of any secondary condition was observed for mortality from heart disease. The risk of mortality from myocardial infarction more than tripled in the presence of secondary pneumonia. This was also true for stroke deaths (difference of estimates: 1.45 percent, 95 percent CI: −0.01, 2.91), and there was a suggestive finding for coexisting diabetes (table 5). Important and suggestive findings are also illustrated in figure 2.
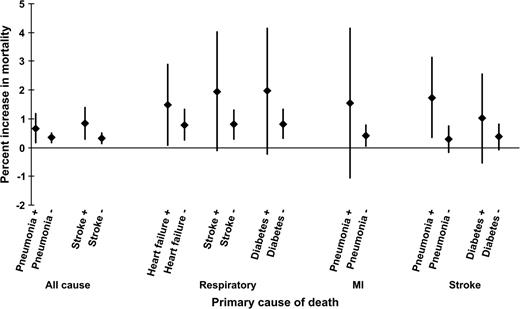
Modification of the mortality–PM10 association by the presence of secondary diagnoses (on the abscissa) for all-cause, respiratory, myocardial infarction (MI), and stroke mortality in 20 US cities between 1989 and 2000. Estimates are presented as the percent increase in mortality per 10-μg/m3 increase in PM10. The presence or absence of a secondary condition is presented by “+” or “−,” respectively. The diamonds represent the percent increase in mortality, and the vertical bars indicate the 95 percent confidence intervals. PM10, particulate matter with an aerodiameter of less than or equal to 10 μm.
Sensitivity analyses
We found no difference in the effects using a similar lag pattern for all-cause and heart disease mortality compared with those of the main analyses. The level of uncertainty due to missing PM10 data in our study results was not important.
DISCUSSION
In a case-crossover design, we assessed modification of the association of PM10 with daily deaths by factors characterized at the individual level, in a study of 20 US cities for a period of 12 years. While a number of studies have examined modification of this association by several factors (5, 13–25), only a few of those have assessed this at the individual level, in a more limited geographic area and time of study (16–25). In the present study, we consider relative effect modification of a factor of two or more as important, and we have found such modification by individual sociodemographic factors, location of death, season, and coexisting medical conditions.
One key finding of this study was the substantial differences in the patterns of association with respiratory mortality versus other causes of death. Unlike all-cause mortality, respiratory mortality showed no difference in effect size estimate across age ranges or educational levels. However, the risk was more than doubled in persons with stroke or diabetes. These differences have not been reported previously. The other findings are discussed by category of effect modifiers.
Sociodemographic factors
As reported previously, older persons were at greater risk for all-cause mortality in association with PM10. The effect in those older than 75 years was more than double that of younger age groups, and that difference was statistically significant. Consideration of specific causes of death provided additional insights that have not been previously reported. There was no trend in the mortality risk with age for respiratory disease, whereas myocardial infarction deaths peaked in the middle age group. Stroke mortality was mainly among those aged over 75 years.
The main modification in the effect of PM10 on mortality from heart disease by gender was the lower effect of PM10 on women under 60 years of age than on men under 60 years, suggesting that hormonal status may play a role in modifying the effect of PM10. This hypothesis has also been suggested in investigations of the long-term effects of particulate matter on atherosclerosis (51).
The study found no evidence that gender or race modified the all-cause mortality–PM10 association or that for broad mortality groups. However, a suggestion of higher risk was seen among females for myocardial infarction and stroke mortality, and Blacks had a higher risk of myocardial infarction deaths and lower risk of stroke deaths.
Previous large multicity studies have examined the role of socioeconomic factors as modifiers of the PM10 effect by use of county-level data, and they found little evidence of modification (4, 5). Our study, with individual-level data on education, showed evidence for an inverse trend, with more than a doubling of effect size in a comparison of low with higher educational level. This is consistent with results reported by cohort studies (52–54). Zanobetti and Schwartz (19) in an earlier study found a smaller difference by educational level; however, they only dichotomized education. The largest change in our data is for persons with less than 8 years of education. Another study with small area-based measures of socioeconomic position in Hamilton, Ontario, found important modification of the particle effects by social class (53, 54). The finding of a twofold difference in risk in our study suggests an important level of modification. This has important implications for social policy and for the US Environmental Protection Agency statuary mandate to set standards that protect sensitive populations.
Factors such as educational attainment, race, gender, and age may represent health status that conveys susceptibility, or they may be predictors of socioeconomic status (19, 55–58). Increased susceptibility to the effects of air pollution due to disadvantaged socioeconomic status may be related to factors such as reduced access to health care, poorer nutrition, or psychological stress and violence. Persons with lower socioeconomic status are more likely to live in poorer and more disadvantaged neighborhoods, with a higher likelihood of exposure as a result of living closer to roadways with increased traffic density and closer to more polluted areas and with a higher likelihood for coexposures due to either living conditions or occupation.
Relatively few studies have examined gender or racial differences in the association of airborne particles with daily deaths. Ito and Thurston (56) in a smaller study found mortality rate ratios associated with high concentrations of PM10 to be greatest among Black women, compared with White women, Black men, and White men. Another study (19) of four US cities reported a slightly higher risk of all deaths for females, which we were unable to reproduce. Such differences by gender may be partly explained by variability in the particle deposition in men and women (59–61).
Our findings for race did not support hypotheses for racial differences in the effects of air pollution, with the higher effects among Blacks, based on the evidence that they represent a more disadvantaged group regarding socioeconomic and health status (62, 63).
Consistent with reports from numerous studies (16, 24, 64–66), our study found higher susceptibility to air pollution among the elderly. Interesting deviations from this pattern were seen for specific causes. In addition to the already noted uniform pattern of respiratory mortality risk versus age, the risk of myocardial infarction in our study peaked in the middle age group (65–75 years of age).
Location of death
The evidence that out-of-hospital deaths carried higher risk supports previous reports of the same nature (24, 25). The difference in the effects of air pollution for the placement of death may reflect true exposure differences. Out-of hospital deaths normally occur at home or in environments where the indoor/outdoor ratio of air pollution concentrations is not as small as may be the case of in-hospital deaths, since most US hospitals use air filtration. This difference may also be due to the accessibility to treatment and alleviation of air pollution effects as a result. Another explanation for this difference may be related to the physiologic/pathologic mechanism of death. Many of the out-of-hospital deaths are sudden deaths, suggesting that particles may play a role in triggering such an event. For example, lower heart rate variability, increased C-reactive protein concentrations in plasma, and decreased plaque stability are risk factors for sudden death that have been associated with particle exposure (67–69).
Effect of season
One new finding in this study is the difference in the particle effects between the transitional seasons (spring/fall) and summer or winter, which could be the results of differences in exposure gradients and particle composition. Sarnat et al. (70, 71) reported that outdoor concentrations of particles were significantly associated with indoor concentrations, but that the slope of the relation varied strongly with ventilation. In particular, the slope was twice as high during periods when windows were open as when these were closed.
Spring and fall are the seasons most likely to have open windows. In summer, air-conditioning use is more common and, thus, there is less ventilation. Winter is also likely to have windows closed. Hence, the observed differences in effect size are consistent with the expected difference in ventilation. Supporting evidence for this hypothesis was reported from Janssen et al. (13), who found that cities with a higher prevalence of air conditioning had a lower effect of particles on hospital admissions, and by Zeka et al. (32), who found a greater effect of PM10 in cities with larger summer temperature variability.
In addition, particle composition also varies seasonally. However, many other factors influence these patterns in different cities, making generalizations difficult. Overall, we believe the contrast likely reflects a gradient in the concentration-exposure relation.
A large study by Peng et al. (72) in an analysis by US geographic regions found strong seasonal patterns in the Northeast (with a peak in summer) and little seasonal variation in the southern regions of the country. Our study could not explore geographic variation because of the limited number of cities included. However, the difference in peak season (summer in the study by Peng et al. vs. transitional season in ours) requires comment. Several differences between the studies may explain the different results. First, in our study, each death is contrasted to control days chosen in the same month as the death. Hence, pollution concentrations for deaths in each city, by design, are compared with only concentrations in the same season as controls. In the analysis of Peng et al., all days of all years are effectively the controls for each day of death, with seasonal variations in death controlled by the use of splines. It is possible that this very different analytical approach leads to differences in seasonal interaction terms. Another difference is that Peng et al. report only seasonal differences for PM10 concentrations the day before. Our examination of seasonal interactions is for a distributed lag model involving 3 days of PM10 exposure. It is possible that the use of 3-day means, rather than single lags, results in a different pattern of effect modification by season.
Contributing causes of death
We found a greater effect of PM10 for all-cause, myocardial infarction, and stroke mortality in the presence of pneumonia. Schwartz (24) reported in 1994 a higher association of particles for all-cause mortality in the presence of coexisting respiratory diseases. Consistent with this finding, Goldberg et al. (16) had reported higher effects of air pollution among those subjects with coexisting lower-respiratory infections.
Coexisting heart failure was not a modifier for all-cause mortality, in contrast to the single-city study reports of Goldberg et al. (17, 18) and Hoek et al. (73). However, persons with congestive heart failure had a twofold risk of respiratory deaths. A previous report by Zanobetti et al. (22) found congestive heart failure to be a modifier of the association of particle and hospital admissions for respiratory disease, adding support to this finding.
Subjects with secondary diagnoses of stroke had more than double the PM10-associated risk for all-cause and respiratory deaths. To our knowledge, this is the first report that persons who have suffered a stroke are at increased risk of PM10-associated deaths due to respiratory or other causes. Whether this represents generally poorer health or suggests a neurogenic component to the association of particles with mortality remains to be explored.
We found about a twofold increase in the effects for respiratory and stroke deaths in the presence of diabetes. Such a finding has not been reported to date, and we think it adds to the general literature that suggests that diabetes may be an important modifier of the effect of particles (20, 21). Of particular interest is a recent paper by O'Neill et al. (40) reporting that only diabetics had impaired vascular function in response to particle exposure.
In summary, this study showed different effects of particulate matter on daily mortality in the presence of individual characteristics that may convey either differences in susceptibility or differences in the likelihood of exposure. Of particular interest are the strong findings for educational attainment; the difference in the effects for women aged more than 60 years versus those younger, suggesting an interaction with menopausal status; and the finding of a seasonal difference. The finding of a significant association with stroke mortality in the elderly and its possible role as an effect modifier are also noteworthy. We think that the study is an important contribution to the evidence on the association between particulate air pollution and mortality and to the identification of subpopulations at highest risk.
Supported by the Harvard Environmental Protection Agency Center (grant R827353) and the National Institute for Environmental Health Sciences (grant ES0002).
Conflict of interest: none declared.
References
Schwartz J, Dockery DW. Increased mortality in Philadelphia associated with daily air pollution concentrations.
Schwartz J. Air pollution and daily mortality in Birmingham, Alabama.
Pope CA 3rd, Bates DV, Raizenne ME. Health effects of particulate air pollution: time for reassessment?
Health Effects Institute. Special report: revised analyses of time-series studies of air pollution and health. Part II. Revised analyses of the National Morbidity, Mortality, and Air Pollution Study. In: Revised analyses of selected time-series studies. Boston, MA: Health Effects Institute,
Health Effects Institute. The National Morbidity, Mortality, and Air Pollution Study. Part II. Morbidity and mortality from air pollution in the United States. Boston, MA: Health Effects Institute,
Katsouyanni K, Zmirou D, Spix C, et al. Short-term effects of air pollution on health: a European approach using epidemiologic time series data. The APHEA Project. Air pollution health effects–a European approach.
Katsouyanni K, Touloumi G, Spix C, et al. Short-term effects of ambient sulphur dioxide and particulate matter on mortality in 12 European cities: results from time series data from the APHEA Project. Air pollution and health: a European approach.
Bateson TF, Schwartz J. Control for seasonal variation and time trend in case-crossover studies of acute effects of environmental exposures.
Bateson TF, Schwartz J. Selection bias and confounding in case-crossover analyses of environmental time-series data.
Schwartz J. Is the association of airborne particles with daily deaths confounded by gaseous air pollutants? An approach to control by matching.
Dominici F, McDermott A, Zeger SL, et al. National maps of the effects of particulate matter on mortality: exploring geographical variation.
Bates DV. Health indices of the adverse effects of air pollution: the question of coherence.
Janssen NA, Schwartz J, Zanobetti A, et al. Air conditioning and source-specific particles as modifiers of the effect of PM(10) on hospital admissions for heart and lung disease.
Katsouyanni K, Touloumi G, Samoli E, et al. Confounding and effect modification in the short-term effects of ambient particles on total mortality: results from 29 European cities within the APHEA2 Project.
Schwartz J. Assessing confounding, effect modification, and thresholds in the association between ambient particles and daily deaths.
Goldberg MS, Bailar JC 3rd, Burnett RT, et al. Identifying subgroups of the general population that may be susceptible to short-term increases in particulate air pollution: a time-series study in Montreal, Quebec.
Goldberg MS, Burnett RT, Bailar JC 3rd, et al. Identification of persons with cardiorespiratory conditions who are at risk of dying from the acute effects of ambient air particles.
Goldberg MS, Burnett RT, Valois MF, et al. Associations between ambient air pollution and daily mortality among persons with congestive heart failure.
Zanobetti A, Schwartz J. Race, gender, and social status as modifiers of the effects of PM10 on mortality.
Zanobetti A, Schwartz J. Are diabetics more susceptible to the health effects of airborne particles?
Zanobetti A, Schwartz J. Cardiovascular damage by airborne particles: are diabetics more susceptible?
Zanobetti A, Schwartz J, Gold D. Are there sensitive subgroups for the effects of airborne particles?
Bateson TF, Schwartz J. Who is sensitive to the effects of particulate air pollution on mortality? A case-crossover analysis of effect modifiers.
Tellez-Rojo MM, Romieu I, Ruiz-Velasco S, et al. Daily respiratory mortality and PM10 pollution in Mexico City: importance of considering place of death.
Goldberg MS. Particulate air pollution and daily mortality: who is at risk?
Zanobetti A, Schwartz J, Dockery DW. Airborne particles are a risk factor for hospital admissions for heart and lung disease.
Nehls GJ, Akland GG. Procedures for handling aerometric data.
Chow JC, Engelbrecht JP, Freeman NC, et al. Chapter one: exposure measurements.
Sarnat JA, Demokritou P, Koutrakis P. Measurement of fine, coarse and ultrafine particles.
Ozkaynak H, Schatz AD, Thurston GD. Relationships between aerosol extinction coefficients derived from airport visual range observations and alternative measures of airborne particle mass.
Zeka A, Zanobetti A, Schwartz J. Short term effects of particulate matter on cause specific mortality: effects of lags and modification by city characteristics.
Schwartz J. The distributed lag between air pollution and daily deaths.
Katsouyanni K, Pantazopoulou A, Touloumi G, et al. Evidence for interaction between air pollution and high temperature in the causation of excess mortality.
Roberts S. Interactions between particulate air pollution and temperature in air pollution mortality time series studies.
Sarnat JA, Long CM, Koutrakis P, et al. Using sulfur as a tracer of outdoor fine particulate matter.
Long CM, Suh HH, Catalano PJ, et al. Using time- and size-resolved particulate data to quantify indoor penetration and deposition behavior.
Rojas-Bracho L, Suh HH, Koutrakis P. Relationships among personal, indoor, and outdoor fine and coarse particle concentrations for individuals with COPD.
Frank R, Tankersley C. Air pollution and daily mortality: a hypothesis concerning the role of impaired homeostasis.
O'Neill MS, Veves A, Zanobetti A, et al. Diabetes enhances vulnerability to particulate air pollution-associated impairment in vascular reactivity and endothelial function.
Maclure M. The case-crossover design: a method for studying transient effects on the risk of acute events.
Lumley T, Levy D. Bias in the case-crossover design: implications for studies of air pollution.
Schwartz J, Zanobetti A, Bateson T. Morbidity and mortality among elderly residents in cities with daily PM measurements. In: Revised analyses of time-series studies of air pollution and health. Boston, MA: Health Effect Institute,
Payton M, Greenstone M, Schenker N. Overlapping confidence intervals or standard error intervals: what do they mean in terms of statistical significance?
Schenker N, Gentleman J. On judging the significance of differences by examining the overlap between confidence intervals.
Steadman RG. The assessment of sultriness. Part II. Effects of wind, extra radiation and barometric pressure on apparent temperature.
Kalkstein LS, Valimont KM. An evaluation of summer discomfort in the United States using a relative climatological index.
Curriero FC, Heiner KS, Samet JM, et al. Temperature and mortality in 11 cities of the eastern United States.
Braga AL, Zanobetti A, Schwartz J. The effect of weather on respiratory and cardiovascular deaths in 12 U.S. cities.
Berkey CS, Hoaglin DC, Mosteller F, et al. A random-effects regression model for meta-analysis.
Kunzli N, Jerrett M, Mack WJ, et al. Ambient air pollution and atherosclerosis in Los Angeles.
Health Effects Institute. Reanalysis of the Harvard Six Cities Study and the American Cancer Society study of particulate air pollution and mortality (a special report of the Institute's Particle Epidemiology Reanalysis Project). Boston, MA: Health Effects Institute,
Jerrett M, Burnett RT, Brook J, et al. Do socioeconomic characteristics modify the short term association between air pollution and mortality? Evidence from a zonal time series in Hamilton, Canada.
Finkelstein M, Jerrett M, De Luca P, et al. A cohort study of income, air pollution and mortality.
O'Neill MS, Jerrett M, Kawachi I, et al. Health, wealth, and air pollution: advancing theory and methods.
Ito K, Thurston GD. Daily PM10/mortality associations: an investigation of at-risk subpopulations.
Gwynn RC, Thurston GD. The burden of air pollution: impacts among racial minorities.
Norris G, Larson T, Koenig J, et al. Asthma aggravation, combustion, and stagnant air.
Bennett WD, Zeman KL, Kim C. Variability of fine particle deposition in healthy adults: effect of age and gender.
Kim CS, Hu SC. Regional deposition of inhaled particles in human lungs: comparison between men and women.
Kohlhaufl M, Brand P, Scheuch G, et al. Increased fine particle deposition in women with asymptomatic nonspecific airway hyperresponsiveness.
Jones CP. Invited commentary: “race,” racism, and the practice of epidemiology.
Krieger N, Williams DR, Moss NE. Measuring social class in US public health research: concepts, methodologies, and guidelines.
Fischer P, Hoek G, Brunekreef B, et al. Air pollution and mortality in the Netherlands: are the elderly more at risk?
Filleul L, Le Tertre A, Baldi I, et al. Difference in the relation between daily mortality and air pollution among elderly and all-ages populations in southwestern France.
Filleul L, Baldi I, Dartigues JF, et al. Risk factors among elderly for short term deaths related to high levels of air pollution.
Pope CA 3rd, Hansen ML, Long RW, et al. Ambient particulate air pollution, heart rate variability, and blood markers of inflammation in a panel of elderly subjects.
Suwa T, Hogg JC, Quinlan KB, et al. Particulate air pollution induces progression of atherosclerosis.
Park SK, O'Neill MS, Vokonas PS, et al. Effects of air pollution on heart rate variability: the VA Normative Aging Study.
Sarnat JA, Brown KW, Schwartz J, et al. Relationships among personal exposures and ambient concentrations of particulate and gaseous pollutants and their implications for particle health effects studies. Epidemiology (in press).
Sarnat JA, Koutrakis P, Suh HH. Assessing the relationship between personal particulate and gaseous exposures of senior citizens living in Baltimore, MD.
Peng RD, Dominici F, Pastor-Barriuso R, et al. Seasonal analyses of air pollution and mortality in 100 US cities.

