
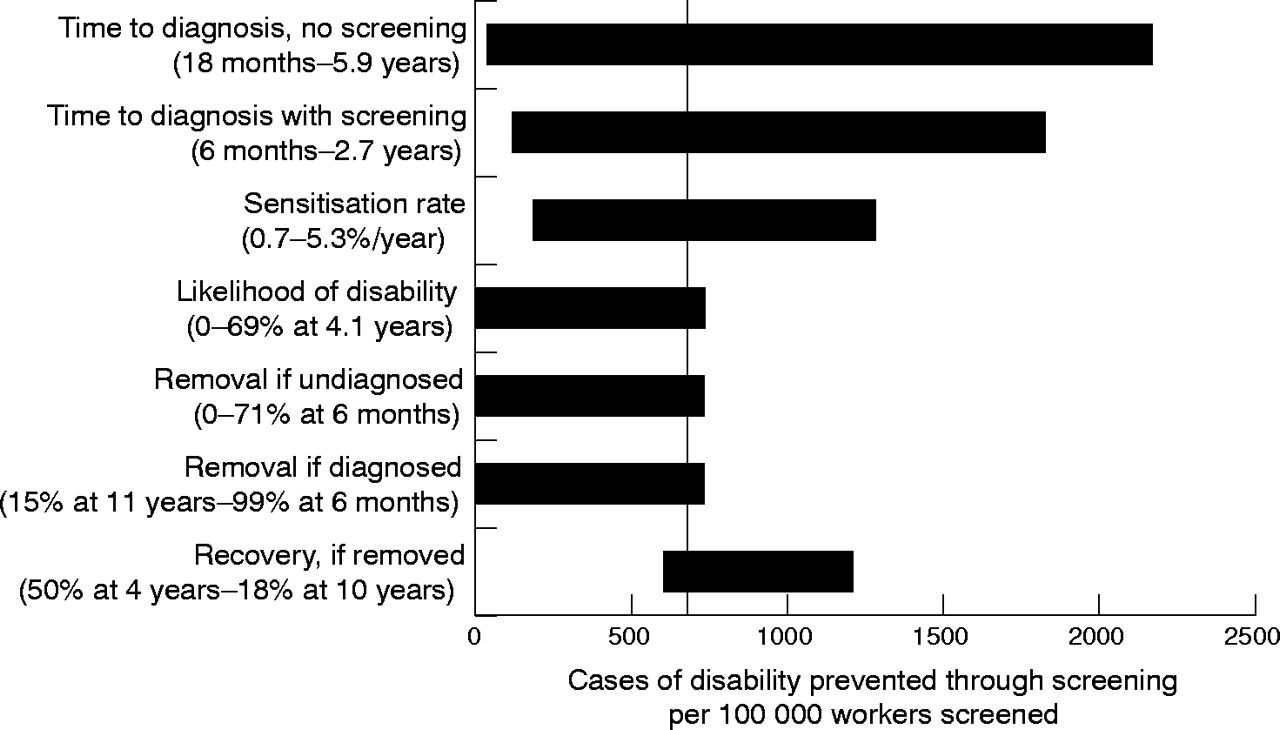
Figure 1
Overview of sensitivity analysis for cases of disability. This “Tornado” diagram summarises a series of one way sensitivity analyses. Each bar represents a model parameter. The vertical axis sits at the base case incremental cost effectiveness estimate (683 cases of disability prevented). The width of a horizontal bar denotes the range of cost effectiveness outcomes produced by varying that parameter over its plausible range.