Article Text

Abstract
Objectives This paper assessed the impact of working in casual employment, compared with permanent employment, on eight health attributes that make up the 36-Item Short Form (SF-36) Health Survey, separately by sex. The mental health impacts of casual jobs with irregular hours over which the worker reports limited control were also investigated.
Methods Longitudinal data from the Household, Income and Labour Dynamics in Australia Survey, over the period 2001–2018, were used to investigate the relationship between the eight SF-36 subscales and workers’ employment contract type. Individual, household and job characteristic confounders were included in dynamic panel data regression models with correlated random effects.
Results For both men and women, health outcomes for casual workers were no worse than for permanent workers for any of the eight SF-36 health attributes. For some health attributes, scores for casual workers were higher (ie, better) than for permanent workers (role physical: men: β=1.15, 95% CI 0.09 to 2.20, women: β=1.79, 95% CI 0.79 to 2.80; bodily pain: women: β=0.90, 95% CI 0.25 to 1.54; vitality: women: β=0.65, 95% CI 0.13 to 1.18; social functioning: men: β=1.00, 95% CI 0.28 to 1.73); role emotional: men: β=1.81, 95% CI 0.73 to 2.89, women: β=1.24, 95% CI 0.24 to 2.24). Among women (but not men), mental health and role emotional scores were lower for irregular casual workers than for regular permanent workers but not statistically significantly so.
Conclusions This study found no evidence that casual employment in Australia is detrimental to self-assessed worker health.
- mental health
- longitudinal studies
- organisation of work
Statistics from Altmetric.com
Key messages
What is already known about this subject?
While conventional wisdom is that temporary work has adverse consequences for worker health and well-being, recent studies that deal with the non-random selection of workers into temporary work have found more mixed evidence.
Studies of the impact of casual employment of mental health in Australia have not found evidence of any negative associations.
What are the new findings?
This study used longitudinal data for Australia over the period 2001–2018 to estimate the relationships between casual employment and all eight health attributes making up the SF-36 Health Survey.
For both men and women, health outcomes for casual workers were no worse than for permanent workers and, in some cases, were better.
Even for the casual jobs that seem ex ante most likely to impact negatively on mental health—jobs with irregular hours where the worker reports having limited control over hours—there was no evidence of any negative impact.
How might this impact on policy or clinical practice in the foreseeable future?
Policy makers contemplating the introduction of regulations designed to limit the spread of casual-like employment contracts should take into account that such interventions may have no positive impacts on worker health.
More research is required to identify whether the findings reported here can be generalised beyond Australia.
Introduction
Temporary forms of employment, such as fixed-term contracts and casual work, are widely regarded as inferior to more regular and ongoing forms of employment.1–4 A particular concern is that such jobs might impact negatively on workers’ well-being, including workers’ health. Such views are supported by existing research reporting positive associations between temporary work and psychological distress, occupational injury rates and exposure to hazards in the workplace, although counterexamples and null findings exist, particularly in relation to physical health.5–7 One mechanism often cited as an explanation for these adverse associations is the impact of job insecurity, an inherent feature of temporary employment contracts, on psychological stress.8–10 Irregular hours, particularly where the worker has little control over work patterns (eg, zero hours contracts), may exacerbate this.11 Health outcomes might also be negatively impacted by disproportionate levels of sickness-related presenteeism among temporary workers given higher levels of underlying insecurity and absence of entitlements to paid sick leave, as is the case for casual workers in Australia. Temporary and casual workers may also be more at risk of work-related injuries and illness, through less exposure to occupational health and safety training, less familiarity with work environments and practices and because they may be assigned tasks where there is greater exposure to work hazards.12–14
Much of the empirical literature, however, relies on cross-sectional data or, where prospective data are used, designs that do not address the non-random selection of workers into different types of employment contracts. As a consequence, findings may be biased by the ‘healthy worker effect’.7 15 In the context of temporary employment, less healthy workers may be less likely to secure and retain a permanent a job and more to likely to select into a temporary or casual job (especially if that job provides the worker with greater flexibility to accommodate their non-work needs). A small group of studies have attempted to address this problem, either by exploiting longitudinal data from household surveys16–21 or by using instrumental variables methods.22 Taken together, these studies suggest no consistent negative association between temporary forms of employment and mental and/or general health. Two of these studies examined the health effects of casual employment in Australia, both using Household, Income and Labour Dynamics in Australia (HILDA) Survey data and both focused on mental health, and found no evidence of a negative association.18 20 Neither study, however, examined the impact of casual employment on any other health outcome. Nor did the longitudinal (or instrumental variables) studies in the wider literature cited above examine health outcomes beyond measures of mental health/psychological distress or single-item measures of general health.
This study examined the association between casual employment in Australia and not only mental health but, to test whether existing null findings for mental health held for other health domains, all eight of the multi-item subscales derived from the SF-36 Health Survey. HILDA Survey data were again used, in this case covering the longer 2001–2018 period. Our analytical approach addressed the potential for unobserved time-invariant confounders and for health to impact on type of employment contract. Finally, given emerging evidence that there may be a negative mental health effect of zero hours contract work in the UK11 and given that the strongest negative associations might be expected for the most precarious examples of casual employment, we examined associations separately for casual jobs that feature irregular hours and where the worker reports having limited control over these hours.
Casual employment in Australia
Among developed nations, Australia is unique because of its reliance on what is arguably one of the most precarious forms of employment—casual employment. Estimates from the HILDA Survey indicate that in 2018 around 19% of all employed persons in Australia (22% of employees) reported being employed on a casual basis, a level that has remained little changed for two decades.23 This prevalence is a by-product of Australia’s extensive system of ‘awards’—legally enforceable industry-wide determinations, made or assented to by industrial tribunals, that set minimum wages and conditions of employment—that have long recognised, and made specific provision for, casual employees.
Casual employment is further encouraged and legitimised by a requirement that all casual employees receive a pay premium. Historically, this premium varied across awards, but with 20% the norm for most of the post-War period. In 2010, new legislation was introduced that imposed a standard minimum casual loading of 21%, gradually increased to 25% by July 2014.24 When originally introduced (in the early 1920s), the casual pay premium (then just 10%) was deemed necessary to compensate casual workers for the inherent insecurity of their employment. Subsequently, however, it came to be seen as a trade-off for the absence of legal entitlement to annual leave and sick leave, paid public holidays, minimum periods of notice of termination and severance pay. This legal framework, coupled with the unusually high prevalence of casual employment in Australia, suggests both that the types of workers entering casual employment and the nature of casual work itself in Australia may differ from other countries.
Despite the pervasiveness of casual work provisions in awards, casual employment has never been defined in those awards. Indeed, it is common for awards to define a casual employee as those ‘engaged and paid as such’.25 Nevertheless, it is generally acknowledged that its key defining feature is the absence of any advance commitment on the part of the employer to both the continuity of employment and the number of days or hours to be worked.26 Note, however, that many casual employees work regular hours for the same employer over long periods.27 28
Methods
Data
The data used came from the HILDA Survey, a longitudinal study that has been following members of a nationally representative sample of Australian households since 2001.29 The initial sample of respondents comprised 13 969 individuals from 7682 households. A refreshment sample was introduced in wave 11 (2011), adding a further 2153 responding households. Sample sizes vary each wave reflecting deaths, non-response and changes in household composition (interviews are sought with all persons aged 15 years or older who are coresiding with an original sample member). Annual reinterview rates, however, are high, rising from 87% in wave 2 to 96% by wave 9 and remaining above that level in every subsequent wave.30
Analytical sample
Data from waves 1–18 (2001–2018) were used. The sample was restricted to working-age individuals (15–64 years) in employment (including self-employment), excluding full-time students. While the principal mode of data collection was personal interview, the outcome variables used here came from a self-completion questionnaire (SCQ), which was not always completed at the time of interview and hence associated with additional non-response; on average, about 90% of interviewees completed and returned this questionnaire each wave.30 This provided an unbalanced panel comprising a maximum of 136 009 observations from 21 016 individuals. The analysis sample was further reduced for statistical analysis—by up to 24%—where missing values for outcome, exposure or control variables precluded inclusion of observations in regression models and because the inclusion of dynamics in the models requires losing the first wave of data for each individual and any observations where the respondent did not return the SCQ in the preceding year.
Outcome variables
The outcome variables were the eight health attributes (multi-item subscales) from the SF-36: physical functioning, role physical, bodily pain, general health, vitality, social functioning, role emotional and mental health.31 Each is expressed as a normalised score ranging from 0 to 100, with higher numbers representing better health. Table 1 presents sample means and 95% CIs for each of the eight attributes, averaged over all waves. Figure 1 shows how these averages have changed over time from 2002 to 2018. Men scored higher than women for seven of the eight subscales (the exception was general health). Four of the eight subscales (bodily pain, mental health, general health and vitality) followed clear downward trends for this sample over this period, suggesting deteriorating health, with no subscale following an upward trend.

Trends in SF-36 health attributes (mean unweighted scores), men and women combined, 2002–2018, analytical sample.
Descriptive statistics: SF-36 health attributes and employment type
Exposure variables
The HILDA Survey collects extensive information about individuals’ labour market state and, for those in work, the job held at the time of each annual interview. All respondents employed at any time in the week prior to interview were asked whether, in their main job, they worked for an employer for wages or salary (employees), in their own business (the self-employed) or without pay in a family business. Employees were then asked to choose one among four categories that best described their current employment contract in their main job: (1) employed on a permanent or ongoing basis; (2) employed on a fixed-term contract; (3) employed on a casual basis; or (4) employed under some other arrangement. The answers to 1–4 were used to define mutually exclusive states for permanent, fixed-term, casual and other employment, respectively. The self-employed constituted a fifth category. Our primary interest was in casual employment, although we also reported estimates for fixed-term employment. Note that the HILDA Survey non-response rate for casual workers averaged over waves 1–18 was no different to that for permanent workers.
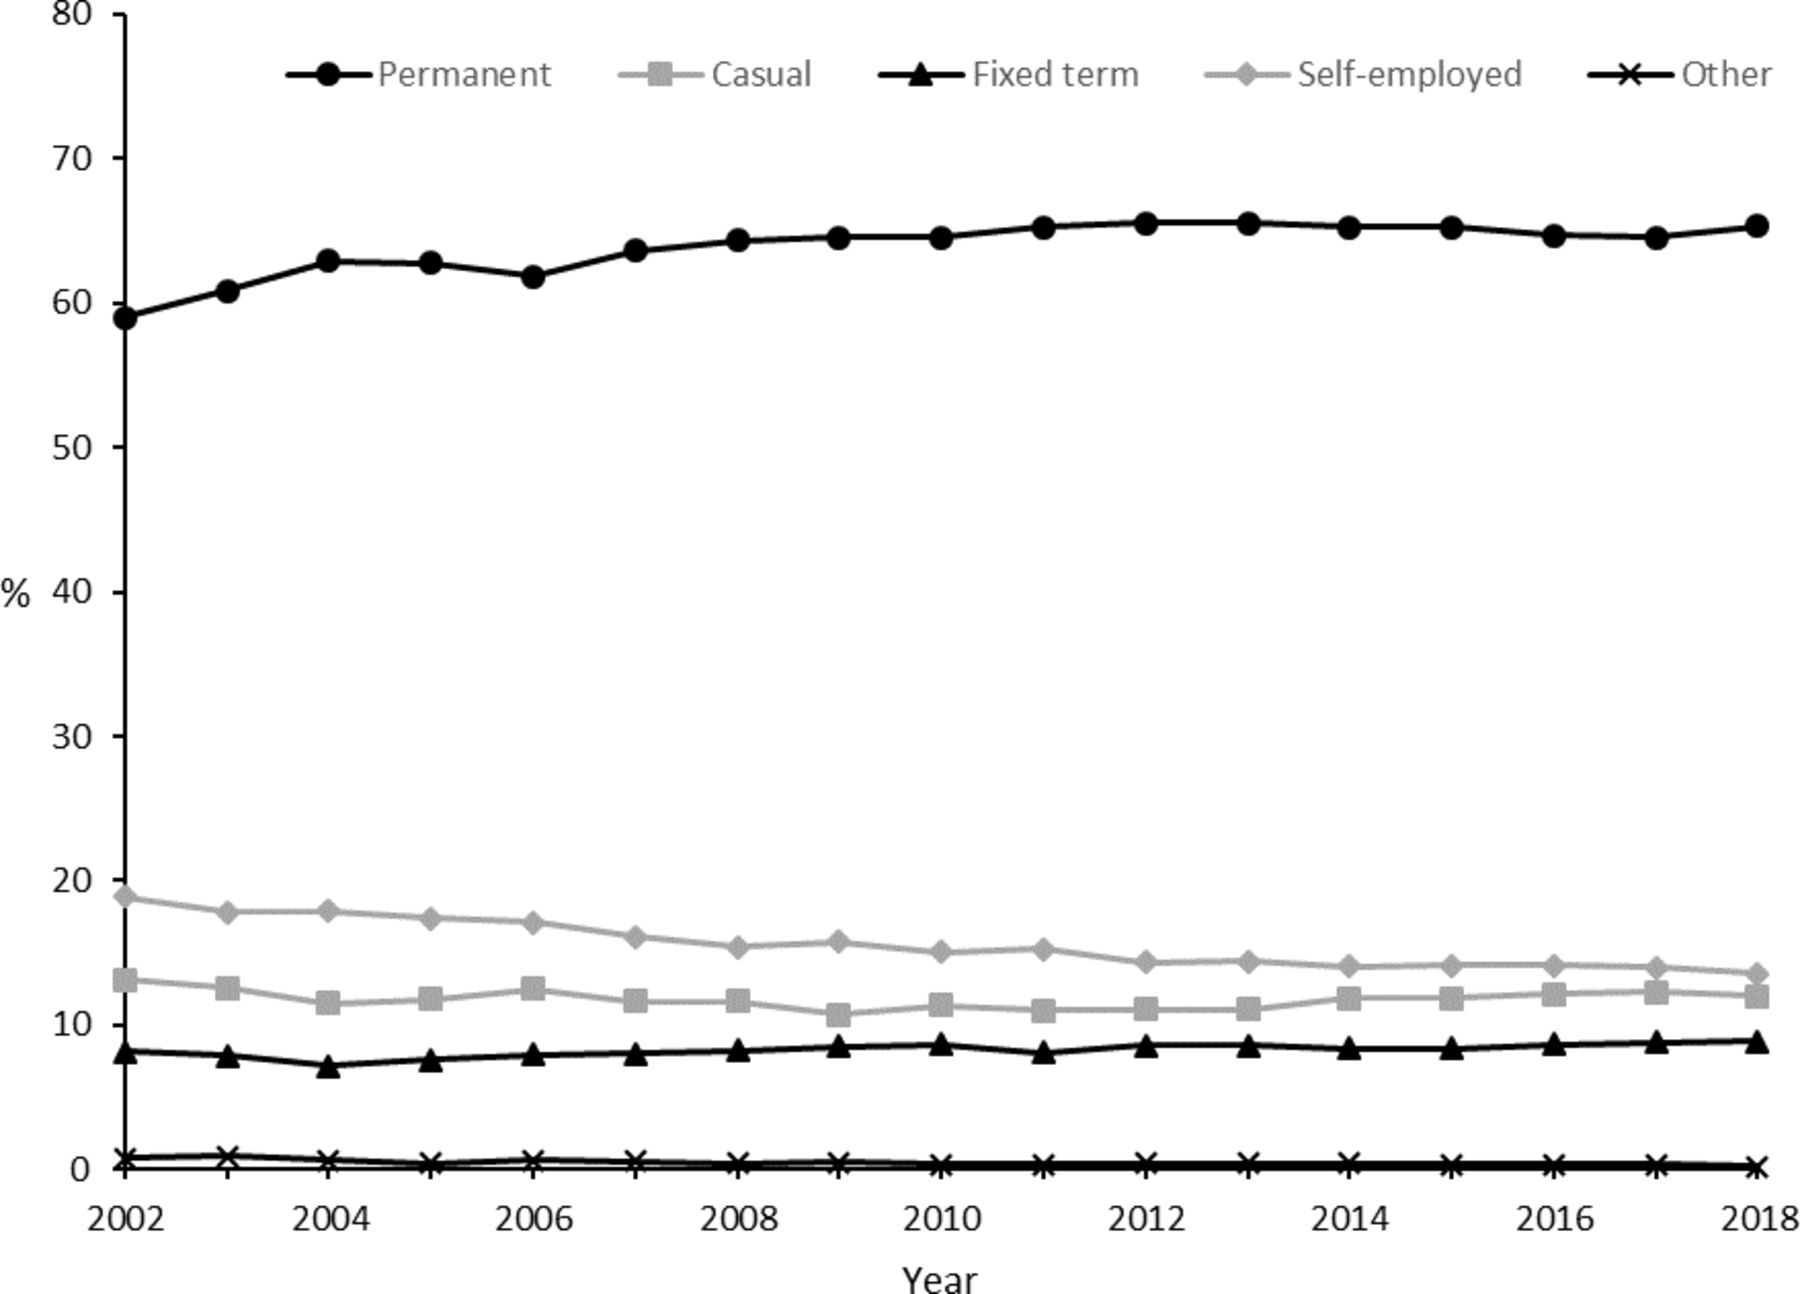
Table 1 presents sample proportions and 95% CIs for each employment type, averaged over all waves. Figure 2 shows how these proportions evolved over time from 2002 to 2018. Note the stability of the casual share. Online supplemental appendix table A1 presents proportions in each employment type by age group, marital status and education level.
Supplemental material
Trends in the distribution of employees by employment type, men and women combined, 2002–2018, analytical sample.
In an extension, we separately identified jobs under each contract type where the respondent reported: (1) working irregular hours or being on-call (not including shift work) in their main job and (2) responded 1–3 on a 7-point Likert scale to the following question: ‘(In my main job) I have a lot of freedom to decide when I do my work’, with 1 denoting ‘strongly disagree’ and 7 ‘strongly agree’. Our primary interest here was in casual employment with irregular hours over which the worker reports limited control. Online supplemental appendix figure A1 shows how these proportions varied across employment types (such irregular jobs were more prevalent among casuals) and how they evolved over time from 2002 to 2018 (with no clear trends shown).
Other variables
The HILDA Survey also collects detailed information on individual and household socioeconomic characteristics. Online supplemental appendix table A2 presents unweighted sample means for the subset of variables used here. These included those used as controls or to stratify the sample in the previous Australian study of LaMontagne and colleagues18: age (five categories), education (three categories) and occupation (eight categories). We supplemented these covariates with 19 (ANZSIC 2006) industry dummies, a quadratic in weekly hours worked, dummies for having a dependent child aged under 15 years in the household and for marital status (partnered/single) and (log real equivalised annual) household income. We also included a set of survey year dummies to control flexibly for common time effects. In sensitivity analysis, we included an additional control for disability and a dummy for non-response in the next wave to account for potentially non-random attrition from the survey.
Analysis
Our starting point was linear regression, using observations from all available waves of the HILDA Survey pooled and treated as a cross-section. This provides estimates of the associations between employment type and health outcomes conditioned on the set of individual, household and job characteristics described previously. These estimates, which show either negative or zero associations between casual employment and health outcomes for both men and women, are presented in online supplemental appendix table A3. They are provided for comparison purposes with earlier cross-sectional studies and not further discussed.
Interpreting such estimates as causal is complicated by the likely presence of endogeneity bias and in an uncertain direction. In particular, employment type may itself be a function of health,17 20 and there may be unobserved confounders correlated with both employment type and health outcomes. To address these concerns, we exploited the longitudinal nature of the HILDA Survey data and: (1) allowed current health status to be a function of health status in the previous period; and (2) accounted for individual-specific time-invariant unobserved heterogeneity by including correlated random effects (within-individual means of time-varying covariates) augmented by initial values (in the first available wave for each individual) of the relevant outcome variable.32 Note that initial wave explanatory variables were omitted from the within-person means.33 This model was then estimated with the generalised least squares random-effects estimator implemented in Stata V. 16.1. The resulting dynamic correlated random effects panel data models were similar in structure, although not identical, to those estimated by Richardson and coauthors.20 All discussion from this point forward is based on this explicitly longitudinal model.
We then repeated this exercise with employment type split by regular and irregular as defined above.
Results
Table 2 presents the estimated coefficients (and 95% CIs) for employment type for all eight SF-36 health attributes, separately for men and women. Full regression results for the baseline case, including all covariates, are presented in online supplemental appendix tables A4.1–A4.8. Key estimates from sensitivity analyses and extensions—including full-time students in the sample, including a dummy for disability as an additional covariate, including a covariate for attrition in the next wave, including the unemployed in the sample with unemployment identified as a separate category, excluding the self-employed and interacting casual employment with dummies for age groups, marital status and education level—are presented in online supplemental appendix tables A5–A10.
Associations between SF-36 health attributes and employment type: dynamic correlated random effects panel data model
Table 2 shows that, for both men and women, health outcomes for casual workers (and fixed-term workers) were no worse than for permanent workers for any of the eight SF-36 health attributes. We therefore conclude that, after conditioning on potential confounders and lagged health, casual employment was not associated with poorer health, nor poorer mental health, for both men and women.
For some of the eight health attributes, health scores for casual workers were instead higher than for permanent workers, indicating better health. At the 95% level of statistical significance, this was the case for seven of the 16 relevant coefficients (eight health attributes, separate estimates for men and women), with no clear pattern of stronger associations for men than for women or vice versa. Specifically, casual workers had higher scores for role physical (men: β=1.15, 95% CI 0.09 to 2.20; women: β 1.79, 95% CI 0.79 to 2.80), bodily pain (women: β=0.90, 95% CI 0.25 to 1.54), vitality (women: β=0.65, 95% CI 0.13 to 1.18), social functioning (men: β=1.00, 95% CI 0.28 to 1.73) and role emotional (men: β=1.81, 95% CI 0.73 to 2.89; women: β=1.24, 95% CI 0.24 to 2.24). These coefficients are not large in magnitude; the two largest—role physical for women and role emotional for men—are only around 6%–7% of a SD in each case, well below conventional thresholds for clinical relevance.34 Note also that there is no evidence of poorer health outcomes for any other contingent employment type relative to permanent; the only associations that are precisely estimated enough to be statistically significant at the 95% level are all positive, and all are for fixed-term employment for women.
These conclusions are qualitatively robust to each of the sensitivity analyses described above: in no case did we find evidence that casual employment was negatively associated with worker health, once we conditioned on potential confounders and lagged health. Similarly, there were no groups by age, marital status or education level for whom casual employment was negatively associated with any of the health outcomes. Neither did adding the unemployed to the sample make any difference to the comparison between casual, fixed-term and permanent employment. Relative to permanent employment and (separately) to casual employment, unemployment was negatively associated with five (three) of the health domains here for men (women), with null associations otherwise. In contrast to an earlier study using HILDA Survey data,35 there was no health outcome for which unemployment was associated with better health compared with any of our categories of employment.
Table 3 presents the estimated coefficients (and 95% CIs) for employment contract type, specifically for mental health (mental health and role emotional), where we split each contract type into regular and irregular hours jobs as defined above. Sensitivity analyses and the unemployment extension, as for table 2, are presented in online supplemental appendix tables A12–A16. Estimates for the other six SF-36 health attributes are presented in online supplemental appendix table A11.
Associations between SF-36 health attributes and regular/irregular employment type: dynamic correlated random effects panel data model
As for table 2, the first point to note from table 3 is that, for both men and women, mental health outcomes for irregular casual workers were no worse than for regular permanent workers. For men, the relevant coefficients were weakly positive (mental health: β=0.62, 95% CI −0.96 to 2.19; role emotional: β=1.91, 95% CI −0.98 to 4.80). For women, the relevant coefficients were weakly negative (mental health: β=−0.96, 95% CI −2.24 to 0.32; role emotional: β=−0.40, 95% CI −3.02 to 2.21). This conclusion is qualitatively robust to each of the sensitivity analyses described above. In no case did we find evidence that irregular casual employment was strongly negatively associated with worker mental health, once we conditioned on potential confounders and lagged health. Also note that no other form of irregular temporary employment was strongly negatively associated with mental health. Nor was irregular casual employment negatively associated with any of the other eight SF-36 health attributes.
Discussion
This analysis shows that Australian workers employed on a casual basis did not have worse health outcomes than comparable workers employed on a permanent contract. Although these findings may come as a surprise to some, they are in line with previous longitudinal Australian research,18 20 with previous longitudinal research on temporary employment and mental health for the UK,16 17 21 and with those cross-sectional studies in the wider international literature finding no evidence of positive association between temporary employment and health outcomes.5
We also expected that any adverse health effects of casual employment would be most pronounced for workers in jobs where working schedules are irregular and where workers have very little control over their hours of work. However, we found no evidence in support of this hypothesis.
If anything, our results suggest that workers in casual jobs have slightly better health outcomes than comparable workers in permanent jobs. This was reflected in marginally superior scores on the role physical, role emotional, social functioning, vitality and, for women at least, bodily pain scales. What could explain this? There is some evidence that Scandinavian-type welfare systems can provide the context for such relationships,36 but Australia’s welfare system is very much in the Anglo-Saxon mould. Another possibility is that employers have lower expectations of some of their casual workers and so place fewer demands on them. Casual work as a result will tend to be less stressful. While this seems a plausible mechanism for explaining differences in outcomes that are related to emotional health, it is far less plausible for explaining the favourable outcomes on scales that are more concerned with physical health. Ultimately, more research is needed to better elucidate the mechanisms driving the results reported here.
Another potential implication of our results is that many workers may not be forced to accept casual employment out of necessity, but instead may voluntarily select into casual employment. An Australian Bureau of Statistics survey, conducted in 2007, reported that 52% of casual employees in Australia would prefer to have leave entitlements, which is often used as proxy for permanent ongoing employment.37 Nevertheless, this still leaves 48% with an apparent preference for their casual job. Furthermore, previous research has reported evidence that casual workers who actively choose casual employment over permanent employment nominate improved health and well-being as a key motivation behind that preference.38 Such behaviour may be particularly likely in Australia given the presence of mandated wage premiums for casual workers. The types of worker entering casual employment in Australia may thus be different to the types of workers entering comparable forms of employment in other countries. Relatedly, given the relatively high incidence of casual employment in Australia, it follows that the type of work being undertaken by casual employees may also be different. As a consequence, it is possible that the results here are specific to Australia and cannot be generalised to other settings.
Other limitations of our study also need to be recognised. The reliance on self-reported health measures might have led to the adverse effects of casual employment being understated if there was a tendency for respondents to understate health symptoms. This might be expected to be especially likely for mental health symptoms given the stigma that is often attached to mental illness.39
We also recognise that while we employed data and methods that attempted to deal with the biases that could arise from confounding unobserved heterogeneity and reverse causation, we still cannot claim causality. This would require an experiment with random assignment, something that would be extremely difficult to implement.
Finally, we acknowledge that we have only touched the surface in addressing the heterogeneity in casual (and permanent) jobs. Casual workers are a very large group in Australia, many of whom have job characteristics that are not dissimilar to permanent workers. It thus may be that negative health effects exist but are concentrated on a small sub-group, the characteristics of which we have yet to clearly identify in our data.
Acknowledgments
This paper uses unit record data from Release 18 of the Household, Income and Labour Dynamics in Australia Survey, conducted by the Australian Government Department of Social Services: doi: 10.26193/IYBXHM.
References
Supplementary materials
Supplementary Data
This web only file has been produced by the BMJ Publishing Group from an electronic file supplied by the author(s) and has not been edited for content.
Footnotes
Contributors DM and MW planned the study. MHH conducted the data analysis. All authors drafted and edited the paper. DM submitted the paper.
Funding DM’s visit to Melbourne for the purposes of this research was funded by the Faculty of Business and Economics, University of Melbourne, Visiting Research Scholar Scheme.
Disclaimer The findings and views reported in this paper, however, are those of the authors and should not be attributed to the Australian Government, DSS or any of DSS’ contractors or partners.
Competing interests None declared.
Patient consent for publication Not required.
Provenance and peer review Not commissioned; externally peer reviewed.
Data availability statement Data may be obtained from a third party and are not publicly available. The data are available on request through the National Centre for Longitudinal Data Dataverse (https://dataverse.ada.edu.au/dataverse/ncld).
Supplemental material This content has been supplied by the author(s). It has not been vetted by BMJ Publishing Group Limited (BMJ) and may not have been peer-reviewed. Any opinions or recommendations discussed are solely those of the author(s) and are not endorsed by BMJ. BMJ disclaims all liability and responsibility arising from any reliance placed on the content. Where the content includes any translated material, BMJ does not warrant the accuracy and reliability of the translations (including but not limited to local regulations, clinical guidelines, terminology, drug names and drug dosages), and is not responsible for any error and/or omissions arising from translation and adaptation or otherwise.