Article Text

Abstract
Objectives Job exposure matrices (JEMs) are increasingly used to estimate physical workplace exposures. We conducted a cross-national comparison of exposure estimates from two general population JEMs to aid the interpretation of exposure–outcome associations across countries and to explore the feasibility of cross-national application of JEMs to provide workplace physical exposure estimates.
Methods We compared physical exposure estimates from two general population JEMs created from the FrenchCohorte des consultants des Centres d’examens de santé study (27 exposure variables) and the American Occupational Information Network database (21 exposure variables). These exposure variables were related to physical demands or ergonomic risk factors for musculoskeletal disorders. We used a crosswalk to match French Profession et Catégorie Sociale job codes with American Standard Occupational Classification job codes and calculated Spearman’s correlations and Cohen’s kappa values for exposure variable pairs between these French and American JEMs. We defined a priori 50 matched French and American JEM variable pairs that measured similar exposures.
Results All variable pairs measuring similar physical exposures demonstrated positive correlations. Among the 50 matched pairs, 33 showed high correlation (ρ≥0.70) and 46 showed at least moderate agreement (κ≥0.41). Exposures expected to be mutually exclusive (manual work vs office work) showed strongly negative correlations.
Conclusions French and American general population physical exposure JEMs were related, sharing moderate to high association and moderate to substantial agreement between the majority of variable pairs measuring similar exposures. These findings will inform cross-national comparisons of study results and support some uses of general population JEMs outside their countries of origin.
- musculoskeletal disorders
- biomechanical exposure assessment
- ergonomics
- epidemiology
This is an open access article distributed in accordance with the Creative Commons Attribution Non Commercial (CC BY-NC 4.0) license, which permits others to distribute, remix, adapt, build upon this work non-commercially, and license their derivative works on different terms, provided the original work is properly cited, appropriate credit is given, any changes made indicated, and the use is non-commercial. See: http://creativecommons.org/licenses/by-nc/4.0/.
Statistics from Altmetric.com
Key messages
What is already known about this subject?
Job exposure matrices (JEMs) have been developed to estimate physical exposures to various occupational risk factors.
JEMs from Denmark, Finland, the USA and France have mainly been applied to study exposure–response relationships within their countries of origin.
What are the new findings?
We conducted a cross-national comparison between two general population physical exposure JEMs developed from data obtained from Cohorte des consultants des Centres d’examens de santé (CONSTANCES), a large prospective cohort study in France (CONSTANCES), and the O*NET database in the USA.
We found that both JEMs were strongly related to each other, sharing moderate to high association, and moderate to substantial agreement between high and low exposure groups of variable pairs measuring similar physical exposures.
French and American JEM variable pairs measuring dissimilar or mutually exclusive physical exposures showed negligible to weak correlations and no agreement between high and low exposure groups.
How might this impact on policy or clinical practice in the foreseeable future?
To the authors' knowledge, this paper serves as the first comprehensive study to directly compare agreements between estimates of physical exposures using JEMs from different countries. Findings from this cross-national comparison suggest that physical exposure–outcome associations based on JEM exposures can reasonably be compared across countries.
Furthermore, our results suggest that these French and American JEMs could be used in similar countries or regions that do not have a JEM, could be used as a starting point for region-specific or cohort-specific JEMs or could complement other exposure methods.
Introduction
Job exposure matrices (JEMs) are commonly used to estimate exposures to various occupational risk factors. JEMs have recently been created in several countries to estimate physical (biomechanical) work exposures such as posture, repetition and force. Compared with other existing physical exposure methods (eg, direct measurement, observation and questionnaires), JEMs can be applied to large population sets, estimate both current and past exposures when retrospective collection of direct measurement is impossible, minimise information bias associated with individual variation in self-reports and are relatively low cost.
JEMs have been shown to be a useful method to produce valid exposure estimates.1 In a recent study, the association between physical exposures and incident carpal tunnel syndrome were significant for both a JEM and individual exposure values based on observation and video assessment.1 Not surprisingly, due to the many advantages in using a JEM, general population physical exposure JEMs have been developed to study the effect of work-related exposures on multiple conditions in Denmark,2–4 Finland,5 6 the USA7–9 and France.10
In Denmark, JEMs were constructed from expert exposure ratings on Danish occupations to evaluate associations between biomechanical exposure and shoulder disorders,2 ulnar neuropathy3 and hip and knee osteoarthritis.4 In Finland, a general population JEM (FINJEM) was constructed from expert ratings for a variety of occupational exposures, including ergonomic and physical factors.5 More recently, a gender-specific Finnish JEM using exposure information from worker self-reports was created in a study of low back disorders.6 In the USA, JEMs based on Occupational Information Network (O*NET) data have been used to examine a broad range of exposures and outcomes, including osteoarthritis7 and carpal tunnel syndrome.8 9 Recently, we created a general population JEM based on self-reported data from Cohorte des consultants des Centres d’examens de santé (CONSTANCES), a large prospective French cohort study.11 In a previous study, we described the construction of this French JEM and found that the JEM created homogenous exposure groups by successfully classifying the exposures of individual workers based on their job titles.10
JEMs are promising tools to estimate physical exposures, but they have mainly been applied to study exposure–response relationships within the same country as the source data. A cross-national comparison will inform whether JEM-based physical exposure data can be compared and applied across countries. There have been few comparisons between different multi-occupation sources of exposure information; the most comprehensive compared two general population JEMs (Finnish and Canadian) for use with multiple chemical exposures,12 while another study compared JEMs (Finnish and Dutch) for occupational carcinogens.13 The objective of this paper was to conduct a cross-national comparison between two physical exposure JEMs: a newly developed French JEM and a well-established American JEM derived from O*NET data. This study will be among the first to directly compare agreement between estimates of physical exposures provided by general population JEMs from different countries.
Methods
The French CONSTANCES JEM
The French JEM for physical exposures has been previously described in Evanoff et al.10 Briefly, this JEM was based on data from CONSTANCES, a large-scale general population cohort study of French salaried workers representing more than 85% of the French working population.11 14 All currently employed participants completed a work exposures questionnaire. Physical intensity was assessed with Borg’s rating of perceived exertion scale, while other exposures were assessed on four-point or five-point ordinal scales assessing the frequency or duration of performing specific actions (online supplementary table 1). Reported job titles were assigned a four-digit Profession et Catégorie Sociale (PCS) job code through an automated coding system.15 16
Supplementary file 1
To produce reliable estimates, we required that each PCS job code had a minimum of 10 valid responses for each of its 27 physical exposures. We grouped PCS jobs with fewer than 10 responses with similar PCS job codes to create adequately sized groups. After job code grouping, the JEM was composed of 27 physical exposures assigned to 407 PCS codes based on the self-reported work exposures of 35 526 CONSTANCES participants.
The American O*NET JEM
O*NET is a publicly available American database that provides information on the physical and mental job demands of more than 800 occupations identified by the US Standard Occupational Classification (SOC) codes (www.onetonline.org). Estimates of job demands in O*NET were provided by expert job analysts and by surveys of workers in different jobs. Physical exposures in O*NET were scored on five-point (levels 1–5) or eight-point (levels 0–7) ordinal scales with exposure-specific descriptive anchors (online supplementary table 1). Scale ratings pertain to the frequency (five-point ordinal scale) or degree (eight-point ordinal scale) of different job demands (online supplementary table 1). O*NET data (V.21.2) provide the mean ratings for each demand for each job title.
Comparison of French and American JEM
We created a new crosswalk to match French PCS codes with American SOC codes based on similarity of work physical exposures (available from the authors on request). We first matched PCS codes with the International Standard Classification of Occupations (ISCO-88) codes. During this step, French job titles were searched using Codage Assisté des Professions et Secteurs d’activité,17 which provided multiple ISCO-88 code options for each PCS code. We also used an existing French autocoding system tool18 to convert PCS codes into three-digit ISCO-88 codes. Guided by the output from these two French coding systems, three investigators with experience in job coding systems (AMD, AD and BE) independently assigned a unique ISCO-88 code to each PCS code, with differences resolved by consensus. We then matched ISCO-88 codes to ISCO-08 codes using an existing cross-walk from the International Labour Organization.19 Finally, ISCO-08 codes were then matched to American SOC codes, using an existing cross-walk from the US Bureau of Labour Statistics (www.bls.gov/soc/). In each of these stages, the investigators selected the best matches based on job tasks if multiple options were available for a single job code and selected the SOC code that best matched the PCS job title in cases where PCS codes were not successfully assigned an ISCO code. This cross-walk process resulted in 239 SOC codes paired with 367 PCS codes. In a final stage, the investigators reviewed all PCS to SOC assignments to ensure comparability of the French and American job titles.
In order to highlight differences and similarities between French and American JEM exposures, we selected O*NET variables a priori that seemed to assess similar exposures to the 27 French CONSTANCES JEM variables. We found matches between one or more of 21 O*NET items and 21 CONSTANCES items, for a total of 50 matched exposure pairs comparing the French with the American JEM-derived exposure estimates (table 1). Six CONSTANCES items could not be matched with an O*NET variable, including four exposures relevant to the upper extremity. In table 1, we list all 27 French JEM physical exposures contained in CONSTANCES (n=367 PCS job codes) and the 21 matching American JEM physical exposures from O*NET (n=239 SOC job codes). Descriptions of each exposure variable, scale and assigned exposure estimates (mean, SD min and max) are shown in online supplementary table 1.
A priori matches of American O*NET JEM exposure variables (n=239 SOC codes) to French CONSTANCES JEM exposure variables (n=367 PCS codes)
We carried out two comparison analyses: Spearman’s rank correlation coefficient to measure correlation and Cohen’s kappa to measure the degree of agreement. We calculated Cohen’s kappa values by dichotomising physical exposure estimates for both French and American JEMs at the median physical exposure level; our Cohen’s kappa calculation therefore indicates the level of agreement in high and low exposure groups between French and American JEM exposures. We grouped both Spearman’s rank correlation and Cohen’s kappa values using conventional interpretations. For instance, Kappa values κ≤0.2 represents slight/no agreement, κ=0.21–0.40 is fair agreement, κ=0.41–0.60 is moderate, κ=0.61–0.80 is substantial and κ ≥0.81 is almost perfect agreement.
All analyses were performed with R statistical software (R Foundation for Statistical Computing, Vienna, Austria).
Results
Spearman’s correlations
Strength and direction of correlation coefficients between 27 French JEM and 21 American JEM exposure variables are represented by a heat map (figure 1). The heat map consists of a matrix of elements with different hues and intensity of colours representing ranges of Spearman correlations. Positive correlations are represented by warm (red) colours, while negative correlations are represented by cool (blue) colours. Correlations closer to zero are represented by neutral shading. Correlation coefficients of each exposure variable pair are presented in a matrix in online supplementary figure 1.

Heat map of Spearman’s correlations between French JEM and American JEM exposures. Similar exposure matches highlighted with black outline. Correlation ranges grouped by conventional Spearman’s correlation interpretations. n=367 PCS codes. CONSTANCES, Cohorte des consultants des Centres d’examens de santé; JEM, job exposure matrix; O*NET, Occupational Information Network. Matched exposure variable pairs outlined with black boxes.
Of 567 total variable pairs, 269 had correlations ρ≥0.50 (moderate positive correlation); 103 pairs had correlations ρ ≥0.70 (high positive correlation). There were 11 physical exposure pairs that had correlations less than −0.70 (high negative correlation). Among these pairs were use keyboard or scanner (French JEM) or use computer screen (French JEM) versus performing general physical activities (American JEM). As expected, these strong but negatively correlated pairs consisted of variables that measured mutually exclusive exposures (eg, manual physical work vs office work).
In figure 1, we emphasised a priori matched exposure variable groups with bold outlined boxes. Of the matched pairs, all matched physical exposures were positively correlated, ranging from ρ=0.27 (reach behind [French JEM] vs cramped work space and awkward position [American JEM]) to ρ=0.83 (physical intensity [French JEM] vs trunk strength [American JEM]). Thirty-three of 50 matched pairs had correlations ρ ≥0.70 (high correlation). O*NET variable cramped work space and awkward positions paired with French JEM variable reach behind had a correlation ρ≤0.30 (negligible correlation). The exposure pairs that led to the highest correlations were related to physical intensity (French JEM) and various strength exposure categories in the American JEM (dynamic strength, static strength and trunk strength). Several variable pairs that were not explicitly matched a priori had correlations greater than 0.70. For instance, handle objects (1–4 kg and >4 kg) and carry loads (<10 kg) had correlations greater than 0.70 with trunk strength.
Overall, these results indicate that the most similar type of exposures from variables in the French and American JEMs showed strong positive correlations, dissimilar exposure variables showed weak relationships and exposures expected to be mutually exclusive showed strong negative correlations.
Cohen’s kappa
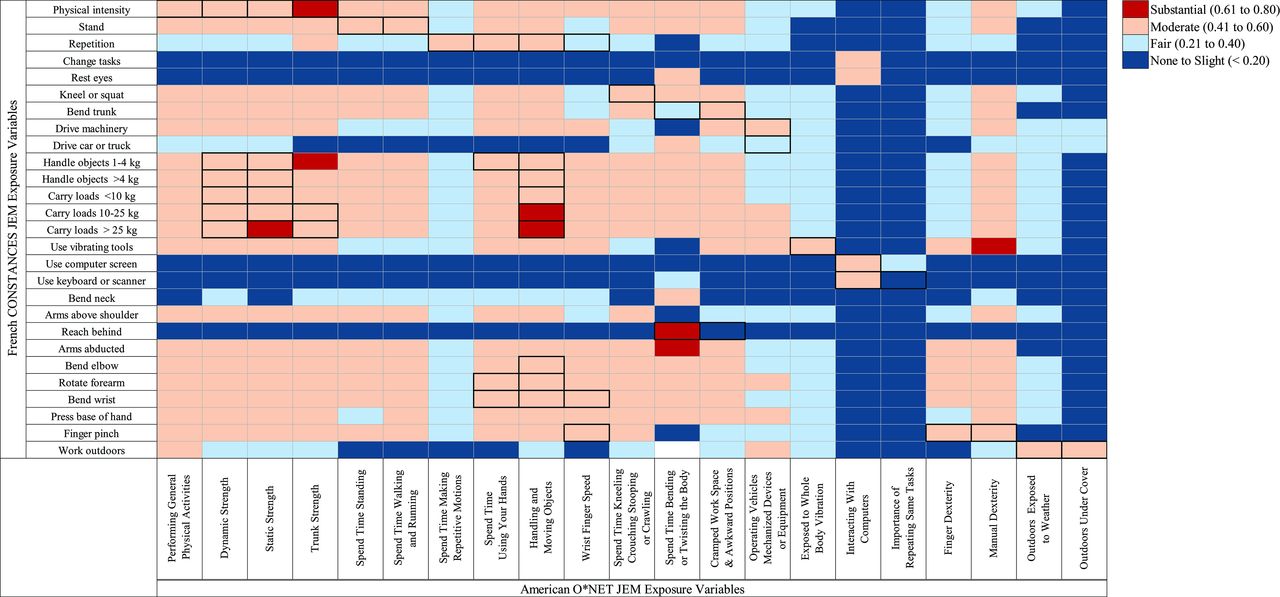
We created a heat map to represent the kappa values between 27 French JEM physical exposure variables and 21 American JEM variables (figure 2). Kappa (κ) indicates the level of agreement in high and low exposure groups between French JEM exposures and American JEM exposures after dichotomising exposure estimates at the median exposure level. In figure 2, different colours represent the strength of the paired relationships, where darker shades indicate stronger agreement. There were no kappa values that exceeded κ=0.62. Of the 567 pairs, 246 pairs had kappa agreements greater than moderate agreement, while 194 pairs showed slight/no agreement. Kappa values for all exposure variable pairs are presented in a matrix in online supplementary figure 1.

Heat map of Cohen’s kappa agreement values between French and American JEM exposures. Similar exposures are matched and highlighted with a black outline. Kappa ranges based on conventional Cohen’s kappa interpretations. n=367 PCS codes. CONSTANCES, Cohorte des consultants des Centres d’examens de santé; JEM, job exposure matrix; O*NET, Occupational Information Network; PCS, Profession et Catégorie Sociale. Matched exposure variable pairs outlined with black boxes.
Similar to Spearman’s correlations, we outlined the 50 matched variable pairs in figure 2. Among all matched variable pairs, the kappa values ranged between κ=0.13 (reach behind [French JEM] and cramped work space and awkward positions [American JEM]) and κ=0.62 (physical intensity [French JEM] and trunk strength [American JEM]). We observed that 46 of 50 a priori matched exposure pairs showed moderate to substantial agreement in assignment of high versus low exposure level.
Exposure pairs that indicated no agreement were observed with variable pairs that measured dissimilar exposures, including reach behind (French JEM) and outdoors exposed to weather (American JEM) (κ=0.02), as well as drive car or truck (French JEM) and spend time standing (American JEM) (κ=−0.02).
Discussion
This study found moderate to high positive correlations and moderate to substantial agreement between similar exposure variables when comparing two general population JEMs for workplace physical exposures. The French JEM was created by pooling self-reported physical exposures at the job level from a large general population cohort study; the American JEM used data from O*NET, a national database reporting job demands obtained by self-report and through expert assessment. Collectively, these results suggest that exposures assessed by these two different JEMS were related. To our knowledge, this study is among the first to comprehensively compare the agreement between estimates of physical exposures from JEMs created in two different countries.
Comparisons of exposure estimates from different countries can improve our understanding of exposure–outcome relationships and explain variation in their findings. JEMs that can be applied cross-nationally may also enable multinational studies of associations between workplace exposures and diseases, and inform region-specific or cohort-specific JEMs.12 Cross-national comparisons of JEMs could also provide additional exposure data to complement existing national JEMs that might lack particular exposures.20
There is a growing interest in cross-national comparisons between JEMs. Liu et al 21 reviewed JEMs for exposures to radioactive materials from four countries; however, since all these JEMs were study specific or cohort specific, direct comparisons between JEMs proved to be challenging. General population JEMs are more likely to be comparable. Comparisons of general population JEMs have been performed between Finnish and Canadian JEMs for workplace chemical agents. In Lavoué et al,12 the authors observed moderate to very good agreement of exposure estimates of several agents between these two JEMs. Similarly, Offermans et al 13 found low to good agreement between two Dutch JEMs and a Finnish JEM for exposure to asbestos and other carcinogens.
To date, there are few comprehensive cross-national comparisons of JEMs for physical workplace exposures. A prior comparison of Danish, American and French expert-rated JEMs showed fair to good associations for a variety of workplace physical exposures.22 For example, when compared with the expert-rated French ‘MADE’ JEM, there were good associations (ρ>0.70) for force, computer work and kneeling, and fair associations (ρ=0.50–0.6) for repetition and vibration. These reported associations were consistent with our study’s observations for exposures of force (ρ=0.81–0.82), kneeling (ρ=0.76) and repetition (ρ=0.63).
Generally, we found the strongest correlations and agreement between French and American JEM exposures related to force, particularly whole body high forceful exertions (eg, carrying/handling various loads [French JEM] vs static strength [American JEM]: 0.75≤ρ≤0.82, 0.59≤κ≤0.61). Several explanations exist for these stronger associations. The exposure estimates in both JEMs may be similarly distributed; both general population JEMs were created from jobs within industrialised countries where exposures related to heavy lifting and forceful exertions have lower mean scores at the population level. In 2017, 39.7% of the US labour force were employed in management and professional occupations, while 11.7% of the labour force were employed in production, transportation and material moving work.23 These work demographics are comparable with the French labour force, as 34.3% of CONSTANCES participants were employed in executive and higher intellectual professions and 10.5% were manual workers.10 Stronger correlation and agreement have been observed between self-reported and expert observations for maximum force compared with posture, repetition and movement velocity.24 Showing agreement between similar exposures between JEMs suggests the possibility of using data from one to complement existing data in another. For instance, the French JEM contains more exposures that are specific to forceful hand use than the American O*NET JEM. Previously, the O*NET JEM was combined with online supplementary information from other data sources to study physical and psychosocial exposures among hospital workers.25 In a similar fashion, adding data elements from the French JEM to the American JEM could strengthen associations between work exposures and upper extremity disorders, where the French data contain relevant exposures that are not contained in O*NET.
Along with the strengths of our study, there are several limitations. Our cross-walk involved a multistep process (PCS→ISCO-88→ISCO-08→SOC) in order to match French PCS codes with American SOC codes. Although existing software programmes and tools assisted in the assignment of job codes, selections included some level of subjective opinion, possibly leading to differential or non-differential misclassification that may have affected the observed levels of correlation and agreement. If the cross-walk process was performed by another research group, different matches between PCS and SOC codes might occur.
Our analyses were performed at the level of the job title; each of 367 PCS codes was weighted equally in the analysis. The levels of correlation and agreement may be different from those observed in this study if they are applied to different working populations with varying distributions of workers in each job. Questions within CONSTANCES and O*NET measured similar but not identical constructs and used different ordinal scales with different ranges and anchors. Most CONSTANCES scales measure the duration of exposures defined by frequency or intensity, while O*NET scales represent the magnitude of exposure or the frequency of an exposure. As expected, we did not observe perfect correlations, but when French and American JEM variables were matched and grouped based on similar exposures, the majority of matched pairs were highly correlated. The levels of correlation and agreement were quite high given the differences in scales and questions between the two JEMs.
We used Cohen’s kappa statistic to calculate the level of agreement in high and low exposure groups between French JEM and American JEM variables. Exposures were dichotomised at the median exposure estimate, a common practice to define high and low exposed in JEMs.6 26 However, dichotomisation may have led to lower measured agreement than using the full range of data. Also, the selection of the cut-off point remains arbitrary and may not equally optimise the specificity and sensitivity of all exposures.26 Raising or lowering the cut-off point may lead to differential effects on uncommon and common exposures.6 For instance, Solovieva et al 6 ,6 found that lowering the cut-off point to 40% in their physical exposure JEM resulted in a gain in sensitivity without loss of specificity for uncommon exposures (eg, whole body vibration) but a gain in sensitivity and loss of specificity for common exposures (eg, heavy physical work). Further analysis to determine optimal cut-off points in the French and American exposure estimates will aid the interpretation of exposure–outcome associations obtained using JEM exposures.
The majority of the 50 variable pairs matched a priori based on common exposures showed high correlation and at least moderate agreement. We also saw high correlation or agreement between a number of unmatched variable pairs. These exposures likely covary as they occur in highly physically demanding jobs. For instance, we observed high correlation and agreement between handle objects 1–4 kg and trunk strength. Handling objects and carrying loads are complex multijoint dynamic activities that require trunk strength; these demands would co-occur in jobs requiring manual material handling. Exposure variables that were mutually exclusive (eg, use computer screen/use keyboard or scanner vs performing general physical activities) showed high negative correlation and low agreement.
Overall, our results suggest that physical exposure estimates can be applied from the French JEM to the American JEM, and vice versa. Further cross-national comparisons with other available physical exposure JEMs will further inform this rapidly expanding area of occupational disease epidemiology. Future work will also evaluate the ability of different JEMs to reproduce known exposure–response associations obtained with other exposure assessment methods.
Conclusion
We conducted a cross-national comparison between physical exposure estimates of a general population French JEM, based on individual self-reported data, and a general population American JEM, based on a hybrid of methods. We demonstrated that these JEMs were strongly related to each other, sharing high correlations and moderate agreement between the majority of variable pairs that measured similar exposures. Our results suggest that French and American JEMs may be suitable for use in countries or regions without available general population workplace physical exposure data and may complement existing JEMs that might lack particular exposures.
References
Footnotes
AD and AMD contributed equally.
Contributors BE, AD, YR and AMD designed the study, obtained funding and reviewed and edited the paper. MY and BE made significant contributions to the data visualisation, writing and formatting of this manuscript. SB-P and MB were the primary data analysts and made significant contributions to the visualisations. JHA made significant contributions to the conceptualisation and reviewed and edited the paper.
Funding This study was supported by research funding from the American National Institute for Occupational Safety and Health (NIOSH R01OH011076). The French CONSTANCES Cohort is supported by the French National Research Agency (ANR-11-INBS-0002), Caisse Nationale d’Assurance Maladie des travailleurs salariés-CNAMTS and is funded by the Institut de Recherche en Santé Publique/Institut Thématique Santé Publique and the following sponsors: Ministère de la santé et des sports, Ministère délégué à la recherche, Institut national de la santé et de la recherche médicale, Institut national du cancer et Caisse nationale de solidarité pour l’autonomie, as well as Institute for research in public health (IReSP, CapaciT project).
Disclaimer The content is solely the responsibility of the authors and does not necessarily represent the official views of the NIOSH, nor the sponsors of the CONSTANCES project.
Competing interests None declared.
Ethics approval Washington University in St Louis, USA.
Provenance and peer review Not commissioned; externally peer reviewed.
Patient consent for publication Not required.