Article Text

Abstract
Background and aims Residents near industrial areas are exposed to several toxins from various sources and the assessment of the health effects is difficult. The area of Civitavecchia (Italy) has several sources of environmental contamination with potential health effects. We evaluated the association between exposure to pollutants from multiple sources and mortality in a cohort of people living in the area.
Methods All residents of the area in 1996 were enrolled (from municipal registers) and followed until 2013. Long-term exposures to emissions from industrial sources (PM10) and traffic (NOx) at the residential addresses were assessed using a dispersion model. Residence close to the harbour was also considered. Cox survival analysis was conducted including a linear term for industrial PM10 and NOx exposure and a dichotomous variable to indicate residence within 500 m of the harbour. Age, sex, calendar period, occupation and area-based socioeconomic position (SEP) were considered (HRs, 95% CI).
Results 71 362 people were enrolled (52% female, 43% low SEP) and 14 844 died during the follow-up. We found an association between industrial PM10 and mortality from non-accidental causes (HR=1.06, 95% CI 1.01 to 1.12), all cancers (HR=1.11, 95% CI 1.01 to 1.21) and cardiac diseases (HR=1.12, 95% CI 1.01 to 1.23). We also found an association between NOx exposure from traffic and mortality from all cancers (HR=1.13, 95% CI 1.01 to 1.26) and neurological diseases (HR=1.50, 95% CI 1.01 to 2.20). Living near the harbour was associated with higher mortality from lung cancer (HR=1.31, 95% CI 1.04 to 1.66) and neurological diseases (HR=1.51, 95% CI 1.05 to 2.18).
Conclusions Estimated exposures to different pollution sources in this area were independently associated with several mortality outcomes while adjusting for occupation and socioeconomic status.
- cohort study
- dispersion model
- industrial pollution
- mortality
- occupational exposure
This is an open access article distributed in accordance with the Creative Commons Attribution Non Commercial (CC BY-NC 4.0) license, which permits others to distribute, remix, adapt, build upon this work non-commercially, and license their derivative works on different terms, provided the original work is properly cited, appropriate credit is given, any changes made indicated, and the use is non-commercial. See: http://creativecommons.org/licenses/by-nc/4.0/.
Statistics from Altmetric.com
Key messages
What is already known about this subject?
Previous epidemiological study carried out in the industrial area of Civitavecchia indicated increased mortality and morbidity among workers and residents (including children).
However, data about individual exposure to pollutants from the different sources were not available.
What are the new findings?
The baseline address of residence for each subject was geocoded and it was possible to assess the individual exposure to the different pollutant sources.
Dispersion models were used to estimate individual exposure and the confounding effect of occupational exposure and socioeconomic status was taken into account.
We found an association between industrial PM10 and mortality from non-accidental and cardiac causes.
In addition, there was a link with pancreatic, pleural and kidney cancer.
Neurological diseases mortality was associated with road traffic estimated with NOx and harbour proximity.
People living close to the harbour showed increased risk for lung cancer mortality.
How might this impact on policy or clinical practice in the foreseeable future?
The results indicate the need to limit industrial (PM10) and road traffic (NOx) emissions to protect the health of the local population.
Introduction
Residents of the area of Civitavecchia (northern coast of Rome, Lazio region) have been exposed to various sources of environmental contamination, including a large industrial site (a cement factory, and three thermoelectric power plants), vehicular traffic (with diesel truck traffic) and a large harbour. Previous studies carried out in this area have shown high risks for respiratory diseases and lung cancer both among workers1–4 and residents.5–7
Recent investigations8–10 have used dispersion models to assess population exposure, an approach that provides a better assessment than studies based on simply the distance from the source, especially when used in combination with a residential cohort study.11
We aimed to evaluate the long-term effects on mortality of exposures to industrial sources, urban traffic and vicinity to the harbour in a cohort of people living in the area of Civitavecchia. Dispersion models were used to assess exposure and the confounding effects of occupational exposure and socioeconomic status were considered.
Methods
Air pollution sources
Three thermoelectric power plants were located in the study area: Fiumaretta, Tor Valdaliga South (TVS) and Tor Valdaliga North (TVN). The Fiumaretta power plant, which closed in 1990, was located very close to the Civitavecchia city centre. It began operating in 1953 as a coal-fired plant producing 70 MW of power; later the fuel was changed to oil and in 1969 the power was increased to 460 MW. The TVS power plant is located about 4 km of the town centre. It has been active since 1964 as an oil-fuelled plant producing 1140 MW of power; it was recently converted to a gas-fuelled plant. The TVN power plant is located about 5 km of the town centre, near the TVS; it has been active since 1984 producing 2640 MW of power; it was converted to a coal-fired power plant in 2010. Emissions from the power plants include particulate matter (PM), nitrogen oxides (NOx) and sulfur dioxide (SO2).
A cement factory (6500 m2) was active from the turn of the century until the ‘90s in the town of Civitavecchia. SO2, NOx and total suspended particle levels showed high values in the 1980s, but they started to decrease during the early 1990s.
All the plants under study identified by their chimney coordinates were geocoded using the World Geodetic System of 1984 with the Universal Transverse Mercator zone 33 Nord projection (WGS84_UTM33N).
The Civitavecchia harbour (241 000 m2, 26 operational piers, 23 berths for up to 100 m yachts) has been traditionally used for ferry traffic, merchant ships and tankers. The improvement of docks and structures for passengers over the years allowed for an extraordinary increase of cruise ships (from 50 ships in 1996 to 950 in 2013) and ferries (1500 yearly) with an annual average number of passengers reaching up to 4 million in recent years. Environmental surveys indicate that dusty material (around 500 000 tons/year) is the main source of pollution from the harbour, causing increased dust dispersion in the air when the goods are transferred from container to trucks. Another source of pollution from the harbour is the traffic from industrial vehicles and ferries: ships and ferries use a large amount of fuel containing high sulfur levels (up to 2.9%), and produce substantial quantities of sulfur oxides and particulates.
In addition to the pollution produced by the industrial plants and the harbour, air quality in the area has been affected by traffic, mostly diesel vehicles. In 2012, a total of 84 000 vehicles per day (65 000 cars, 6000 trucks, 13 000 motorcycles) were estimated in the area with a large component of vehicles in transit due to the harbour, especially during the summer.
Exposure assessment
We used a Lagrangian particle dispersion model called SPRAY (www.aria-net.it) to simulate the spatial concentration of PM10 as a surrogate measure of contaminants emitted by the industrial plants. The SPRAY model simulates the transport, dispersion and deposition of pollutants using orography, meteorological data, turbulence and hourly spatial distribution. A PM10 concentration value was estimated for each of the four industrial sources (three power plants and the cement factory) using emission parameters from 1988.12 Annual average emissions were estimated for each 500×500 m cell in a domain of 50×50 km2.
We did not have historical information about airborne emissions from harbour activities. Therefore, the linear distance between the subject address and the perimeter of the harbour was considered as proxy of the exposure to harbour pollution. We considered all residents exposed who lived in the 500 m buffer from the harbour.
Outdoor concentrations of NOx at the residential address of the cohort participants were estimated as tracers of urban traffic pollution. Data for dispersion model simulations were estimated from two road traffic measurement campaigns (winter and summer 2014) made in a sample of major traffic roads selected from the Functional Road Class attribute (FRC=1–5) (included in the Tele Atlas MultiNet road network). The sampling points were chosen according to the population density in the area. The number of heavy and light vehicles in transit in 15 min periods on each road was collected to estimate the annual flow by category (light and heavy). This number was multiplied by the length of the road (in km) and the emission factor, which depends on the pollutant and the type of vehicle. Measurement campaigns were not available for the highway (FRC=0) and the annual traffic flow by category was estimated considering weekly data available from the National Autonomous Roads. The results of the simulations carried out for light and heavy traffic were then added to estimate the total concentrations. Annual average emissions were estimated for each 500×500 m cell in a domain of 50×50 km2.
Emission data of industrial and traffic pollution from PM2.5 were not available.
Enrolment of the cohort and health outcomes
All residents (18+ years) living in the area on 1 January 1996 were enrolled in the cohort. For each subject, personal data, baseline address of residence geocoded using the ArcGIS software address, date of immigration (and eventual emigration) and vital status were available. The follow-up for vital status was carried out through the municipal registry and record linkage with the regional mortality database, which includes all deaths of the resident population. Vital status for people who moved outside the study area in the period 1996–2013 was recorded via linkage with the Regional Health Management file. Subjects were considered at risk until they died, moved outside the Lazio region, or until the last day of the follow-up (31 December 2013).
We analysed non-accidental and cause-specific mortality. We considered causes of death for which there was some plausible association with environmental and occupational factors (ICD-9 codes in online supplementary appendix 1) and we did not consider accidental mortality. Each subject in the cohort was assigned a baseline value of pollutant exposure corresponding to the estimated map values of their residence.
Supplemental material
Occupations and other confounders
Each cohort participant was linked to the National Pension Fund database, which includes information on individual jobs with private employment companies since 1974. We identified ever employment in the service industry, construction industry, construction product (cement factory), agriculture, mechanical constructions, iron and steel industry, naval construction, dock worker, transportation, gas and electric industries and manufacture of refined petroleum products based on the mandatory contribution paid for at least 1 year before enrolment.
We considered age, sex, birthplace (North, Centre, Lazio region, South Italy, outside Italy) and a socioeconomic position (SEP) index (high, medium, low). SEP is a small area index based on the census block (around 500 inhabitants) and defined based on information recorded at the 2001 census.13
Statistical analysis and measures of association
We measured person-time at risk for cohort participants from the beginning of follow-up (1 January 1996) to the end of follow-up (31 December 2013), or to the date of emigration, or death. Person-time was calculated separately by sex, age and calendar period. We used gender-specific Cox proportional hazard regression models (HRs and 95% CI) to study the association between air pollution and the study outcomes, with age as the underlying time variable. To consider possible time-related changes in mortality rates during the study period, the analyses were performed stratifying by calendar period (1996–2001; 2002–2007; 2008–2013).
Exposures to PM10 from industrial sources and to NOx from traffic were modelled as a fixed continuous variable using the annual mean exposure at residence. Because of the varying magnitude of the exposure indicator, a linear association was estimated for an increment equal to the difference between the 95th and the 5th percentiles of the distribution of each pollutant. A dichotomous variable was used to indicate residence within 500 m of the harbour.
Potential confounders considered were region of birth, SEP, occupational exposure and other environmental exposures besides that under study. In order to disentangle the role of each exposure, we performed single and multivariate model for the environmental exposures. Furthermore, we explored the form of the exposure–response relationship between environmental exposures and outcomes by using a semiparametric smoothed curve, the natural spline.14
We performed a model for each occupational category for male employees. We estimated HRs and included in the models the environmental exposures under study, birthplace, SEP, blue-collar (yes or no), and a four-level variable was considered: private sector employment (in any of the following: construction industry, cement factory, agriculture, mechanical construction, iron and steel industry, naval construction, dock worker, transportation, gas and power industries and manufacture of refined petroleum products), workers in private service industry (including commerce), workers in other private sectors and no private workers (people for whom it was not possible to find pension contributions from the private sector). Workers in private service industry (including commerce) were considered as reference category.
SAS version 9.2 (SAS Institute) and STATA vers.12 (StataCorp, Texas) software programs were used for the statistical analyses.
Results
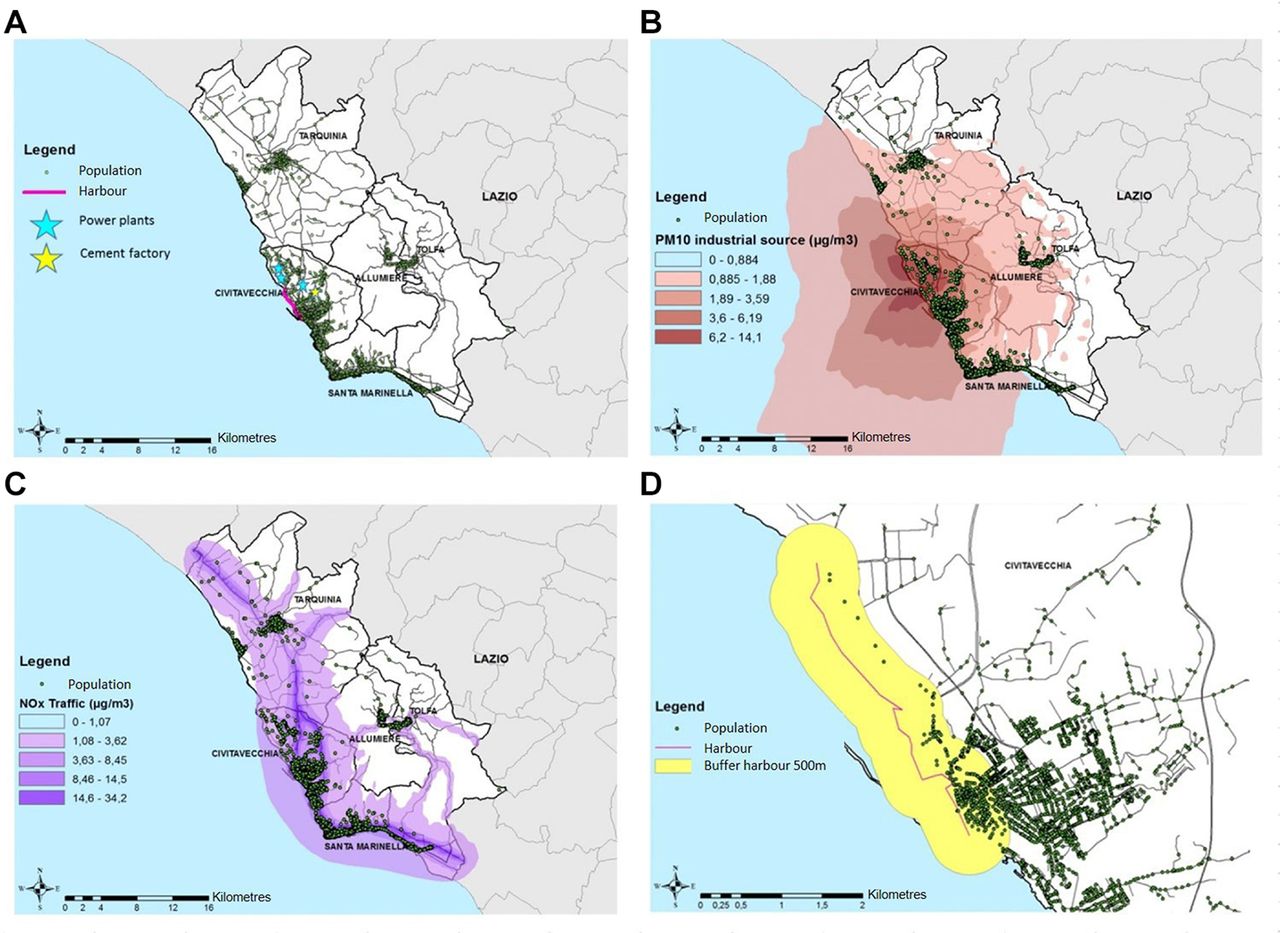
Figure 1 illustrates the study area (A) and air pollution from different sources: PM10 industrial concentration (B), urban traffic NOx (C) and the harbour with the 500 m buffer (D).

Study area (A) and results of the dispersion model from PM10 (B), NOx (C) and harbour and buffer of 500 m (D).
A total of 71 362 individuals were enrolled in the cohort in 1996 (52.3% female) and baseline concentrations of PM10 from industrial sources and NOx from traffic were estimated for each of them at their residential address. We considered total industrial PM10 concentration because of the proximity to the thermoelectric plants and cement plant and the high correlations among pollutant concentrations estimated from the single sources (online supplementary figure S1). Annual average exposure levels of the population (mean (SD, 50th percentile, 95th-5th percentile)) to PM10 of industrial origin were 4.49 µg/m3 (1.97, 4.27, 5.49), and 5.80 µg/m3 (3.86, 5.17, 12.77) for NOx. Few subjects (6.5%) lived within 500 m of the harbour.
The main characteristics of the subjects according to exposure to PM10 from industrial sources, to NOx from traffic (divided by <5th, 5th-95th, >95th percentile cut-offs) and distance from the harbour (≤500 m, >500 m) are described in table 1. Sex distribution was rather similar over the environmental exposure categories. However, people living in areas with higher concentrations of PM10 or NOx were more likely to be younger and have a lower SEP compared with people living in areas with lower concentrations of pollutants. People who lived closer to the harbour were more likely to have been born in South Italy and to be of lower SEP compared with those who lived far away. Almost 40% of the people in the cohort (18 299 men and 10 047 women) had pension contributions for at least 1 year before enrolment. The prevalent occupational category was the service industry (12 934) while 5073 people were employed in the construction industry and 4881 in agriculture. People living in areas with lower concentrations of pollutants were more likely to work in agriculture. During the study period, we observed 14 844 deaths for non-accidental causes (32.3% from cancer, 39.1% from cardiovascular diseases and 6.4% from respiratory diseases), while 3110 subjects moved away from the Lazio region.
Descriptive individual and environmental characteristics of the cohort members
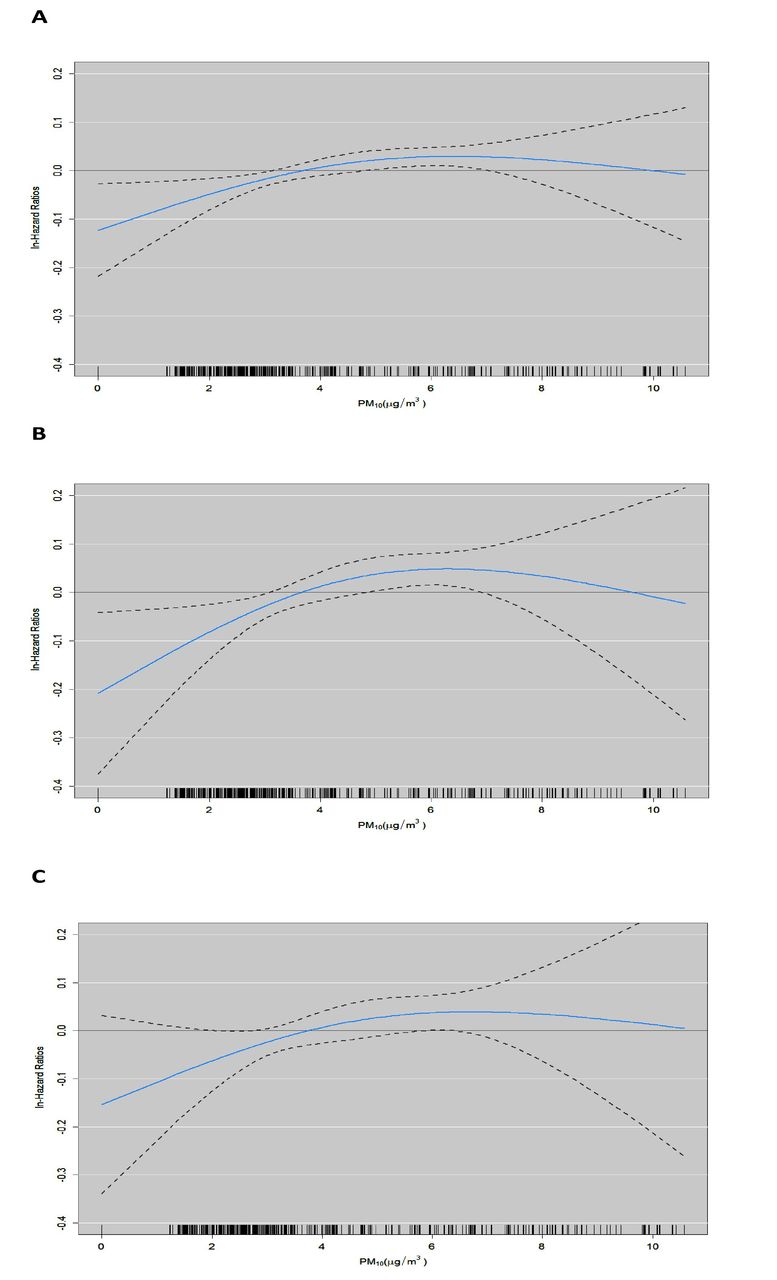
We found higher risks of non-accidental mortality (HR=1.06, 95% CI 1.01 to 1.12), all malignant cancers (HR=1.11, 95% CI 1.01 to 1.21) and cardiac diseases (HR=1.12, 95% CI 1.01 to 1.23) for increment of industrial PM10 equal to the difference between the 95th and 5th percentiles (5.49 µg/m3). The specific cancer types for which mortality was higher were pancreatic (HR=1.49, 95% CI 1.02 to 2.16), pleural (HR=3.75, 95% CI 1.46 to 9.64) and kidney (HR=1.79, 95% CI 1.05 to 3.06). Industrial PM10 was weakly associated with lymphatic cancer (HR=1.28, 95% CI 0.95 to 1.74), ischaemic heart diseases (HR=1.14, 95% CI 0.98 to 1.33) and digestive system diseases (HR=1.22, 95% CI 0.95 to 1.56). We also found an association between NOx concentrations and malignant cancers (HR=1.13, 95% CI 1.01 to 1.26), lung (HR=1.19, 95% CI 096 to 1.49) and kidney cancers (HR=1.83, 95% CI 0.96 to 3.52) and neurological diseases (HR=1.50, 95% CI 1.01 to 2.20). Residing near the harbour was associated with mortality from all cancers (HR=1.11, 95% CI 0.99 to 1.25), lung cancer (HR=1.31, 95% CI 1.04 to 1.66) and neurological diseases (HR=1.51, 95% CI 1.05 to 2.18) (table 2). A supplementary analysis performed after stratification for sex (online supplementary tables S1 and S2) confirmed these results. Figure 2 shows the concentration–response curves for non-accidental, cancer and cardiac disease mortality related to industrial PM10. For all three outcomes, we observed relationships that were almost linear with slopes that were steeper at the beginning and then flatter in the middle and final parts (with large CIs).

Concentration–response curves of industrial PM10 and mortality (A, non-accidental; B, cancer; C, cardiac disease). X-axis is average PM10 exposure (μg/m3). The black line is the mean estimate and the dotted lines are its 95% CIs.
Association between PM10 (industrial), NOx (traffic) and distance from the harbour exposure and cause-specific mortality. Adjusted HRs and 95% CI per a linear increase equal to the difference between the 95th and 5th percentiles of each pollutant (5.49 and 12.77, respectively)
Table 3 reports the results of the association between occupational categories of exposure and cause-specific mortality among men. We found higher risk for non-accidental mortality for men employed in the construction industry (HR=1.14, 95% CI 1.04 to 1.25) and among agriculture workers (HR=1.20, 95% CI 1.07 to 1.34) while comparing with workers in private service industry. We also found increased risk of all malignant cancers (HR=1.16, 95% CI 1.01 to 1.34), lung cancer (HR=1.41, 95% CI 1.11 to 1.81) and respiratory disease mortality (HR=1.47, 95% CI 1.01 to 2.14) among construction workers, of kidney cancer (HR=3.74, 95% CI 1.26 to 11.08) among construction product workers, of cardiovascular (HR=1.24, 95% CI 1.03 to 1.51), respiratory (HR=1.61, 95% CI 1.00 to 2.59) and digestive disease mortality (HR=2.13, 95% CI 1.19 to 3.81) among male agriculture workers, of larynx cancer (HR=2.13, 95% CI 1.19 to 3.81) in dock workers and of lymphatic cancer (HR=2.24, 95% CI 1.12 to 4.46) and neurological disease mortality (HR=2.13, 95% CI 1.19 to 3.81) in male transportation workers while comparing with workers in private service industry.
Association between occupational categories of exposure and cause-specific mortality in men. Adjusted HRs and 95% CI
In order to disentangle the roles of SEP, occupational and environmental exposures, we performed a sensitivity analysis in four steps for each environmental exposure (industries, distance from harbour and urban traffic). Methodology and results (online supplementary tables S3–S5) are reported in online supplementary appendix 2.
Discussion
We found a relationship between industrial PM10 and mortality from non-accidental, cancer and cardiac causes. In addition, there was a link with pancreatic, pleural and kidney cancer. Cardiac mortality was associated with traffic pollution. Neurological disease mortality was associated with traffic NOx and harbour proximity. Finally, people living close to the harbour showed a higher risk of lung cancer mortality. These results were adjusted for the concomitant environmental exposures, SEP and occupational exposure.
Occupational exposure analyses highlighted a higher risk of non-accidental, malignant cancer, lung cancer and respiratory disease mortality among construction workers, of kidney cancer among construction product workers, of cardiovascular, respiratory and digestive disease mortality among male agriculture workers, of larynx cancer in dock workers, and of lymphatic cancer and neurological disease mortality in men who work in transportation.
The link between industrial PM10 and cancer and cardiac disease mortality has been observed in other studies. In 2001, a systematic review15 highlighted the association between respiratory tract cancer and the lymphohaematopoietic system and residential proximity to an industrial site. A study conducted in an Italian industrial city demonstrated higher risk of pleural cancer, kidney cancer and cardiac disease in contaminated industrial areas.16 The association between pollution, cancer, cardiovascular and respiratory diseases has been observed in several studies.17–19
We found also a positive association between traffic NOx and high mortality risk of all malignant cancers and neurological diseases. There is evidence that associates mortality with long-term exposure to the traffic pollutants such as NOx or particles related specifically to vehicle emissions.20 21 In recent years, evidence has been slowly accumulating, suggesting that traffic-related air pollution may negatively affect the central nervous system and contribute to central nervous system diseases.22–24
The increased risk of lung cancer and neurological disease mortality that we observed among inhabitants within 500 m of the harbour could suggest an effect due to pollution caused by ship fuel and from possible past exposure to asbestos among residents near the port. In the scientific literature, the effect of diesel engine on lung cancer mortality is well documented.25 26
Higher risk of mesothelioma mortality was already known in the Civitavecchia area, with a standardised incidence rate in 2001–2013 of 4.4×100 000 residents.27 Exposure to asbestos also may partly explain the excess of lung cancer near the harbour in this study, as well as the association between exposure to industrial PM10 and excess of mesothelioma mortality.
We used modelled PM10 concentrations as exposure measure of industrial pollutants on the assumption that the pollution from chimneys does not spread uniformly around the site but depends on emissions, prevailing winds and the orography of the area. We used the shape of the concentrations on the ground to rank subjects as more or less exposed, and this shape is of greater importance than are the exact absolute values. A limitation of our exposure assessment is related to the lack of a validation study with in situ measurements. Nonetheless, SPRAY is a consolidated model that has been validated using a ‘conventional’ validation framework28 and its performances and efficiency have been evaluated and validated in multiple real conditions with different orography, domain size and meteorological conditions.29–31
The concentration–response curves of non-accidental, cancer and cardiac disease mortality related to industrial PM10 are consistent with a linear effect up to almost 4.5 µg/m3 exposure levels, with saturation of the effect for higher values. The association is significant even at very low exposure levels, suggesting the need to reduce the industrial components as much as possible in order to minimise the health effects.
Our study confirms knowledge already existing in the literature about the effects of occupational exposure in some sectors. A study on cement workers32 found higher lung and respiratory cancer mortality not explained by the confounding effect of smoking alone. Another study on US construction workers33 underlined significant excess mortality from all cancers, lung cancer and chronic obstructive pulmonary disease. In a case-controlled study in Montreal34 it was found that compared with other blue-collar workers, there was a slight increased risk of lung cancer in subjects who had ever been a construction worker. Several studies have already found an increased risk for respiratory diseases among workers in the agricultural sector.35 36 An Australian study in 2011 on male farmers and farm managers37 underlined higher rates of all-cause mortality, neoplasms and circulatory diseases. In a study on Spanish workers,38 the prevalence of high cardiovascular risk was greater in workers from the agriculture sector than in those from industry and service sectors. The ARCAGE (Alcohol Related Cancers and Genetic Susceptibility in Europe) study has investigated the association between occupational history and upper aerodigestive tract cancer risk, including larynx cancer, and found higher risks among dock workers.39
Our study also highlighted higher risk for lymphatic and haematopoietic tissue and neurological mortality among male transportation workers. The relationship between traffic and neurological diseases has been documented previously. The literature also documents the relationship between traffic and haematopoietic disorder. In 2012, an Italian study concluded that prolonged occupational exposure to low doses of traffic pollutants could alter some lines of the haematopoietic system in exposed workers.40
The strength of this work is the population-based cohort (71 362 residents) and the longitudinal study design adopted. We applied the residential cohort approach that implied the enrolment of the entire people resident in the study area. No sampling procedures were adopted, and we had no way to increase the statistical power. Therefore, the effect estimates tended to be less precise for some of the outcomes investigated and the relative 95% CI indicated their statistical uncertainty. Results were adjusted for several confounders: age, SEP and variables related to the environmental and occupational context that might otherwise have confounded our results. However, no data were available on the personal habits of the subjects that could have had a role in the diseases investigated, especially cigarette smoking, but also alcohol use, physical activity and obesity. The lack of this information may have biased the results because of confounding not controlled in the analysis. It should be noted, however, that many personal habits are associated with SEP. It is therefore reasonable to assume that the analysis that adjusted for SEP (and occupation) also took into account other individual variables, including smoking.
We have to consider a few additional critical aspects. The dispersion model for industrial sources was estimated using emissions from 1988 because the only past data available were for that year; we could not consider temporal variations in emissions. However, although we do know the absolute emissions of the past, the relative spatial gradients of concentrations in the area are likely to be the same across various periods of time due to likely constant meteorological conditions in various decades. The study considered the air matrix very carefully, but water and/or soil pollution that via food could possibly have had negative health effects was not ruled out.
In conclusion, we found associations between industrial PM10 concentrations, NOx from urban traffic, and proximity to harbour and cancer mortality, neurological and cardiac diseases when SEP and occupational exposures were taken into account. Past environmental and occupational exposures are responsible for the negative effects observed.
Acknowledgments
We thank Alessandro Marinaccio and Stafania Massari from Department of Occupational and Environmental Medicine, Epidemiology and Hygiene, Italian Workers’ Compensation Authority (INAIL), Rome, Italy, for their contribution to this work.
References
Footnotes
Contributors LB, CaA and FF conceived the idea of the study, together with MD, and were responsible for study design and statistical protocol. SB, RS and ChA were responsible for the exposure assessment procedures. LB was responsible for the data analysis, tables and graphs. All Authors contributed to the interpretation of the results and approved the final manuscript.
Funding The authors have not declared a specific grant for this research from any funding agency in the public, commercial or not-for-profit sectors.
Competing interests None declared.
Provenance and peer review Not commissioned; externally peer reviewed.