Article Text

Abstract
Background Mesothelioma is increasingly recognised as a global health issue and the assessment of its global burden is warranted.
Objectives To descriptively analyse national mortality data and to use reported and estimated data to calculate the global burden of mesothelioma deaths.
Methods For the study period of 1994 to 2014, we grouped 230 countries into 59 countries with quality mesothelioma mortality data suitable to be used for reference rates, 45 countries with poor quality data and 126 countries with no data, based on the availability of data in the WHO Mortality Database. To estimate global deaths, we extrapolated the gender-specific and age-specific mortality rates of the countries with quality data to all other countries.
Results The global numbers and rates of mesothelioma deaths have increased over time. The 59 countries with quality data recorded 15 011 mesothelioma deaths per year over the 3 most recent years with available data (equivalent to 9.9 deaths per million per year). From these reference data, we extrapolated the global mesothelioma deaths to be 38 400 per year, based on extrapolations for asbestos use.
Conclusions Although the validity of our extrapolation method depends on the adequate identification of quality mesothelioma data and appropriate adjustment for other variables, our estimates can be updated, refined and verified because they are based on commonly accessible data and are derived using a straightforward algorithm. Our estimates are within the range of previously reported values but higher than the most recently reported values.
- asbestos
- mesothelioma
- statistics
This is an Open Access article distributed in accordance with the Creative Commons Attribution Non Commercial (CC BY-NC 4.0) license, which permits others to distribute, remix, adapt, build upon this work non-commercially, and license their derivative works on different terms, provided the original work is properly cited and the use is non-commercial. See: http://creativecommons.org/licenses/by-nc/4.0/
Statistics from Altmetric.com
What this paper adds
There have been repeated calls to eliminate asbestos-related diseases, including mesothelioma, and these diseases are beginning to be recognised as a global health issue, thereby warranting the assessment of the global burden of mesothelioma.
The difference between the highest and lowest estimates of the global burden of mesothelioma is nearly twofold, with recent estimates being lower than earlier estimates, but it is unlikely that the actual numbers have decreased recently.
The present study estimated the global mesothelioma burden by extrapolating the most recent available data in the WHO Mortality Database which produced better estimates due to the incorporation of more extensive and higher-quality data.
Our estimates are within the range of previously reported values but higher than the most recently reported values by the Global Burden of Disease study.
The great need for a worldwide asbestos ban notwithstanding, we must improve the quantification of the global mesothelioma burden to support additional preventive actions.
Introduction
Malignant mesothelioma (‘mesothelioma’ hereafter) is an aggressive form of cancer that is caused by exposure to asbestos.1 Importantly, its incidence is increasing worldwide.2 There have been repeated calls for the need to stop using asbestos and to eliminate asbestos-related diseases (ARD), including mesothelioma.3–5 ARD are beginning to be recognised as a global health issue,3 thereby warranting the assessment of the global burden of mesothelioma. The number of incident cases of mesothelioma is not always known, but most patients die within 2 years,6 meaning that the number of mesothelioma deaths can be used as an indicator of the disease burden.
The mortality database7 maintained by the WHO compiles the number of deaths by disease category, calendar year, gender and age ranges, as reported by their member states (MS) and territories/insular regions (‘territories’ hereafter). Mesothelioma was first included in this database in 1994 coded as C45 under the 10th Revision of the International Classification of Diseases.8 We previously reported a descriptive analysis of mesothelioma deaths recorded in the database between 1994 and 2008.9 Only a fraction of countries had reported data at that point, and only for a limited number of years; more data have since become available.
Several attempts have been made to estimate the global burden of mesothelioma. Driscoll et al estimated the annual number at 43 000 deaths.10 This figure has been widely quoted to guide preventive activities, such as in the WHO document on the elimination of ARD.4 The WHO document5 on chrysotile asbestos quoted 59 000 annual deaths.11 The Global Burden of Disease (GBD) 2013 Study reported an estimate of 33 700 annual deaths in 2015,12 then downgraded their estimate to 32 400 annual deaths in 2016.13 The difference between the highest and lowest estimates is nearly twofold, and it is unlikely that the actual numbers have decreased recently. However, these estimates are difficult to compare because it is difficult to access the analysed data or to examine the used methods in detail.
Thus, the objectives of this study are as follows: (1) to descriptively analyse national mesothelioma mortality data in terms of their availability and quality; and (2) to use high quality data to estimate mortality in countries without high quality data so that a global burden of mesothelioma deaths can be estimated.
Materials and methods
We analysed data from 192 (99.0%) of 194 WHO-MS (Cook Islands and Niue were precluded for their lack of population data), 36 territories, and two non-MS (Kosovo and Liechtenstein, identified separately).14 15 We refer to these entities collectively as ‘countries’ (n=230) hereafter (see online supplementary table S1 for a list of the studied countries).
Supplementary file 1
In November 2015, we extracted data from the WHO Mortality Database regarding mesothelioma (C45) deaths from 1994 to 2014 in the MS and territories that reported these data. We used the number of mesothelioma deaths (combined for all types of mesothelioma) and population data to calculate three types of mortality rates (MR) for mesothelioma: (1) the crude MR (combined for gender); (2) the age-adjusted MR (combined for gender); and (3) the gender-specific and age-specific MR.
To calculate the crude MR for individual countries, we divided the observed number of mesothelioma deaths (combined for gender) by the total population (person-years) of the country in the same calendar years (see online supplementary table S1 for calendar years used in analysis). To calculate the age-adjusted MR (combined for gender) for a group of countries, we applied the direct age-adjustment method to the combined age structure of a group of individual countries for a defined period, with reference to the world population in the year 2000.16 To calculate the gender-specific and age-specific MR for a group of countries, we divided the observed number of mesothelioma deaths by the corresponding gender-specific and age-specific population (person-years) (using 5-year age groups from ‘0–4’ to ‘75+”) in the same calendar years. Population data were obtained primarily from the United Nations17 and complemented with information from the US Census Bureau.18
All studied countries (n=230) were classified into those 104 countries that had reported data on mesothelioma mortality and the 126 countries that had no reported data. Of the 104 countries with data, we then excluded those 45 countries that had (1) a crude MR for the entire period of 1994–2014 of 0.5 death per million per year or less (ie, less than half the widely accepted background level of mesothelioma mortality6 19 20) on the basis that these countries suffered from under-reporting and/or underdiagnosis (under-reporting hereafter); (2) two or fewer reported years of data; or (3) 10 or fewer total reported deaths for the entire period. The remaining 59 countries were then used to provide sets of reference rates for use in calculating global mesothelioma burdens (see online supplementary table S2 for a synopsis of the grouping of studied countries). Reference rates specified by age and gender were calculated separately in terms of continental region, historical level of asbestos use and percentage of the workforce in the industrial sector.
For calculations based on asbestos use, we extracted data on raw asbestos use from the US Geological Survey (USGS)21 22 and its updated data file (RL Virta, USGS, personal communication, 2013). We adopted the USGS definition of use (production+import-export), and obtained data by country across various time intervals. We interpolated use values for calendar years lacking data and treated negative values as 0. Asbestos use in countries that made a political transition was treated as previously described.23 Per capita asbestos use was calculated by dividing the volume of asbestos use by the population size (obtained as described above), and complemented for the period of 1925–1950 based on Lahmeyer.24 Cumulative asbestos use for the period 1925–1985 was considered to contribute to mesothelioma deaths of the study period. Countries were stratified into four subgroups (‘no use,’ ‘low,’ ‘middle’ and ‘high’) based on their levels of per capita and cumulative asbestos use (see online supplementary table S3). The USGS reported Malta as not having used asbestos, but we judged that the country should be grouped into the ‘low’ subgroup based on separate information (M Gauchi, Malta OSHA, personal communication, 2016).
For calculations based on continent, we defined Oceania, Africa, Asia, Europe and the Americas according to the United Nations.25 For calculations based on employment in the industrial sector, we extracted the percentage of the workforce employed in ‘industry’ (the other two categories were ‘agriculture’ and ‘services’) by country according to the World Bank.26 No data were available for 49 of our studied countries. Employment data were extracted for the period 1980–2012; no data were available for earlier periods. We grouped all listed countries into three equal-sized subgroups designated as ‘low,’ ‘middle’ and ‘high.’ Countries not listed in the above database were placed in the ‘no data’ subgroup. The latter subgroup did not include any country that reported mesothelioma deaths, so the value of one death per million population per year (ie, the widely accepted background level for mesothelioma)6 19 20 was used for extrapolation.
We conducted Pearson partial correlation analyses to investigate the relationships between crude MR and the number of reporting years and the total reported deaths. We conducted linear regression analyses to investigate the time trend of the age-adjusted MR, and further to identify the best-fit model for the age-adjusted MR calculated as the moving average of the annual age-adjusted MR for a combination of calendar years with available data. Weighting was applied for the size of the at-risk population. To determine the best combination of calendar years optimal for extrapolation, the best-fit model was identified by comparing the R2 and p values. Microsoft Excel (Microsoft Corporation, Redmond, Washington DC, USA) and SAS V.9.4 (SAS Institute, Cary, North Carolina, USA) were used to compile and analyse the data.
Results
Figure 1 shows the availability of data on mesothelioma deaths in the WHO Mortality Database, grouped by region. One hundred and four countries reported mesothelioma deaths (92 MS and 12 territories); the number of reporting countries varied widely by region, ranging from three in Oceania to 39 in the Americas, and also by calendar year, ranging from three in 1994 to 75 in 2009. Similarly, the number of reporting years varied widely by country, ranging from one (nine countries) to 20 (the Czech Republic and Slovakia), with a mean and median of 10.0 and 11.5 years, respectively, and a total of 1043 years. Of the MS, 102 did not report mesothelioma deaths to the WHO.
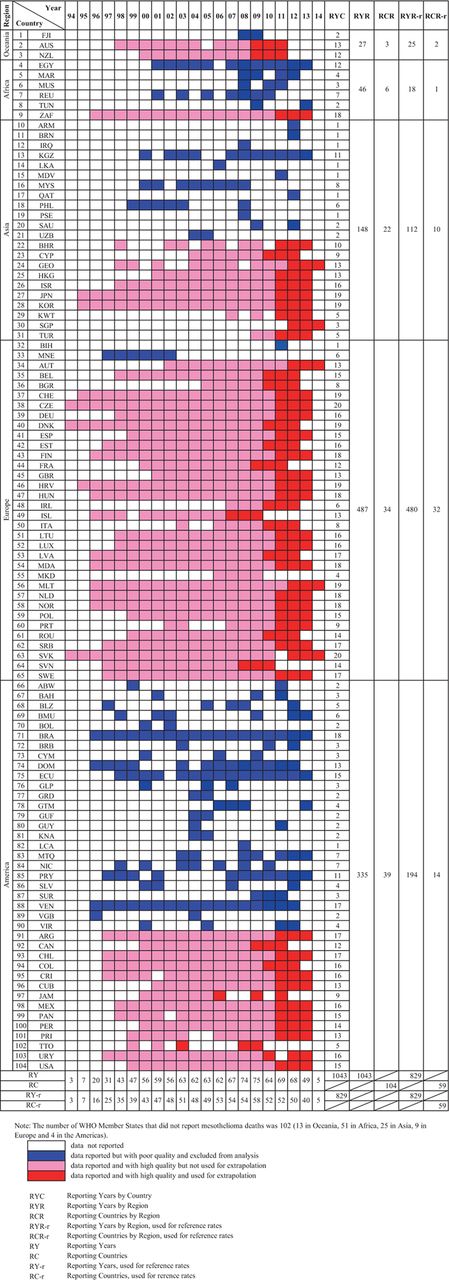
Availabiltiy of mesothelioma mortality data from 104 reporting countries in the WHO mortality database.
Figure 2 shows the crude mortality rate (MR) plotted against the number of reporting years (figure 2A) and the total number of deaths (figure 2B) in the 104 reporting countries. A statistically significant correlation was found for the latter relationship (partial correlation coefficient, 0.72; p<0.001; adjusted for population size), but not the former (partial correlation coefficient, 0.12; p=0.38; adjusted for population size). The crude MR for the 104 reporting countries varied 103-fold, ranging from 0.04 (in Egypt) to 44.56 (in the British Virgin Islands) with a mean and median of 6.60 and 2.91 deaths per million per year, respectively.
Of the 104 reporting countries, 21 (20.2%) recorded a crude MR of 0.5 or fewer deaths per million per year, 19 (18.3%) reported data for 2 years or less and 30 (28.8%) reported a total of 10 or fewer mesothelioma deaths; these groups overlapped (figure 2). Due to failing to satisfy one or more of the predetermined criteria for high quality data, 45 (43.3%) countries were deemed to have poor quality data; the remaining 59 countries (56.7%) were used to compile reference rates suitable for extrapolation. The 45 countries with poor quality data were combined with the 126 countries with no reported data (100 MS+24 territories+two non-MS) to form the group of 171 countries for which the number of mesothelioma deaths was estimated (see online supplementry table S2).
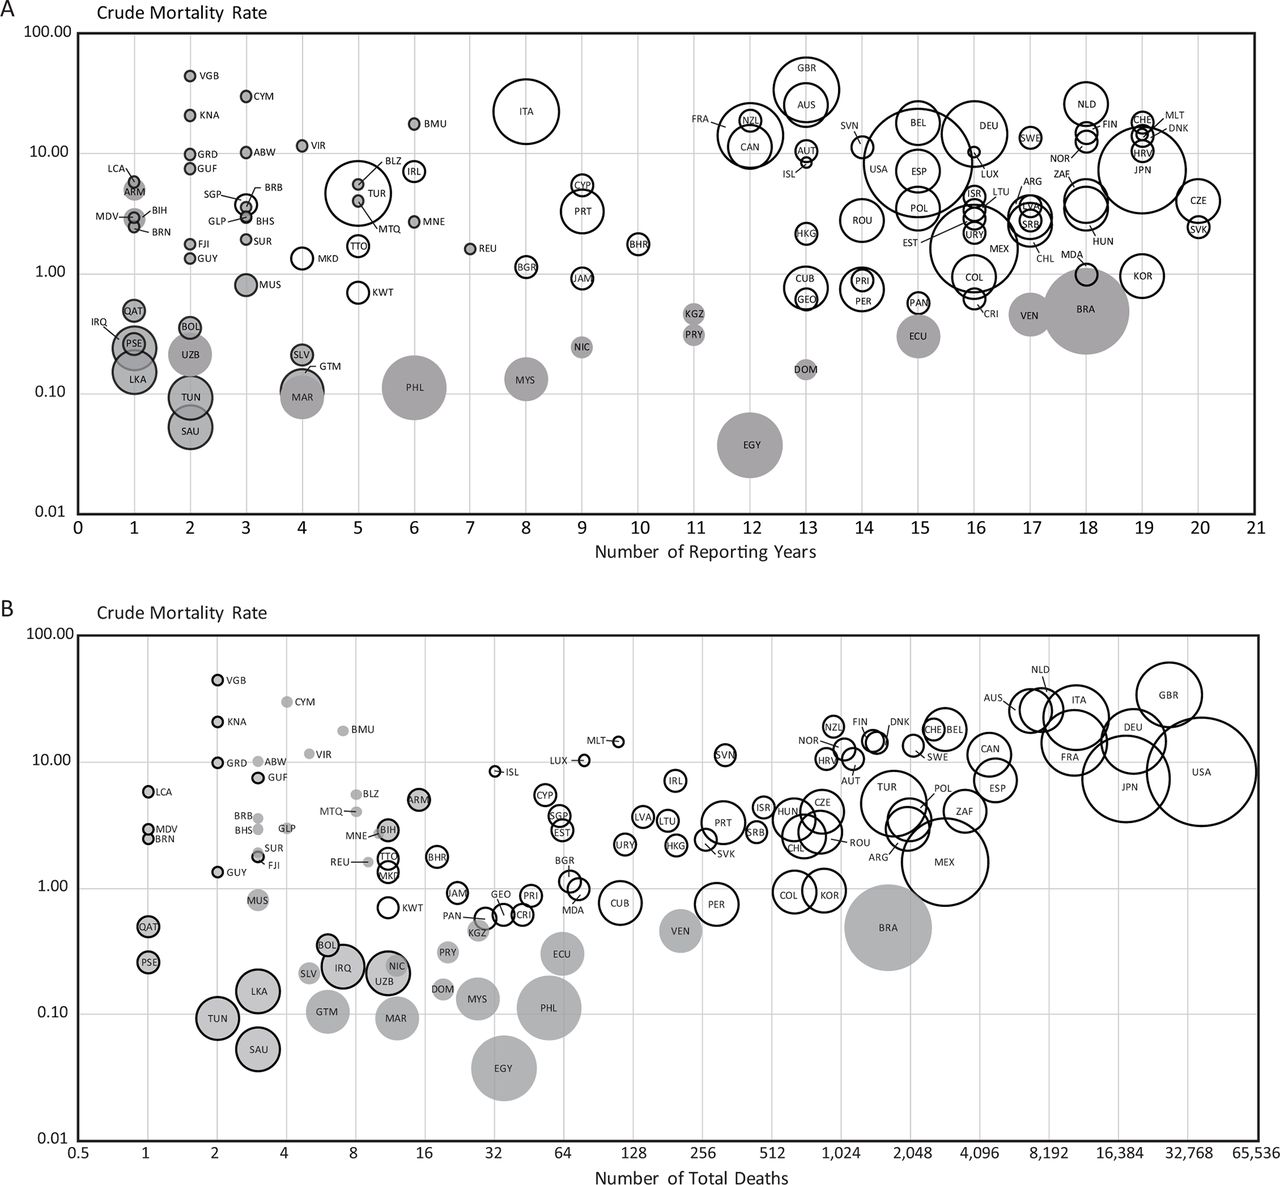
Crude mesothelioma mortality rates across 104 reporting countries with regard to data availability for: the number of reporting years (figure 2A), the number of reported deaths (figure 2B): (1) Unit is in deaths per million population per year. (2) Bubbles are drawn in proportion to the size of the population. (3) Blank and shadowed bubbles indicate that the mesothelioma data were suitable (N = 59) or not suitable (N = 45) for extrapolation, respectively. (4) Shadowed bubbles with solid outline indicates ten or fewer reported deaths (figure 2A) and two or fewer reporting years (figure 2B).
The 59 countries used for reference rates represented all regions but were skewed by region, with two in Oceania, one in Africa, 10 in Asia, 32 in Europe and 14 in the Americas (figure 1, column RCR-r). The total number of reporting years for these countries was also skewed by region, with 25, 18, 112, 480 and 194 years for Oceania, Africa, Asia, Europe and the Americas, respectively (figure 1, column RYR-r). Our reference rates were based on a total of 829 national annual data sets (ie, 79.5% of 1043 reported years).
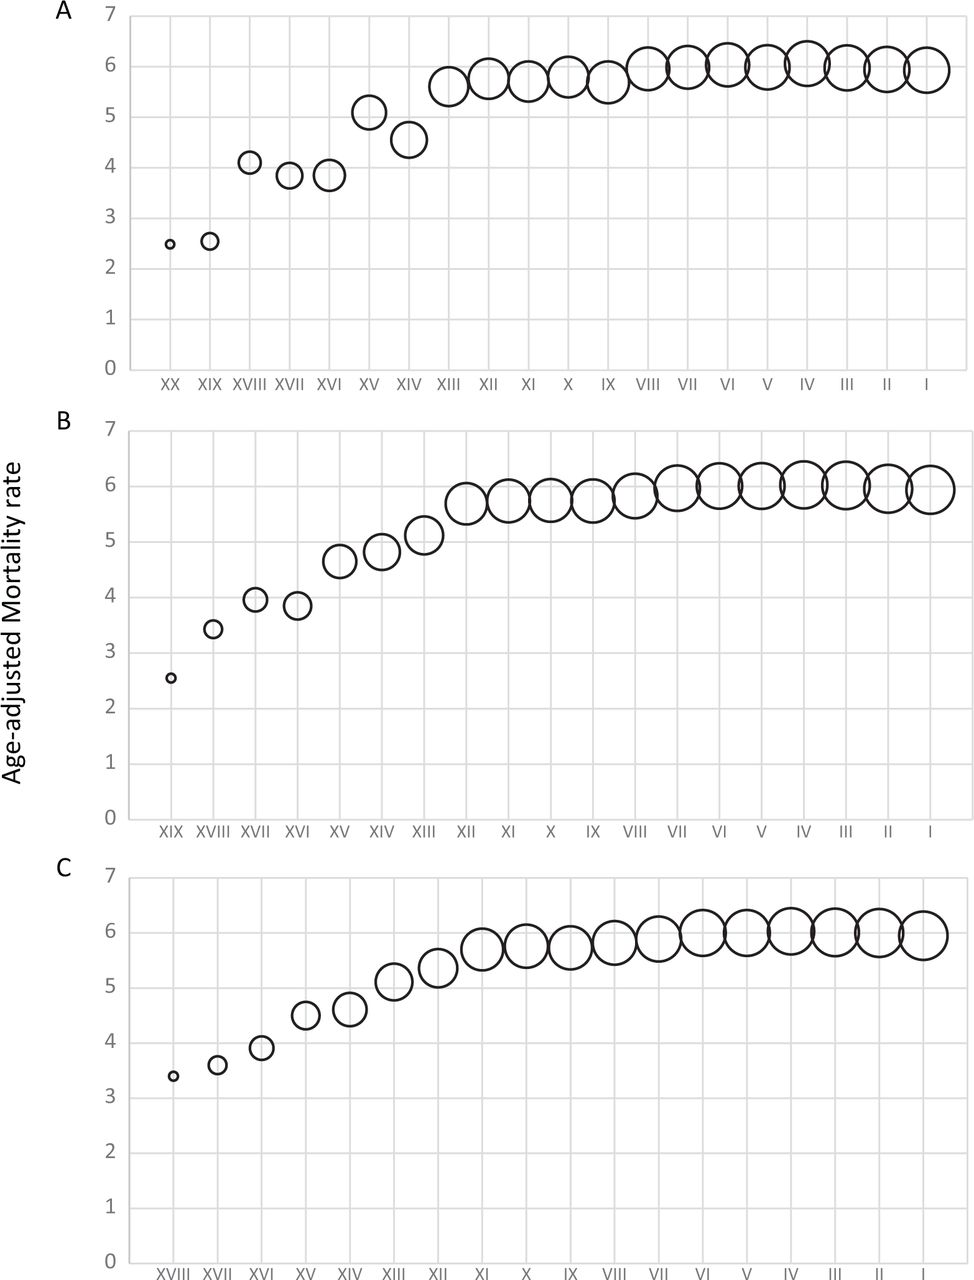
As shown in figure 3, the age-adjusted MR of the 59 countries with quality data generally increased during our study period when we observed the moving average of the age-adjusted MR for the most recent 1, 2 or 3 years of reported data (designated as models A, B and C, respectively). Among the three models, C showed the best fit (β1=−0.09, p<0.0001 and adjusted R2=0.64, p<0.0001 for the model). Because the 3-year moving average model showed the best fit for trend, the gender-specific and age-specific MR of the three most recent years with available data was used for extrapolation (figure 1, red cells).
Time trend of the age-adjusted mortality rates by the most recent one year (figure 3A), two years (figure 3B) and three years (figure 3C) across 59 countries used to compile reference rates suitable for extrapolation: (1) Unit in deaths per million population per year. (2) Bubble size is proportional to the number of reporting countries. (3) X axis represents the moving average of age adjusted MR against most recent one (R2 = 0.8769; P < 0.0001), two (R2 = 0.8868; P < 0.0001) and three (R2 = 0.8940; P < 0.0001) calendar years (during 1994–2014) with available data in the 59 countries.
Table 1 shows that the 59 countries with quality data representing 21.1% of the total population recorded an average of 15 011 deaths per year during these years, which was equivalent to 9.90 deaths per million per year. This reported number of 15 011 annual deaths was added to the annual number of deaths estimated by extrapolation and adjusted for selected attributes. This produced totals of 38 400, 36 300 and 37 500 deaths, based on adjustment for asbestos use, continent and employment, respectively. Online supplementary table S4 shows the reported and estimated deaths per year by country for each attribute.
The annual global burden of mesothelioma deaths
Table 2 shows that of the 38 388 mesothelioma deaths per year estimated by the asbestos-adjusted extrapolation method, 15 011 (39.1%) deaths occurred in countries used to compile the reference rates and 23 377 (60.9%) were obtained by extrapolation (2162 deaths in countries with poor quality data and 21 215 deaths in countries with no data). Of the referenced number of 15 011 mesothelioma deaths, 77.9% were men. Of the estimated number of 23 377 mesothelioma deaths, 78.4% were men. Of the total of 38 388 mesothelioma deaths, 78.2% were men. The continent-adjusted and employment-adjusted extrapolation methods produced breakdowns similar to those obtained using the asbestos-adjusted extrapolation method.
Numbers of annual mesothelioma deaths by status of countries for three extrapolation methods
Discussion
The present study estimates the global mesothelioma burden and provides a detailed examination of the annual reported and estimated data. Data on mesothelioma mortality showed considerable variations in the number of reporting years and availability by country, with more data generally available for Europe and the Americas. The data that we used for reference rates were limited even further to 59 reporting countries, which recorded 15 011 mesothelioma deaths per year during the 3 most recent years with available data. By applying their gender-specific and age-specific MR to all other countries (with poor quality data and no reported data), we estimated the global mesothelioma burden to be in the range of 36 300 to 38 400 annual deaths after adjusting for selected attributes. Our estimates of the global mesothelioma burden are within the range of previously reported values10 11 but higher than the most recently reported values.12 13
More data on mesothelioma deaths have become available in recent years, but the data quality varies across countries. If the different methods used for estimation are comparable in their validity, then the more recent studies (including the present one) should produce better estimates due to their incorporation of more and higher-quality data. Furthermore, our method employed objective criteria to identify good quality data for extrapolation. In effect, about 40% of our estimated number comprised data that were originally reported by countries (ie, the estimated fraction was about 60%). Because our estimates and those of the GBD team incorporated newer data, these estimates are likely to be more accurate than the earlier estimates, and to better represent the current situation.
The analysed countries had a total population of 7.17 billion, which reasonably represented the global population (online supplementary table S1).
The crude MR of countries reporting data on mesothelioma deaths was clearly correlated with the number of reported cases, but not with the number of reporting years (figure 2). Because mesothelioma remains relatively rare and difficult to diagnose, countries may need to accumulate experience in dealing with patients before they can report reliable data. Depicting the global trend of mesothelioma MR during a specific time frame is further complicated by the fact that the number and composition of reporting countries vary by year. No country reported mesothelioma deaths for all of the 21 studied years. We considered the one, two, or three most recent calendar years with available data in order to maximise our use of the scarce data. We observed increasing rates with all three models of age-adjusted MR, and chose the 3-year model based on the fitness of trend. As our objective was to estimate the current burden of mesothelioma mortality, we extrapolated the most recently available 3-year mortality data in the referenced countries to the non-referenced and non-reporting countries. However, current means ‘the latest available’ which is an average of, for example, 3 years record in the past in the WHO database. The most recent 3 years with available data for 57 out of 59 countries occurred during 2007–2014 but those of Trinidad and Tobago and Jamaica occurred in 2003, 2008, 2009 and 2006, 2009, 2011, respectively (online supplementary table S1, S4).
We calculated the crude MR for all reporting countries regardless of population size to address our first objective, which was to describe the national mortality data in terms of availability and quality. The WHO discourages the calculation of annual MR for countries with populations less than 500 000 because ‘any slight variation in numbers would affect to a large extent rates’.7 However, our calculations of MR (crude, age-adjusted and gender-specific and age-specific) compensated for small populations because the reporting years were accumulated. Furthermore, the criteria we used to identify countries with quality data tended to preclude countries with small populations; the only countries used in our reference rates with populations of less than 500 000 were Iceland and Malta. These two countries recorded high crude MRs that are likely to be true, given the multiple years that these countries have reported.
Our extrapolation method required that we assume comparability between the referenced and estimated countries in terms of MR. Adjusting for the selected attributes of continent, employment and asbestos (which assumed comparability after stratification) was done based on continental affiliation, industrial profile and historical asbestos use, respectively. The most relevant extrapolation method is likely to be that adjusted by historical asbestos use, because mesothelioma is almost exclusively attributable to past asbestos exposure and the extent of asbestos use has repeatedly predicted subsequent rates of ARD at national levels.27–29 The method of asbestos-adjusted extrapolation produced the highest estimate of mesothelioma deaths at about 38 000 per year. We believe this to be our best estimate.
There are obvious limitations in the present study. First, many countries, including those that recorded asbestos usage, did not report mesothelioma deaths to the WHO. The non-reporting of mesothelioma in a country that used asbestos at substantial levels with sufficient elapsed time cannot be interpreted as an indication that there was no case of the disease. Second, we used arbitrary criteria to define countries as under-reporting or reporting but lacking experience, and this may have introduced bias in either direction. However, the less than ideal capacity to diagnose and report mesothelioma cases in some of the countries used in our reference rates should have contributed to under-estimation. Third, the exact timing of asbestos use differed between the high-use countries of economically developed status and those of developing status, such as in Asia, where asbestos use started relatively late. Thus, the extrapolated numbers for a few of these developing countries may overestimate their current number of mesothelioma deaths and better reflect the reality in the years to come.
A strength of the present method is that we accounted for the gender and age structures of the referenced and estimated countries by extrapolating gender-specific and age-specific MR to the corresponding gender-specific and age-specific populations. Furthermore, our findings are easily reproducible due to the use of commonly accessible data and a straightforward algorithm. The present estimates are thus amenable to being updated, refined and verified. The lack of such features in earlier studies prohibited reassessment of the estimated values. In contrast, this study may be verified against actual numbers and cross-verified with existing methods. The estimation of the global mesothelioma burden will naturally improve as more countries report quality data and fewer countries require estimates to be made. The WHO Mortality Database will accumulate more data over time, but the data will continue to vary in their quality and availability given between-country differences in the medico-social infrastructures and current stages in the mesothelioma epidemic. Because these national differences are likely to persist for some time, the efforts to estimate the global mesothelioma burden will continue to be challenged. The great need for a worldwide asbestos ban notwithstanding, we must improve the quantification of the global mesothelioma burden to support additional preventive actions.
Conclusions
The availability and quality of national data on mesothelioma deaths varied widely. The data from 59 countries were deemed to be suitable for estimating deaths in all other countries. These 59 countries recorded 15 011 mesothelioma deaths per year during the three most recent years with available data. Our best estimate of the global mesothelioma burden is 38 400 annual deaths. Clearly, mesothelioma is a global health issue.
References
Footnotes
Contributors OC analysed and interpreted the data, and prepared the initial draft of the article with advice from KT, TS, TD and JT. Revision was done by OC with supervision of TK. TS contributed for linguistic issues for the revision. JT supported for replying reviewer’s comments. KT revised and rewrote the manuscript. MY contributed to the design of tables and figures. Manuscript was reviewed by TS, TD, CF, KS, SF, FT, SH, NvZ and JT.
Funding This work was supported by a JSPS (Japan Society for the Promotion of Sciences) Grant-in-Aid for Research Activity Start-up (Grant Number 26893321).
Competing interests None declared.
Provenance and peer review Not commissioned; externally peer reviewed.