Article Text

Abstract
Objective Safety climate has previously been associated with increasing safe workplace behaviours and decreasing occupational injuries. This study seeks to understand the structural relationship between employees’ perceptions of safety climate, performing a safety behaviour (ie, wearing slip-resistant shoes) and risk of slipping in the setting of limited-service restaurants.
Methods At baseline, we surveyed 349 employees at 30 restaurants for their perceptions of their safety training and management commitment to safety as well as demographic data. Safety performance was identified as wearing slip-resistant shoes, as measured by direct observation by the study team. We then prospectively collected participants’ hours worked and number of slips weekly for the next 12 weeks. Using a confirmatory factor analysis, we modelled safety climate as a higher order factor composed of previously identified training and management commitment factors.
Results The 349 study participants experienced 1075 slips during the 12-week follow-up. Confirmatory factor analysis supported modelling safety climate as a higher order factor composed of safety training and management commitment. In a structural equation model, safety climate indirectly affected prospective risk of slipping through safety performance, but no direct relationship between safety climate and slips was evident.
Conclusions Results suggest that safety climate can reduce workplace slips through performance of a safety behaviour as well as suggesting a potential causal mechanism through which safety climate can reduce workplace injuries. Safety climate can be modelled as a higher order factor composed of safety training and management commitment.
This is an Open Access article distributed in accordance with the Creative Commons Attribution Non Commercial (CC BY-NC 4.0) license, which permits others to distribute, remix, adapt, build upon this work non-commercially, and license their derivative works on different terms, provided the original work is properly cited and the use is non-commercial. See: http://creativecommons.org/licenses/by-nc/4.0/
Statistics from Altmetric.com
What this paper adds
Many factors have been found to increase risk of workplace slips when examined independently.
A general safety climate factor composed of established factors (manager commit to safety and safety training) was found to be a more parsimonious method for modelling the effects of safety climate on the outcomes of interest as compared to examining the effects of each factor separately.
Structural equation modelling determined that the relationship between safety climate and workplace slips was mediated by safety performance (in this case, wearing slip-resistant shoes).
Introduction
Same-level falls are a major cause of workplace injuries. Slips and falls account for a quarter of the occupational injuries and illnesses that require time off from work in the USA.1 According to the Liberty Mutual Workplace Safety Index, injuries resulting from same-level falls in the USA have increased 42% from 1998 to 2010, for a total direct cost of US$8.6 billion in 2010.1 As the workforce ages2 the costs of slip-related and fall-related injuries could continue to rise because of the fall risk in this vulnerable population.3 A study of Swedish workers found that employees over the age of 45 were more likely to experience slips and falls on the job, and injuries from these events resulted in more time away from work than in younger workers.4
In the USA, limited service restaurants (LSRs), also known as fast-food restaurants, employ over 4.5 million workers.5 Because of its size, this industry has the third largest injury burden of all industries in the USA.6 For LSR employees, slips and same-level falls account for one-third of work time-loss occupational injuries and illnesses.7 Previous work on slips in LSRs has found that workers are more likely to slip near sinks and fryers in the kitchen; on floors with lower coefficients of friction (COF); when they are not wearing slip resistant shoes; and when they are rushing.8–10 Restaurant management can affect many factors related to employee slips, such as providing slip-resistant shoes or establishing a good cleaning schedule that keeps the COF high.9 ,11 There is special interest in the role management plays in protecting workers because management commitment to worker safety is an important component of workplace safety climate.12
Safety climate is a measure of shared perceptions among employees concerning the practices, procedures and behaviours that are supported and rewarded within an organisation.13 ,14 Although the exact constructs used to assess safety climate have varied from study to study, commonly measured facets of safety climate include employee perceptions of management commitment to safety, work pressure, safety systems and worker competence.12 ,14 ,15 In meta-analytic reviews, safety climate has been correlated with safety performance16 and occupational injuries.12 However, the results of these meta-analyses emphasise that safety climate should be measured prospective to injury collection to more accurately capture the link between safety climate and occupational injury.
Workplace safety climate
Measures of workplace safety have previously been examined in relation to prospective injury rate in the current study population. A factor analysis identified employee perception of management commitment and safety training as two latent factors from six survey items given to 419 employees at 34 LSRs.17 This prior analysis examined the effects of management commitment and safety training on prospective injury rate. The authors found that individual (but not shared) perceptions of management commitment to safety and perceptions of safety training predicted subsequent injuries, controlling for demographic risk factors.17
Management commitment and safety training were previously identified as important components of safety climate15 and have been found to be highly correlated.17 Based on these findings, we would like to further explore whether a higher order safety climate factor would be an appropriate method for examining the impact of workplace safety on safety performance and safety outcomes.18 ,19 The higher order safety climate factor will allow us to account for covariance between management commitment and training in the structural model. Similar to the work by Griffin and Neal,20 the present study used a confirmatory factor analysis (CFA) to establish whether or not a higher order safety climate factor adequately explains variation across two first-order safety climate factors.21
Structural equation modelling (SEM) has been identified as an appropriate method for examining the relationship between safety climate and safety performance.22 Using an SEM, this study proposes to look at the relationship between safety climate, safety behaviour performance (ie, wearing slip-resistant shoes) and slips in LSR workers, controlling for demographic risk factors. The SEM allows us to test our main hypothesis that safety climate affects workplace slips directly and indirectly, that is, through safety behaviour performance. Our secondary hypothesis is that safety climate can be constructed as a higher order factor. The presence of a higher order factor should allow for the model to better account for covariation among the previously identified first-order factors21 of management commitment and safety training.
Methods
Data collection
Participants were employees at 30 LSRs from three chains in six states in the USA. Recruitment was initiated by contacting franchise locations and their individual managers. Once sites were enrolled, the study team posted materials in the stores concerning study recruitment and enrolment dates. Study team members went to each store to enrol and obtain consent from participants, and to directly administer the baseline questionnaires. Participants had to be present in the restaurant on the day of the baseline survey to be recruited in the study. Further details on recruitment and measurement have been described by Verma et al.8 ,9 The previously published studies included 36 restaurants; we excluded 6 restaurants from that study population because they provided slip-resistant shoes at no cost to their workers. This created a financial incentive for increased worker safety behaviour at these locations that may bias the relationship under study. Our sample size was 349 participants of 924 employees at these restaurants, or 38% response rate. Our sample size well exceeded the recommended minimum of 200 participants for the maximum likelihood procedure that our SEM employed.23
After the consent process, participants reported demographic and work experience data on age, gender, height, weight, race/ethnicity, educational attainment and job tenure. Participants were allowed to complete this survey in English, Spanish or Portuguese. In this initial survey, participants also answered questions about safety training and management commitment to safety at their LSR.17 ,24 These questions were used in generating the safety climate scores, described below. Finally, the research team examined participants’ shoes to establish whether or not the shoes were slip resistant. Since no gold standard for slip-resistant shoes could be found in the literature, shoes were classified as slip resistant if the manufacturer indicated them to be so by embossing or printing ‘slip resistant’ on the sole.25 In this study, safety performance was defined as whether or not participants wore slip-resistant shoes.
Participants were paid for their initial participation, for each weekly survey and a bonus for completing the entire study as approved by the institutional review boards. Prospective slipping data were collected via weekly surveys, administered in a participant's preferred language via phone or internet. Participants reported their hours worked in the prior week and the number of slips, if any, they experienced during that week. Slips and hours worked were totalled for each participant across the study period. Hours of work for each individual were log-transformed to normalise their distribution. Rate of slipping was the primary outcome of interest (total number of slips reported/total number of hours worked during follow-up).
Statistical analysis
Descriptive analyses of the demographic data, hours worked and outcomes were carried out using SAS V.9.3 (SAS Institute, Cary, North Carolina, USA). The total number of slips followed a count distribution. We used the PROC GENMOD procedure in SAS to assess if a Poisson or negative binomial distribution better fit these data. The Akiakie's Information Criterion and Bayesian Information Criterion indicated that the data better fit a negative binomial distribution.
Safety climate-confirmatory factor analysis
Latent variables are unmeasured constructs that underlie measureable behaviours. To analyse the latent construct of safety climate, a CFA was conducted on the six survey items concerning safety training and management commitment to safety. These two factors generated the initial framework for our CFA.26 Using a maximum likelihood procedure, CFA models were examined with model fit statistics including root mean square error of approximation (RMSEA) and comparative fit index (CFI).19 ,27 The CFA procedure is not used to ‘prove’ that we have established the correct factor model, but rather to test that no other factor structure better represents the data. The model containing the second-order general safety climate factor was then assessed using the model fit statistics as well as the proportion of variance in the first-order factors explained by the second-order safety climate factor.18 ,21 As described in the Background section, the second-order factor should hypothetically better account for the covariation across the two first-order factors.19
Structural equation model
An SEM was employed to examine the relationship of the latent safety climate factor to both safety performance and workplace slips.21 Demographic and workplace factors shown to affect slips in LSRs were added to the model: gender, age, job tenure, hours worked, body mass index (BMI), race/ethnicity (categorised as Caucasian, African-American, Hispanic and Other) and education level.9 We hypothesised that the second-order safety climate factor would be positively correlated to safety performance (wearing slip-resistant shoes) and that performing the safety behaviour will be negatively correlated with slips. After eliminating education and job tenure as not having significant relationships, we tested the hypothesised model of structural relationships displayed in figure 1. SEM and CFA analyses were conducted using Mplus V.6.1 (Muthen & Muthen, Los Angeles, California, USA).
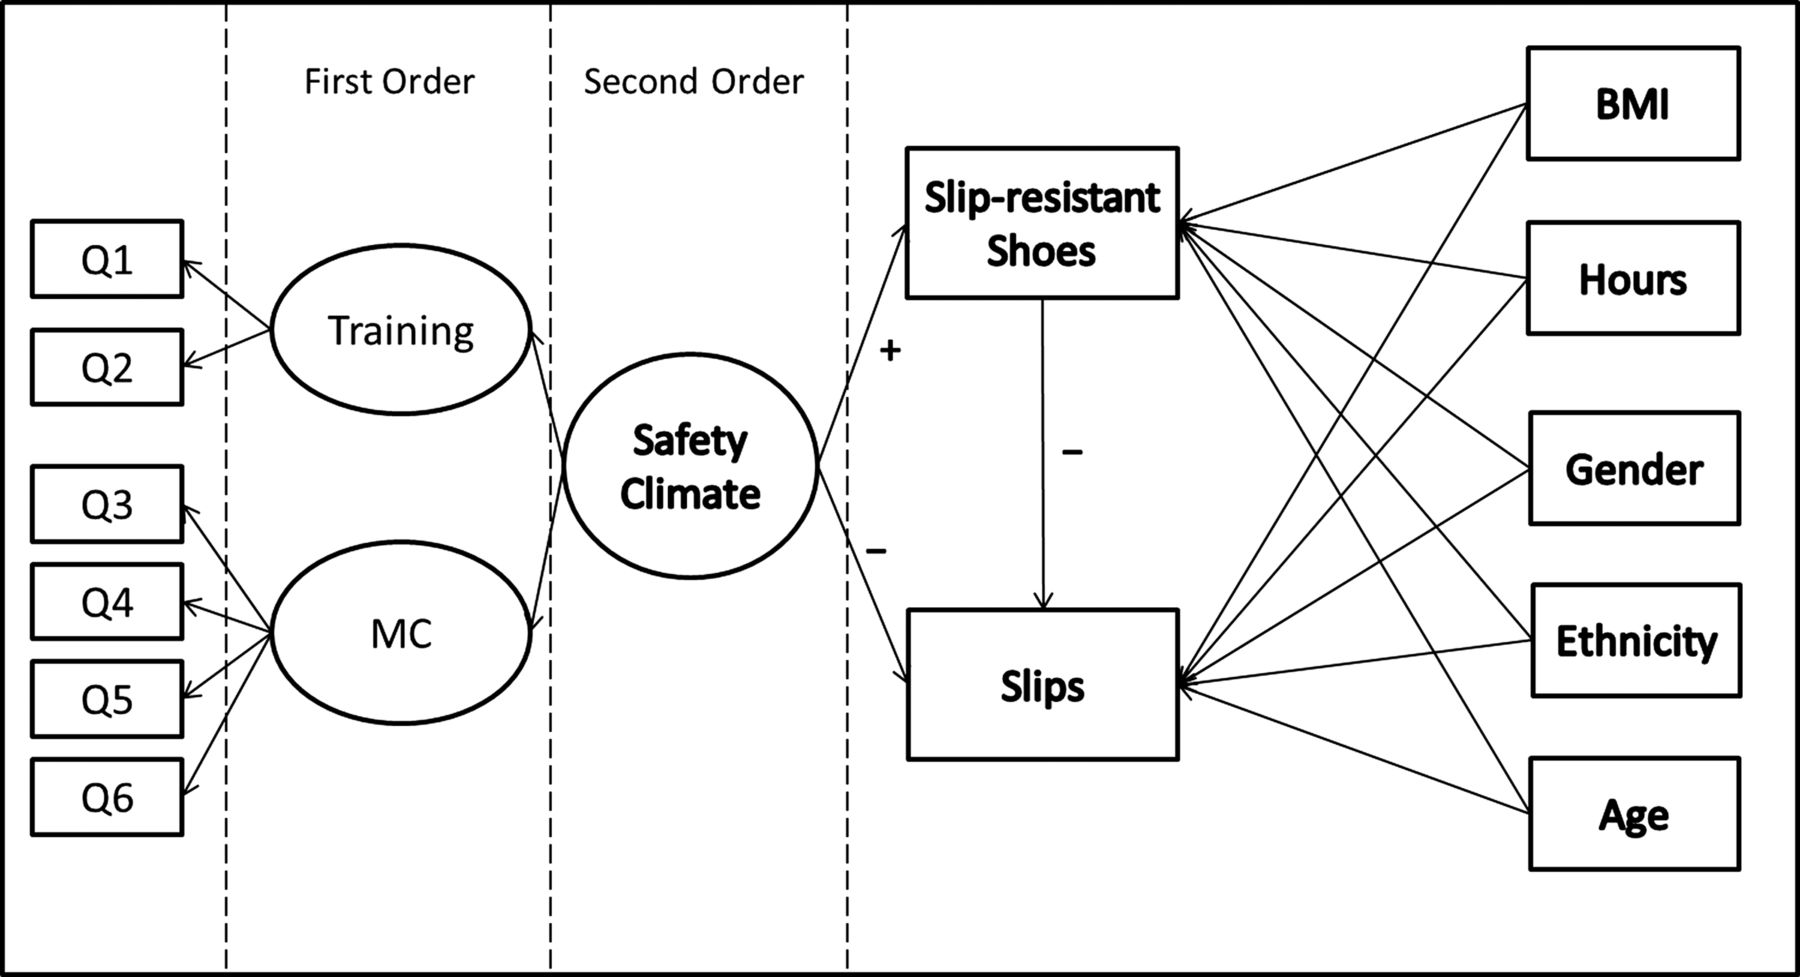
Hypothesised structural equation model for the effects of safety climate on wearing slip-resistant shoes and slips. The plus (+) and minus signs (−) indicate that the hypothesised correlations are positive and negative, respectively. Rectangular components are directly measured and elliptical components are latent factors. MC, Management Commitment; BMI, body mass index.
Results
The 349 study participants experienced 1075 slips during the 12-week follow-up. Individuals averaged 3.08 slips (SD=4.92) ranging from 0 to 32 slips. Participants averaged 250 h of work during follow-up, or approximately 2181 full 40 h weeks. Table 1 describes the demographic data of the study population. Descriptive statistics on the responses to six safety climate items can be found in online supplementary appendix 1.
Demographic data on the study population from the baseline survey (n=349)
In confirmatory factor analysis, the six items loaded into two previously identified factors. The results in table 2 confirm the results of the prior study's factor analysis and principal component analysis: the six items loaded onto the two factors as expected. For the latent factor analysis, the RMSEA was 0.052 (90% CI 0.00 to 0.093), indicating acceptable fit, and the CFI was 0.986, indicating good fit. The proportions of variance explained by the second-order Safety Climate factor for the first-order Training and Management Commitment factors were 0.665 and 0.995, respectively. The χ2 test for model fit was accepted (p=0.55), indicating the model as accurately fitting the data.28 ,29 There was no change in the pattern matrix for the Training and Management Commitment factors in the presence of the second-order Safety Climate factor.
Pattern matrix for the questionnaire items on the training and management commitment safety climate factors
Table 3 displays the path coefficients estimated in the SEM. Figure 2 displays the path relationships that were significant at p<0.05. Safety climate was associated with an increase in safety performance (wearing slip-resistant shoes), yet safety climate was not directly correlated with number of workplace slips; however, this latter relationship approached significance (p value=0.061). Safety performance was associated with a decrease in workplace slips. For the demographic factors, age was the only characteristic correlated with number of slips: age and slip rate were inversely related. Increased BMI, increased hours worked (measured on a log scale) and female versus male were associated with increased shoe wearing. Figure 2 displays a negative relationship between race/ethnicity and shoe-wearing, indicating that proper shoe use was more common among non-Hispanic whites compared to other racial and ethnic groups.
Path coefficients estimated in a structural equation model

Results from a structural equation model examining the relationship between safety climate, safety performance (wearing slip-resistant shoes) and slips in limited service restaurant employees. Only significant pathways are displayed. Dashed lines represent negative binomial regression analyses; solid lines indicate logistic regression analyses; β coefficients are displayed for each regression. The Gender results indicate that females were more likely to wear slip-resistant shoes than males. The ethnicity results indicate that non-Hispanic Caucasian were more likely to wear slip-resistant shoes than any other race/ethnicity categories. Other demographic variables were continuous. MC, Management Commitment to Safety; BMI, body mass index.
Discussion
We found that safety climate had indirect effects on slips among workers in LSRs. This relationship was mediated by safety performance: wearing slip-resistant shoes. These results indicate that the effects of safety climate on workplace slips are manifested via the performance of a safety behaviour. It was not the case that safety climate and slips were directly related with one another.
It is important to be able to prospectively link safety climate to workplace injuries and potentially injurious events. Safety climate is a leading indicator for workplace safety,15 so management does not have to wait for an injury to occur to understand their role in reducing injury risk. Furthermore, safety climate is a modifiable characteristic, and it has been found that organisations can improve their safety climate and increase safe behaviour performance.30 Safety climate can be a framework through which management encourages safe behaviours, as opposed to solely punishing unsafe behaviours.31 Therefore, rewarding safe behaviour builds safety climate and this can be a way for management to preemptively reduce the risk of injuries.
Our finding that safety climate indirectly affects workplace slips is consistent with the literature and may provide a mechanism through which interventions on safety climate could reduce workplace injuries.30 Prior research has not been unanimous on the exact relationship between safety climate and injuries. Clarke's meta-analysis found that safety climate was correlated with safety performance and not workplace incidents.16 Beus et al12 found that safety climate and injuries were linked, yet these authors cautioned that the prospective safety climate→injury link was not as strong as the retrospective injury→safety climate link. In a population of construction workers, safety climate was correlated with workplace injuries and safer workplace behaviours.32 However, a later study that included construction workers alongside other industries found that the effects of safety climate on workplace injuries were mediated through perceived employee occupational control.33 In the current study, the effect of safety climate was mediated through safety performance. Whether safety climate directly affects incidence of occupational injuries, or some other factors mediate this relationship, it is nevertheless clear that improving organisational safety climate positively impacts employee safety.
This analysis modelled safety climate as a higher order factor composed of two separate, yet correlated, factors. Huang et al17 hypothesised that safety training mediated the significant relationship between management commitment and injury incidence. By utilising an SEM, the current analysis was able to account for this high correlation between the two factors to generate a latent variable that more accurately modelled the effects of safety climate on safety performance.20 ,21 So while factor analysis of safety climate questionnaires might produce individual latent factors of safety climate, it might be better to analyse a global safety climate score in relation to safety performance or workplace injury.14 ,34 In some ways, however, the second-order safety climate factor has greater application to theory and statistical modelling than to practical safety interventions. The first-order safety climate factors are latent constructs that underlie specific aspects of the workplace. If managers at a location saw that their employees scored low on the safety training items of the questionnaire, then they would know to intervene on worker training. It would be less practical for managers to attempt to intervene on a global safety climate factor composed of multiple components of workplace safety.
For managers and safety professionals seeking to improve safety in the workplace, analysing the individual safety climate factors and crafting interventions tailored to areas of poor performance would be much more pragmatic than assessing a global safety climate score and attempting to increase a score that is composed of many different facets.
Our analysis found that increased age was associated with decreased slip risk. Initially, this is counter-intuitive relative to previous findings that reported increased slip injury risk in older workers.3 ,4 While the risk of fall injury increases with increasing age, older workers may be more likely to modify their work habits to reduce their slip risk. In addition, older workers likely have more work experience and would therefore be better at recognising potentially hazardous situations. In this study, an overwhelming majority of participants were less and 50 years old (90%). In this age range, tenure and experience may play a more significant role than physiological decline.
Strengths and limitations
Although our prospective assessment of safety climate allows us to better analyse its effects on workplace slips, we only analysed this relationship in a single direction. Our weekly data collection did not continuously assess safety climate. We also did not attempt to model the effects of slipping history on safety climate. Aside from difficulties in measuring rates of prior slips and/or injuries in their current job, we would have to ignore potential recall bias on historical slips that could vary with job tenure.35 Beus et al12 found that time-since-prior-event did not mediate the effects of previous injury on safety climate score. So while we could not model the effects of prior slips and injuries on safety climate, according to Beus et al, these prior events already affect individual safety climate scores.
We also did not follow-up on shoe wearing behaviour. Therefore, we had to assume that the shoes that workers were wearing at the initial interview would be the shoes that they would wear for the entire follow-up period. At baseline, over 90% of the participants reported wearing the same pair of shoes every day at work. Because the study was not designed to monitor shoe-wearing for each employee, we examined initial shoe wear as an intent-to-treat analysis. Because 90% of participants said they wore the same shoes to work every day, we anticipated that their shoes at baseline, either slip resistant or not, would be what they wore during the entire study period. Since no gold standard for ‘slip resistance’ exists for the shoes we examined in the study, it is likely that some slip-resistant shoes were more effective at deterring slips than others. Further investigation of shoe type and slips is warranted.
Although SEM analysis has grown in recent years, it is not without its drawbacks and assumptions. Because our SEM included categorical variables, Mplus could not give the relative fit indices of RMSEA or CFI.36 This is somewhat mitigated in our analysis by the indicators of good CFA model fit (eg, RMSEA and χ2). A 2007 article by Barrett argues that the only appropriate test to assess SEM model fit should be the χ2, a statistic that we were able to assess and that supported strong model fit.29 Because of these statistical limitations, we have to rely on theory to assist in model assessment.37 We believe that the models we tested were well grounded in the workplace safety literature that we presented, so having limited summary statistics does not undermine our analysis.
We excluded six restaurants from the initial sample because they provided slip-resistant shoes to employees at no cost. While we were not ready to examine the effects of this economic incentive for shoe-wearing, we may have introduced negative bias to our sample by excluding workers who received this additional safety equipment from their employers and thus might have higher safety climate scores. To assess the presence of bias, we compared mean scores on the six safety climate items for employees within the excluded restaurants to those in the study population. Results of Student t test show that employees in the excluded restaurants did not have higher safety climate scores than those in the study group.
Our study was able to capture 38% of employees at the 30 locations. We only enrolled participants on a single day at a given study site. This was a conscious decision by the study team to not return to each site to capture missed employees because we wanted to get to as many work sites as possible during our enrolment window. Whereas more participants per site might have allowed for a more thorough analysis of worksite-specific behaviours, we were able to analyse a broader range of restaurants.
The previous investigations on safety climate in this population by Huang et al17 ,24 found limited support for shared safety climate within restaurants. Because of the difficulty in identifying a meaningfully shared perception of safety climate of employees within a given restaurant, we did not use a multilevel SEM.21 We also did not assess other restaurant-specific characteristics, such as cleaning protocol or floor COF. Future analyses should take into account within-organisation effects that may affect shared co-worker safety climate perceptions.38
Despite these limitations, our study has methodological advantages. Our CFA produced a second-order safety climate factor that accounts for correlation and variance of the two first-order factors. When conducting an SEM, it is possible that multiple structural relationships will be supported by summary statistics.37 We did test safety climate as a single factor and found that the second-level structure with two first-order factors had a more acceptable fit, per RMSEA and CFI (data not shown). Because our study was prospective, we were able to measure safety climate before participants experienced the workplace incidents. This addresses Beus et al's concerns about workplace injuries predicting safety climate. By measuring safety climate before any potential slips, we know that events during the study period are not negatively affecting workers’ perceptions of safety climate.
Conclusion
Modelling safety climate as a higher order factor composed of safety training and management commitment, we found that safety climate indirectly affects prospective slipping in LSR workers. This relationship is mediated by employees performing a safety behaviour (wearing slip-resistant shoes). Because our construction of safety climate focused on training and management commitment to safety, managers could improve organisational safety climate by focusing on these two areas. By improving workplace safety climate, management could potentially reduce workplace slips and falls.
Acknowledgments
The authors would like to thank Dr Tin-Chi Lin and Dr Elyssa Besen for their comments on an earlier draft of this manuscript.
References
Supplementary materials
Supplementary Data
This web only file has been produced by the BMJ Publishing Group from an electronic file supplied by the author(s) and has not been edited for content.
Files in this Data Supplement:
- Data supplement 1 - Online supplement
Footnotes
Contributors SKV, WRC, MB and TKC conceptualised and executed data collection. DIS and SKV conceptualised the present analysis. Y-HH and DAL advised the conduct of the analysis. DIS wrote the manuscript. All authors read the manuscript, suggested changes, and approved of the final draft.
Funding Funding for this research study was provided by the Liberty Mutual Research Institute for Safety.
Competing interests None.
Ethics approval Ethics approval was provided by the Institutional Review Board of Liberty Mutual Research Institute for Safety and the Office of Human Research Administration at the Harvard School of Public Health.
Provenance and peer review Not commissioned; externally peer reviewed.