Article Text

Abstract
Background: Using questionnaires to assess children’s residential exposure to environmental tobacco smoke (ETS) may result in misclassification from recall and response bias. Questionnaire data have frequently been validated against urinary cotinine measurements, but rarely against actual measurements of residential air nicotine.
Objective: To compare questionnaire reported smoking with air nicotine concentrations in a large population of children and with urinary cotinine levels in a subpopulation; and to assess the potential impact of the symptom status of the children on the agreement between different measures of exposure.
Methods: The authors assessed residential exposure to ETS in 347 German, 335 Dutch, and 354 Swedish preschool and schoolchildren by questionnaire and air nicotine measurements, and in a subset of 307 German children by urinary cotinine measurements. They then compared the different measures of ETS exposure.
Results: In all countries, air nicotine concentrations increased with increasing questionnaire reported smoking in a dose-response fashion. Specificity and negative predictive values of questionnaire reports for nicotine concentrations were excellent. Sensitivity and positive predictive values were moderate to good. Excluding occasional smokers, the overall percentage of homes misclassified was 6.9%, 6.7%, and 5.1% in Germany, the Netherlands, and Sweden, respectively. Similar results were found for the agreement of urinary cotinine concentrations with questionnaire reports and air nicotine levels. There was no indication of underreporting by parents of symptomatic children.
Conclusion: Despite some misclassification, questionnaire reports are an inexpensive and valid estimate of residential ETS exposure among preschool and school children.
- ETS, environmental tobacco smoke
- LOD, limit of detection
- environmental tobacco smoke
- questionnaire
- air nicotine
- urinary cotinine
Statistics from Altmetric.com
The evidence for health hazards associated with exposure to environmental tobacco smoke (ETS) has been extensively reviewed.1–5 Children have been identified to be particularly sensitive: ETS exposure is associated with an increased risk of lower respiratory tract infections; increased prevalence of fluid in the middle ear, symptoms of upper respiratory tract irritation; reduction in lung function; new cases of asthma, and additional episodes and increased severity of symptoms in children with asthma.1,2
In epidemiological studies, exposure to ETS is most frequently assessed by questionnaire reports,6 less often by measurements of biomarkers, such as urinary nicotine and its metabolite, cotinine, in body fluids,1,2 and rarely by passive monitors.7–9 All these methods have assets and drawbacks and cover somewhat different aspects of exposure. Questionnaires represent an inexpensive method to assess long term exposures as well as short term exposures experienced by study participants at different locations. However, using questionnaires may result in misclassification from recall bias and response bias due to awareness of the hypothesis or parents’ feelings of guilt for smoking in the presence of their children. Passive monitors can be used for stationary or personal monitoring of short term exposures. While stationary monitoring provides a measure of exposure in one specific environment (for example, an individual’s home), personal monitoring provides an integrated measure of exposure across a number of environments, but does not provide information on exposure in individual environments. Urinary cotinine is used as a measure of the internal dose of a subject and (like personal monitoring) provides an integrated measure of exposure experienced across different environments. Its half-life time makes it a good indicator of integrated exposure over the previous day or two.1
Within the AIRALLERG study we investigated the agreement between questionnaire reported smoking and air nicotine concentrations measured in the living rooms of more than 1000 German, Dutch, and Swedish (pre)school children. We compared questionnaire reports and air nicotine levels with urinary cotinine concentrations in the German subpopulation.
MATERIALS AND METHODS
Study design and study population
The AIRALLERG study was designed as a nested case-control study within four ongoing birth cohort studies: GINI10 and LISA11 in Germany, PIAMA in the Netherlands,12 and BAMSE in Sweden.13 In each country, approximately 180 children with and 180 children without sensitisation to common food and inhalant allergens at age 2–4 years were selected.
Home visits
Between January 2002 and May 2003 in each country approximately 360 children were visited twice, mostly in the cold season of the year (mid October to mid April). Median (minimum-maximum) age of the children at the home visit was 5 (3–7), 5 (4–6), and 7 (5–9) years in Germany, the Netherlands, and Sweden. Data collection included measurements of air nicotine, collection of questionnaire information on smoking and housing characteristics, and collection of urine samples (Germany only). Response rates (defined as the number of children who were eligible for the study, were invited to participate and agreed to home visits) were 81%, 77%, and 59% in Germany, the Netherlands, and Sweden. The study was introduced to parents as a study on indoor allergens and air pollution, without mentioning nicotine or ETS.
Measurements of air nicotine concentrations
Air nicotine concentrations were measured for approximately two weeks in the living rooms of the participants’ homes with passive monitors described earlier.14 Trained fieldworkers installed monitors during the first home visit and removed them during the second home visit. Ninety six per cent, 88%, and 95% of the measurement periods in Germany, the Netherlands, and Sweden were 14 (±2) days long; measurement periods ranged from 11–20, 7–29, and 9–22 days, respectively. All monitors were prepared at Yale University, New Haven, CT, USA and analysed at the University of California, Berkeley, CA, USA. For calculation of the limit of detection, field blanks were taken in approximately 20 randomly selected homes per country. The limit of detection (LOD) defined as three times the standard deviation of these blanks was 0.08 μg/m3. Values below the LOD were assigned a value 2/3×LOD.
Questionnaire information on smoking
The same standardised questionnaire was used in all three countries. Parents were asked to report the number of days during the measurement period on which household members and visitors had smoked in the living room along with the number of cigarettes, cigars, and pipes. In addition, parents in Germany were asked to report smoking of household members and visitors in the child’s home during the 24 hours prior to urine sampling. Moreover, from all four cohorts data on residential ETS exposure at the child’s age 4 are available. Questions on smoking in the child’s home from the 4-year questionnaires differ between cohorts with regard to the persons and the time they refer to (BAMSE, current smoking of household members; GINI, any smoking in the child’s home during the past 12 months; LISA, any smoking in the child’s home during the past two years; PIAMA, current smoking of household members and other persons); and in contrast to the questions for the measurement period, they refer to the child’s home in general and not to the living room specifically.
Measurements of urinary cotinine concentrations
Measurements of urinary cotinine were performed in the German centre only. If possible, morning urine was collected on the last day of the two week measurement period and stored frozen until analysis. Cotinine levels were measured with a reverse phase high performance liquid chromatography method with ultraviolet detection described earlier.15 In some cases high performance liquid chromatography extracts were re-extracted in ethyl acetate and measured by gas chromatography/mass spectrometry. The LOD was 2 ng/ml. Creatinine was measured by auto-analyser using an enzymatic colour reaction and cotinine concentrations were expressed as μg/g creatinine. Values below the LOD were assigned a value 2/3 the lowest observed detectable value.
Statistical analysis
Questionnaire reported smoking during the measurement period and during the 24 hours prior to urine sampling was classified into four categories (none, occasionally, ⩽5 cigarettes daily, and >5 cigarettes daily) and three categories (none, ⩽5 cigarettes, and >5 cigarettes), respectively. Since smoking of cigars and pipes was rare (n = 5 homes in total), we combined data on cigarettes, cigars, and pipes. One cigar was equated to four cigarettes according to Boffetta et al;16 one pipe to one cigarette. Agreement between different measures of exposure is presented as sensitivity, specificity, positive predictive value, negative predictive value, and percentage misclassified. Air nicotine and urinary cotinine concentrations were divided into two categories using the limit of quantification (LOQ = the smallest concentration that can reliably be quantified, defined as three times the LOD) as cut-off for air nicotine and the LOD as cut-off for urinary cotinine.
RESULTS
Air nicotine concentrations and questionnaire reported smoking during the measurement period were available for 347, 335, and 354 German, Dutch, and Swedish homes. The comparison of urinary cotinine concentrations with questionnaire reported smoking and air nicotine was based on data from 307 German children.
Questionnaire reported smoking and housing characteristics
Country specific prevalence and amount of smoking during the measurement period, during the 24 hours prior to urine sampling and when the child was 4 years old, along with some housing characteristics, are presented in table 1. For the majority of homes no smoking in the living room was reported for the measurement period. In homes with reports of smoking, it was usually the household members (with and without visitors) who smoked. Smoking visitors in non-smokers’ homes were rare except for the Netherlands. Smoking during the measurement period and smoking during 24 hours prior to urine sampling were in agreement for 91% of the homes. Smoking was more often reported in the regular cohort questionnaires at age 4 years compared to the measurement period. However, prevalences cannot be compared directly since 4-year questionnaires refer to smoking anywhere in the child’s home while measurement period questionnaires refer to the living rooms only. In addition, smoking by persons other than household members was not included in the Swedish 4-year questionnaires. Nevertheless, the two questionnaires were in agreement for more than 80% of the homes (table 2). In the Dutch cohort agreement was much better for household members (94%) compared to guests (81%), which is in line with the 10% of homes for which the amount of smoking during the measurement period was reported to be higher than normal.
Questionnaire reported indoor smoking during the measurement period and in the 24 hours prior to urine sampling, and other study home characteristics
Agreement between questionnaire reported smoking during the AIRALLERG measurement period and questionnaire reported smoking from the cohort questionnaires at age 4 years
Air nicotine concentrations and questionnaire reported smoking
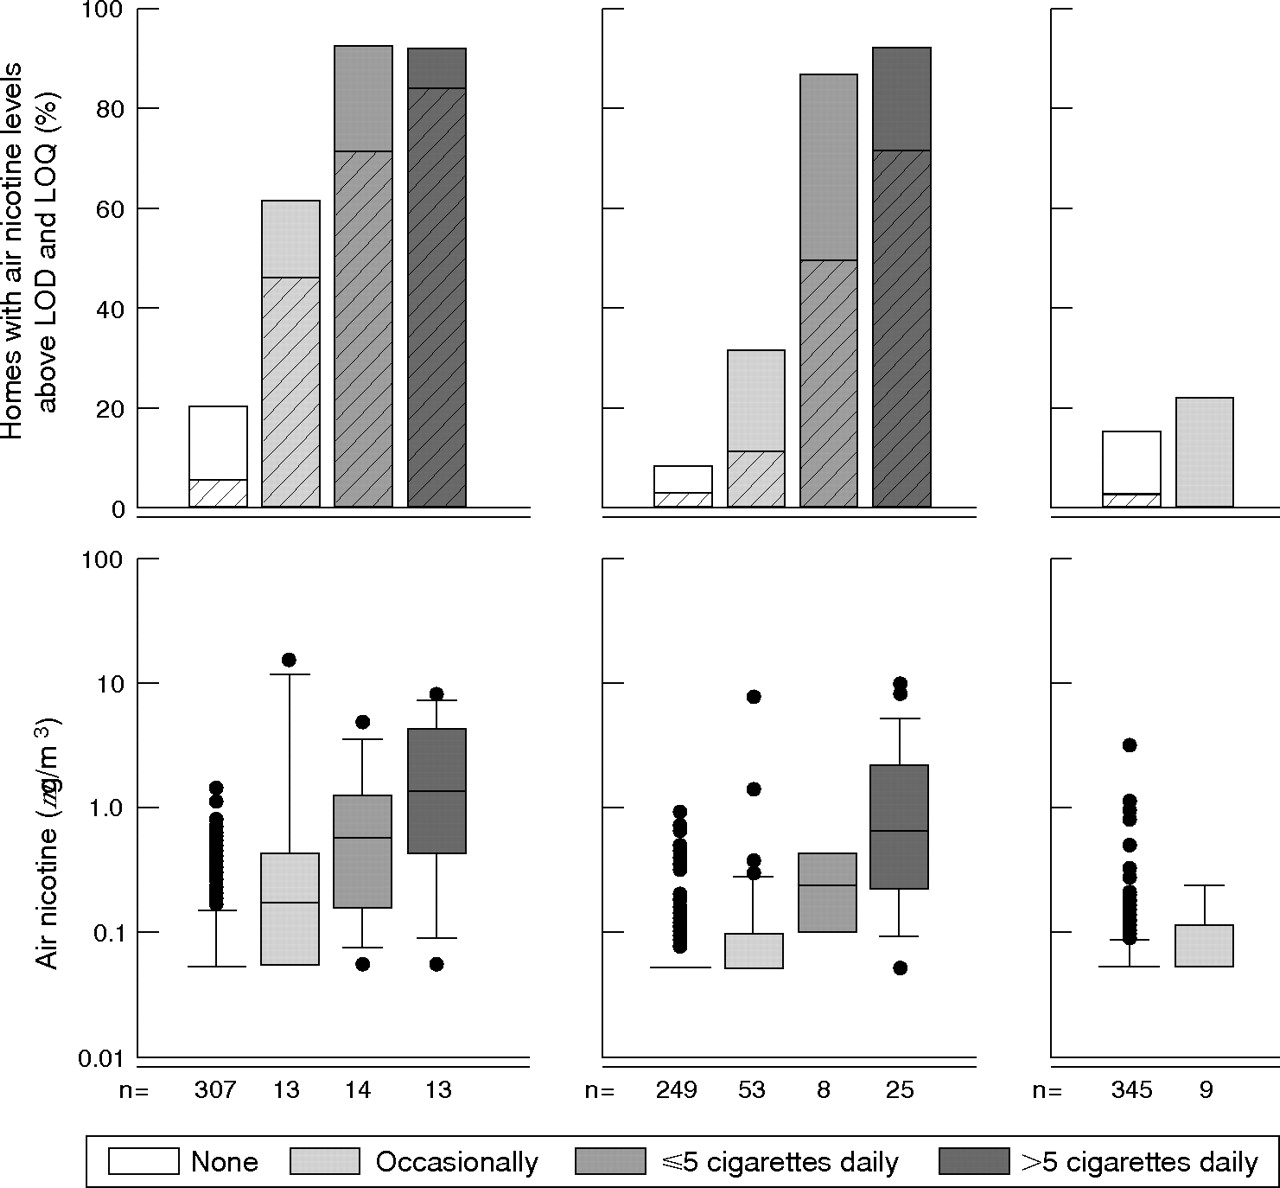
Air nicotine concentrations ranged from <LOD (73%, 79%, and 89%) to 14.3 μg/m3, 10.2 μg/m3, and 3.2 μg/m3 in Germany, the Netherlands, and Sweden. Percentage of homes with air nicotine concentrations >LOQ was 13%, 11%, and 3%. Figure 1 shows that air nicotine concentrations increase with questionnaire reported amounts of smoking (median nicotine concentrations were: <LOD, 0.18 μg/m3, 0.59 μg/m3, and 1.37 μg/m3 in Germany; <LOD, <LOD, 0.25 μg/m3 and 0.65 μg/m3 in the Netherlands; <LOD in Sweden). Air nicotine concentrations were much higher in Germany compared to the Netherlands and Sweden. Results remained unchanged when we excluded families that had been away from home for more than two days during the measurement period (n = 40, 28, and 47 in Germany, the Netherlands, and Sweden).

Percentage of homes (living rooms) with air nicotine levels above the limit of detection (LOD = 0.08 μg/m3, plain bars) and above the limit of quantification (LOQ = 0.24 μg/m3, diagonally striped bars) and distribution of air nicotine levels in Germany, the Netherlands, and Sweden related to questionnaire reported smoking in the living room during the measurement period.
The agreement between questionnaire reports of smoking and air nicotine concentrations is presented in table 3. In Germany and the Netherlands, sensitivity and positive predictive value were fair to good indicating some misclassification. However, nicotine levels in living rooms without reports of smoking were generally low. In both countries, positive predictive value increased when homes with occasional reports of smoking were excluded. In Sweden, sensitivity and positive predictive value were poor. However, they should be interpreted very carefully due to the small number of children with questionnaire reported smoking. Specificity and negative predictive value were larger than 90% in all three countries (except for the Netherlands and any smoking)—that is, almost all homes with non-quantifiable air nicotine concentrations were reported to be non-smoking homes and almost all non-smoking homes had air nicotine concentrations below the limit of quantification. Percentages of homes misclassified were low. Data on residential ETS exposure collected with the standard cohort questionnaires when the children were 4 years old performed only slightly worse than smoking during the measurement period.
Agreement between (A) air nicotine concentrations and questionnaire reported smoking; and (B) between urinary cotinine and questionnaire reported smoking and air nicotine: sensitivity, specificity, positive and negative predictive value, and percentage misclassified
Urinary cotinine concentrations and questionnaire reported smoking and air nicotine
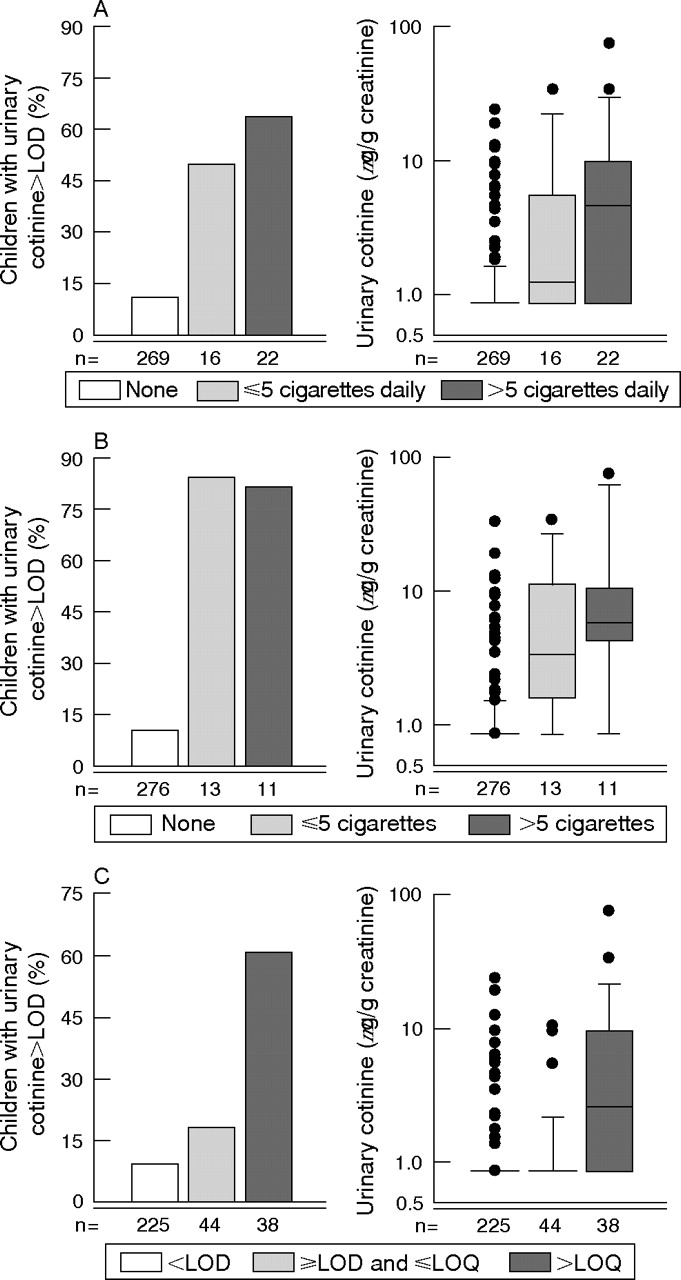
Urinary cotinine concentrations ranged from <LOD (83.1%) to 74.6 μg/g creatinine. Questionnaire reported smoking and urinary cotinine levels match very well: median cotinine concentrations were highest in children from homes with reports of more than five cigarettes daily (median concentrations were: <LOD, 1.5, 3.5, and 5.8 μg/g creatinine, respectively; fig 2). The difference in cotinine levels between children with and without reports of smoking during 24 hours prior to urine sampling was less pronounced (<LOD v 3.3 μg/g creatinine). The results remained unchanged when we excluded families that had been away from home for more than two days during the measurement period. Median cotinine concentrations were highest in children from homes with air nicotine concentrations >LOQ.

Percentage of children with detectable urinary cotinine levels and distribution of urinary cotinine levels in Germany, related to (A) questionnaire reported smoking anywhere in the participant’s home during the 24 hours prior to urine sampling; (B) questionnaire reported smoking in the living room during the measurement period; and (C) air nicotine concentrations. The limit of detection (LOD) for air nicotine was 0.08 μg/m3, the limit of quantification (LOQ) 0.24 μg/m3.
The agreement between questionnaire reported smoking, air nicotine, and urinary cotinine concentrations is presented in table 3. Again, sensitivities were moderate, positive predictive values were fair to good, and specificities and negative predictive values were very good. Thus, there was a considerable percentage of children with detectable urinary cotinine concentrations who had no reports of smoking, and there were some (but fewer) children with questionnaire reports of smoking who had urinary cotinine levels <LOD. The agreement with urinary cotinine concentrations was somewhat better for smoking during the measurement period compared to smoking during the 24 hours prior to urine sampling and smoking reported at age 4 years. There was a considerable percentage of children with detectable urinary cotinine concentrations who had air nicotine levels ⩽LOQ and children with air nicotine levels >LOQ who had urinary cotinine levels above the limit of detection. Percentages of children misclassified were low for questionnaire reported smoking and somewhat higher for air nicotine.
Assessment of the impact of the symptom status of the children
Parents of asthmatic children might be more likely to underreport smoking than parents of non-asthmatic children. We tested this hypothesis by excluding symptomatics (that is, children with a diagnosis of asthma or symptoms of wheeze and nocturnal dry cough without a cold during the past 12 months when they were 4 years old; 23%, 38%, and 26% in Germany, the Netherlands, and Sweden, respectively) from the analysis. Sensitivities did not increase (data not shown).
DISCUSSION
Air nicotine concentrations and urinary cotinine concentrations increased with increasing amounts of questionnaire reported smoking in a dose-response fashion. Specificity and negative predictive values of questionnaire reports for nicotine and cotinine concentrations were excellent. Sensitivity and positive predictive values were moderate to good indicating some misclassification. A similar agreement was found between air nicotine concentrations and urinary cotinine levels. There was no indication of a systematic underreporting by parents of symptomatic children.
Air nicotine concentrations measured in the present study were comparable to concentrations that have been reported from a Dutch17 and a US study,18 but air nicotine concentrations in the homes of smokers who smoked more than five cigarettes daily (median 1.37 and 0.65 μg/m3) were somewhat lower then concentrations that have been reported from a Korean study (median = 3.23 μg/m3 for homes where six or more cigarettes were smoked daily)19 and another US study (geometric mean = 0.66 μg/m3 for homes without smoking restrictions).20 Within the present study we also found differences in air nicotine concentrations between countries: median air nicotine concentrations in German homes were approximately twice as high as air nicotine concentrations in Dutch homes. We hypothesise that the higher percentage of open kitchens in the Netherlands—by itself and via differences in ventilation habits and the use of ventilation appliances—is at least partly responsible for this difference. Furthermore, Dutch living rooms were somewhat bigger than German living rooms, which might also result in lower air nicotine concentrations per cubic meter of air associated with the same amount of smoking. Ventilation (windows opened frequently during measurement period) was significantly associated with air nicotine concentrations in Germany and the Netherlands (data not shown). However, the number of homes with reports of smoking or air nicotine concentrations above the limit of quantification was too small for a stratified analysis by ventilation. Statistically significant associations were not found between air nicotine concentrations and the presence of an open kitchen and the volume of the living room in Germany and the Netherlands. In Sweden, the number of homes with reports of smoking was too small to allow any further investigation.
Previous studies on the validity of questionnaire reported smoking show different results. Some authors found strong associations between air nicotine concentrations and questionnaire reported smoking,7,17,21 whereas others indicated an underreporting.22,23 In the present study, there was a clear dose-response relation between questionnaire reported smoking and air nicotine concentrations. However, sensitivity of the questionnaire was only fair to good—that is, no smoking was reported by questionnaire for a considerable percentage of homes with air nicotine concentrations above the limit of quantification. The reason for this could be either underreporting out of guilt or denial, or smoking outside the home (for example, on the balcony), which was found to reduce ETS exposure but does not completely protect the home from exposure.18 The same probably holds for smoking in rooms other than the living room. Neighbours’ smoking might be another source of nicotine for people living in apartment buildings. Although we did not ask parents about smoking on the balcony (which is frequently attached to the living room) or in rooms other than the living room, several families reported this to our field workers without being asked. All cohorts collected questionnaire information on smoking anywhere in the child’s home around the child’s fourth birthday, which we assume to be a valid estimate of the child’s residential ETS exposure. We compared this information with the information collected within the present study and found moderate to good agreements in Germany and the Netherlands. Agreement in the Netherlands increased considerably when smoking was restricted to household members and then was in agreement with previous findings.17 Potential explanations are that there were by coincidence more smoking visitors during the AIRALLERG measurement period than normal (in line with the 10% of homes for which smoking during the measurement period was reported to be more than normal; table 1) or that people tend to underestimate guests’ smoking when they are asked about it in general, whereas they remember smoking visitors very well when asked about a two week period. Agreement in Sweden was found to be poor indicating that Swedish parents do smoke, but not in the living room. This might explain at least part of the extremely low sensitivity and positive predictive value. We tested this hypothesis by using age-four information on residential ETS exposure in Sweden. This resulted in a considerably higher sensitivity, but the positive predictive value remained poor. The fact that not only sensitivities but also positive predictive values were not very good in Germany and the Netherlands argues against exclusive underreporting. Likewise does the fact that prevalence of questionnaire reported smoking was the same magnitude as prevalence of air nicotine concentrations above the limit of quantification (Germany 12% v 13%, Sweden 3% v 3%) or larger (Netherlands 25% v 11%) argue against exclusive underreporting. The overall percentage of homes misclassified has been found to be low, but these figures must be interpreted carefully. They are strongly influenced by the large number of unexposed children, which are correctly classified as unexposed by either method of exposure assessment. Percentages of homes misclassified would be much higher in populations with higher prevalence of smoking (and the same sensitivity, specificity, positive and negative predictive values).
Urinary cotinine is frequently used as a biomarker for nicotine intake.24 Urinary cotinine levels in children with questionnaire reported ETS exposure in the present study were in agreement with the levels reported by Matt et al18 for children with indirect exposure and much lower than the levels reported for children with direct exposure. However, no information about the direct or indirect nature of exposure is available for the present study. Due to its half-life, it is considered to be a good indicator of recent exposure.1 The present study indicates however that urinary cotinine concentrations somewhat better reflect daily exposure to ETS during a 14 day measurement period than smoking during the 24 hours prior to urine sampling. Although urinary cotinine provides an integrated measure of exposure experienced by a subject across a number of micro-environments (that is, that it reflects more than domestic ETS exposure), the agreement between urinary cotinine concentrations and questionnaire reports of smoking and air nicotine measurements was good. Information on ETS exposure experienced outside the home might improve this agreement.25 No information on exposure outside the child’s home was collected within the present study. However, we do have questionnaire information from the original German cohort studies, which indicates that exposure outside the child’s home is uncommon (only 3.4% were exposed at least once a week at age 4 years).
Avoidance of misclassification is a major concern in epidemiological studies, in particular avoidance of differential misclassification—that is, misclassification associated with the outcome under study that can result in systematic over- or underestimation (or even reversal) of health effects. Differential misclassification by questionnaire reported smoking was reported by Clark et al22 who found that parents of asthmatic children were more likely to underreport smoking than parents of non-asthmatic children. We tested this hypothesis by excluding symptomatic children, but sensitivities did not increase. As the present study was introduced to parents as a study on indoor allergens and air pollution, without mentioning nicotine or ETS, we believe that results were not influenced by the parents’ potential concern with ETS exposure. Although there might be some underestimation of the child’s ETS exposure by using questionnaire information, we think that there is a sufficiently good agreement between questionnaire reports of smoking, air nicotine, and urinary cotinine concentrations to justify the use of questionnaires to assess ETS exposure. Moreover, using questionnaires is less time consuming and less costly than measuring air nicotine or urinary cotinine. In particular in large studies and/or studies of children’s health in populations with a known low prevalence of smoking, measuring urinary cotinine or air nicotine means spending considerable amounts of time and money to measure large numbers of values below the limit of detection. However, measuring air nicotine instead of or complementary to questionnaires might be useful in settings where there is concern about biases in ETS exposures as reported by the study participants and a more objective marker of ETS exposure is needed, or if exposure to ETS is the main exposure variable and therefore a more accurate exposure assessment is desired. In the present study, air nicotine has been measured as part of a fixed measurement programme including air nicotine and other exposures. If we had performed a study on nicotine and questionnaire reported ETS only, we would have enriched our study population (based on prior knowledge) with children living in smokers’ households. Furthermore, response rates were lower for urine samples compared to questionnaires (almost everyone answered our questions on smoking, compared to urine samples obtained from 89% of the children). Urinary cotinine is the only biomarker that has been measured in the present study. It is one of the most widely used biomarkers; due to its short half-life it only reflects recent exposure. However, there are others such as hair nicotine or plasma and saliva cotinine, which have not been included in the present study. For a review of these methods see Benowitz24 and Jaakkola et al.6
Comparisons of smoking prevalences between the present study and the general population are limited, because questions asked in the AIRALLERG study were very specific referring to ETS exposure at the participants’ homes or, even more specifically, the participants’ living rooms. No such data are available for the general population. In a recent German national survey, 32–39% of adults aged 30–44 years living together with a partner and children reported to be current smokers.26 Figures for the Netherlands are very similar (see http://www.stivoro.nl/cijfers.html). In Sweden, 6% of 6 year old children were reported to have a daily ETS exposure (Bellander, personal communication). However, due to the difference in questions asked, it is not clear how these percentages compare to the percentages reported from the present study. No significant difference in prevalence of parental reported smoking was found between symptomatic and non-symptomatic children. We therefore do not expect our data to be influenced by the children’s health status. In all countries, the prevalence of ETS exposure decreases with increasing educational level. As parents with a high level of education are overrepresented among the participants of the present study, the percentages found in the present study are most likely lower than those in the general population.
Main message
-
Questionnaire reports are an inexpensive and valid estimate of environmental tobacco smoke (ETS) exposure among preschool and school children.
Policy implication
-
Epidemiological studies using questionnaires to assess exposure to ETS are suitable to assess the impact of ETS on the respiratory health of children.
CONCLUSION
Despite some misclassification, questionnaire reports are an inexpensive and valid estimate of ETS exposure among preschool and school children.
Acknowledgments
We are indebted to all scientists and technical staff involved in the planning and conduction of the AIRALLERG study and the BAMSE, GINI, LISA, PIAMA birth cohort studies.
REFERENCES
Footnotes
-
Published Online First 15 August 2006
-
The AIRALLERG study was funded within the European Union Quality of Life and Management of Living Resources Program, Key action Environment and Health (Proposal No QLK4-2000-00073). Ulrike Gehring was supported by a post-doc fellowship of the German Academic Exchange Service (DAAD).
-
Competing interests: none.