Article Text

Abstract
Objective: To investigate the risk of congenital anomalies in relation to an index of geographic density of landfill sites across 5×5 km grid squares in England.
Methods: 2 km zones were constructed in a geographical information system around 8804 landfill sites, including 607 that handled special (hazardous) wastes, and intersected with postcode coordinates of over 10 million births (136 821 with congenital anomalies), 1983–98. A landfill exposure index was calculated to represent the geographic density of landfill sites within 2 km of births for each 5×5 km grid square, calculated separately for landfill sites handling special, and non-special or unknown, waste. For each group of landfills, the index was classified into four categories of intensity, and risks for the second, third and top categories were compared to the bottom category, comprising areas with no such landfill sites within 2 km (index of zero). We used hierarchical logistic regression modelling in a Bayesian framework, with adjustment for potential confounding.
Results: For special waste sites, adjusted odds ratios were significant for the third category of the landfill exposure index for all anomalies combined and cardiovascular defects (OR 1.08 (95% credible interval 1.02 to 1.13) and 1.16 (1.00 to 1.33), respectively) and for hypospadias and epispadias for the third and top categories (OR 1.11 (1.02 to 1.21) and 1.12 (1.02 to 1.22), respectively). After adjustment, there were no excess risks in relation to sites handling non-special or unknown waste types.
Conclusions: There was a weak spatial association between risk of certain congenital anomalies and geographic density of special (hazardous) waste sites at the level of 5×5 km grid squares. Exposure pathways and mechanisms to help interpret these findings are not well-established.
Statistics from Altmetric.com
Several studies have investigated the risks of congenital anomalies in populations living close to landfill sites; most1–13 but not all14–16 have reported excess risks for one or more anomalies. Toxicants potentially emanating from landfill sites include heavy metals, volatile organic compounds, pesticides, solvents and other organic compounds,17 via contaminated air or soil, leaching or runoff,18 or dispersal by animals and birds, although evidence for human exposure to landfill emissions is largely lacking.19
Because of the difficulties in measuring exposures, in most studies proxy exposure indicators have been used, typically distance from the nearest landfill (eg, 2 or 3 km5 7 12) or residence within a predefined zone (eg, census tract3–9). In by far the largest of the studies to date, which included 9565 landfill sites in Great Britain, we reported small excess risks of some specific anomalies and all anomalies combined, among populations living within 2 km of landfill sites compared with risks for those living further away.7 While some residences were within 2 km of 30 or more sites, equal weight was given to populations living within 2 km of one or many landfill sites,7 although exposure to landfill emissions might potentially be higher in areas with greater concentrations of sites. We report here on the variation in risk among areas with differing geographic densities of landfill sites, based on the national database of landfill sites7 and the routine reporting of congenital anomalies, births and terminations in England.
METHODS
Landfill sites
From a database of all landfill sites in Great Britain,7 data were obtained on 16 272 landfill sites in England. Locations were defined by the geographic co-ordinates of a point within the site (usually the gateway), to a notional accuracy of ∼100 m. Other data (not available for all sites) comprised opening and closing dates (calendar year) and type of waste handled (special/non-special). Because of concerns about the quality and completeness of the landfill data before 1982, when registration of sites became compulsory, the main analysis is restricted to 8804 sites with opening dates confirming that they were operational at some time between 1982 and 1997. These sites include 607 that handled special (hazardous) waste and 8197 with non-special or unknown waste type. Of the remaining 7468 sites (223 handling special waste), 2580 closed before 1982 and 4888 had missing opening and/or closing dates. Data for all 16 272 sites (830 handling special waste) were included in a sensitivity analysis.
Congenital anomalies and birth data
As previously,7 (i) we used postcoded data on congenital anomalies for 1983–1998, lagged by 1 year compared with the landfill data, from the National Congenital Anomaly Register (covering both live and still births) and data on terminations (only those performed for “grounds E” of the 1967 Abortions Act: “where there is a substantial risk that if the child were born it would suffer from such physical or mental abnormality to be seriously handicapped”) and (ii) we included the following specific anomalies (International Classification of Diseases (ICD) codes): hypospadias and epispadias (ICD9 752.6; ICD10 Q54.0–Q54.9, Q64.0), cardiovascular defects (ICD9 745.0–747.9; ICD10 Q20.0–Q28.9), neural tube defects (ICD9 740.0–740.2, 741.0–741.9, 742.0; ICD10 Q00.0–Q00.2, Q05.0–Q05.9, Q01.0, Q01.9) and abdominal wall defects (ICD9 756.7; ICD10 Q79.2–Q79.4). Excess risks have been reported previously for these specific anomalies.5 7 We also considered all congenital anomalies combined (ICD9 740–759; ICD10 Q00–Q99). Multiple anomalies were counted under each outcome (once only for all anomalies combined). As denominator, we used annual postcoded data on live births, still births and terminations.
Geographical information system methods
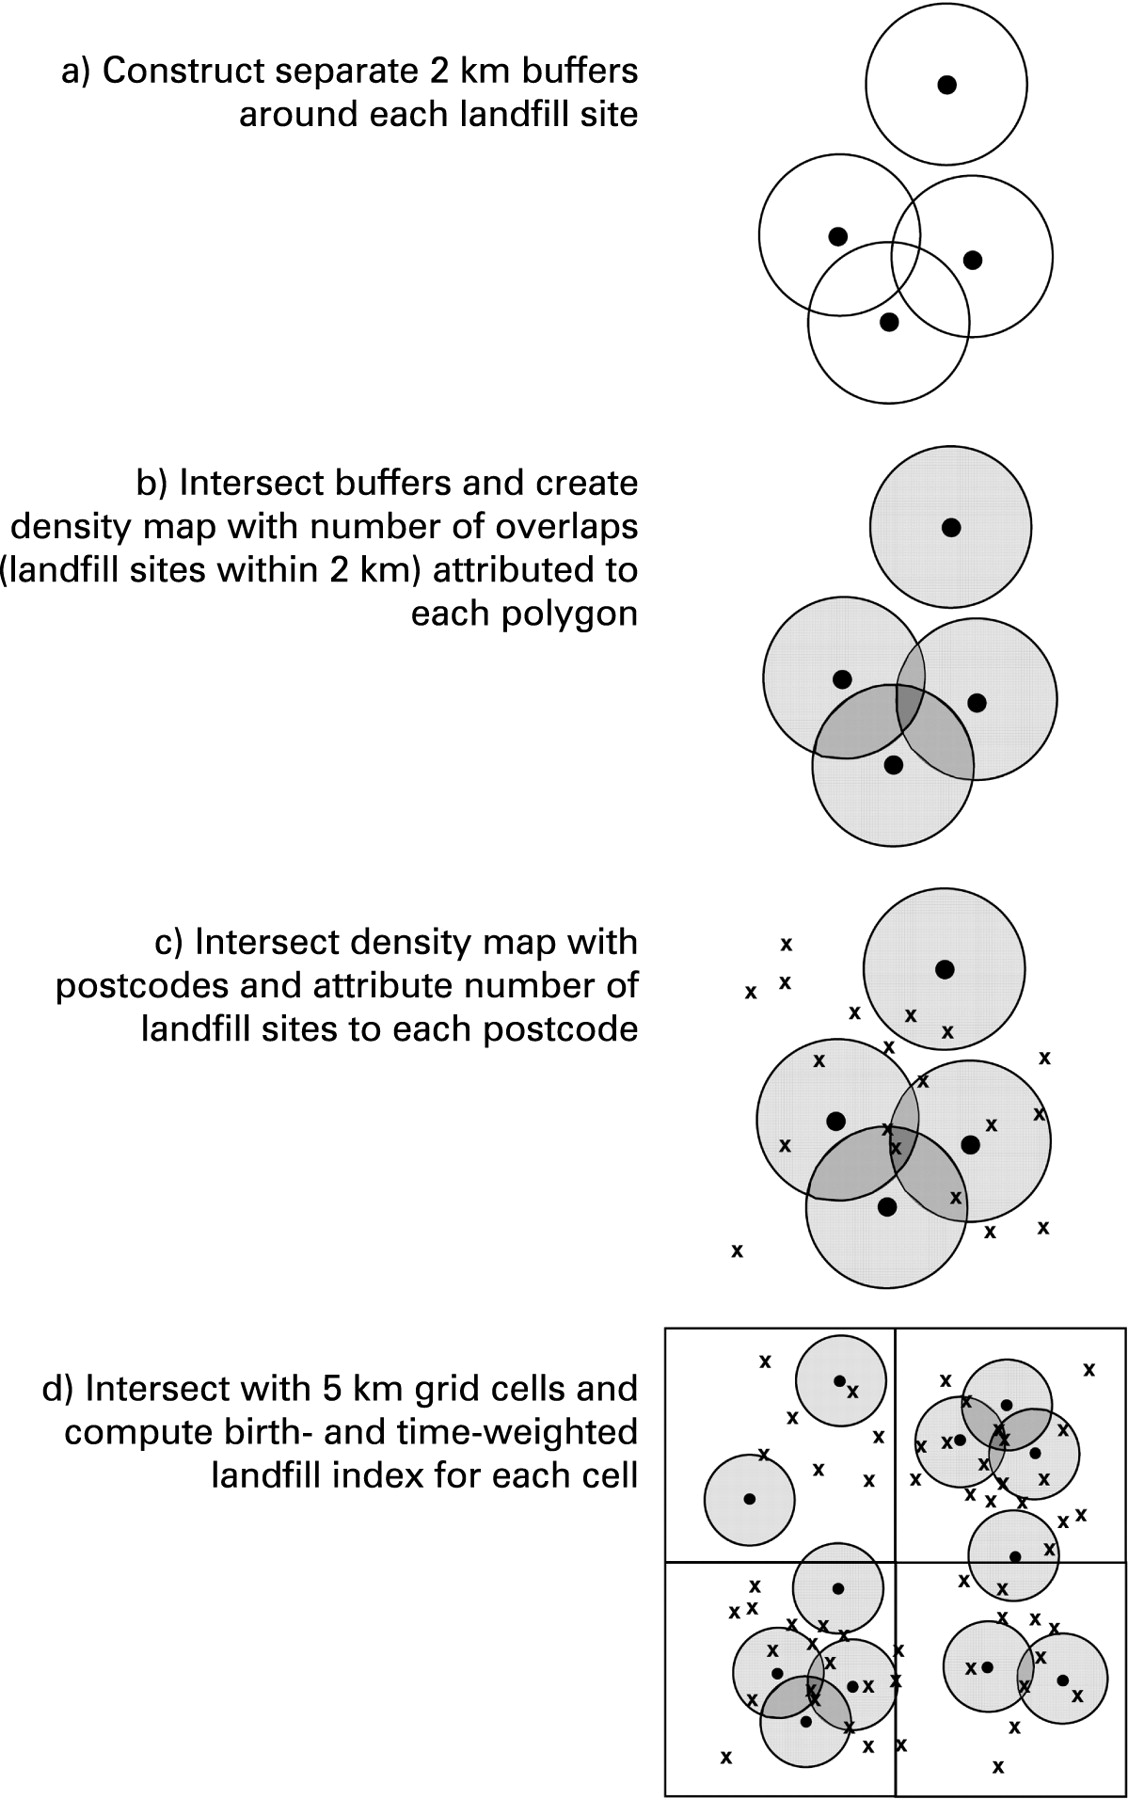
Linkage of data on landfills, births and anomalies was carried out using a geographical information system (ArcGIS v 8). We divided England into a grid of 5×5 km squares based on the UK National Grid. In each grid square, every birth was classified in terms of its proximity to a landfill site 1 year previously (to allow for latency) by buffering around the landfill sites at a radius of 2 km (the likely limit of pollutant dispersion20) and intersecting the resulting polygons with the postcodes of birth and then with the 5×5 km grid (fig 1). A latency of 1 year was used because the operational dates of the landfill sites were not accurate to shorter time periods. The number of birth-years within 2 km of a landfill site and the total number of birth-years within each 5×5 km grid square were then computed by summation and a landfill exposure index computed as the ratio of the two (see statistical appendix). The resulting index thus gives a site-weighted measure of the proportion of births in each 5×5 km grid square that were within 2 km of a landfill site. A value of one in this index could arise, for example, where all births in that square were within 2 km of a single landfill site, or where exactly half the births were within 2 km of two landfill sites. Each increment of the exposure index consequently represents the equivalent of adding one site within 2 km of all births. The total number of congenital anomalies (for each group of interest) in each 5×5 km grid cell was also computed by summation. Analysis was done for special and non-special or unknown waste sites separately. We included open sites as well as those that had closed after 1982, since both can give rise to emissions.20

Data on potential confounders
To control for socio-economic confounding, we used the Carstairs score at enumeration district level (average area 1.3 km2, average population 440). This is a composite indicator of deprivation in the UK, based on four census variables (unemployed head of household, car ownership, over-crowding and low social class). To adjust for maternal age,21 we calculated proportions of births in women under 20 years of age and in women aged 35 and above in each grid square, since maternal age shows a U-shaped relationship with risk of congenital anomalies.22 We classified each grid square as to whether it was within or outside a local congenital anomalies register catchment area, extracted from the British Isles Network of Congenital Anomaly Registers; registers were included if they operated at any time during the study period. Data on other potential confounders (eg, ethnicity, marital status, occupation of the mother) are not available in the routine births or congenital anomalies databases.
Statistical methods
We combined data on congenital anomalies and births over the 16 years of the study; by aggregating over time, we averaged out any temporal trends. Of 5437 grid squares in England, 1003 had no cases of congenital anomalies during the study period, and 2675 had three or fewer cases. For mapping purposes, because of sparse data, we smoothed the raw risks (number of cases divided by number of births in each grid square) to the global mean (see statistical appendix). We divided the landfill exposure index, for both special and non-special or unknown sites, into four categories. The reference category had no landfill sites within 2 km of the respective type (special/non-special or unknown); this comprised 4592 (84% of grid squares) for special sites and 1751 (36% of grid squares) for non-special or unknown sites. The other three categories were selected to contain approximately equal numbers of grid squares. Rates of congenital anomalies were calculated for each of these four categories; we then obtained unadjusted odds ratios and 95% confidence intervals for the second, third and top categories compared with the bottom category, that is, grid squares with a landfill exposure index of zero. We then used Bayesian hierarchical logistic regression models with random effects23 to estimate the adjusted odds ratios of congenital anomalies and 95% credible intervals (CI)i, with allowance for data sparseness. Potential confounders included were deprivation, the presence or absence of a local congenital anomalies register and maternal age. As the proportions by maternal age were subject to substantial variability due to sparseness of the data, statistical smoothing was applied before introducing them as covariates (see statistical appendix). We carried out the analyses using WinBUGS freeware (http://www.mrc-bsu.cam.ac.uk/bugs). In sensitivity analyses, we included percentage of industrial land and percentage of urban land (derived from satellite data) as additional potential confounders. We also examined risks for the top three categories of the landfill index combined versus the bottom category (landfill index of zero), for special waste sites, non-special and unknown waste, and all landfill sites combined. We repeated the main analyses including only those areas with a local congenital anomalies register (n = 3302 5×5 km grid squares). For all grid squares, we also carried out analyses by logistic regression using a generalised linear mixed model (GLMM) to allow for over-dispersion due to sparse data.24
RESULTS
Between 1983 and 1998 there were 10 064 382 live births, 52 532 still births and 12 373 terminations in England. Of those, 136 821 had congenital anomalies, giving an annual rate of 1350.8 congenital anomalies per 100 000 births. For the specific anomalies, there were 12 276 cases of hypospadias and epispadias (121.2 per 100 000 births), 8609 cardiovascular defects (85.0 per 100 000 births), 5606 neural tube defects (55.3 per 100 000 births) and 2389 abdominal wall defects (23.6 per 100 000 births).
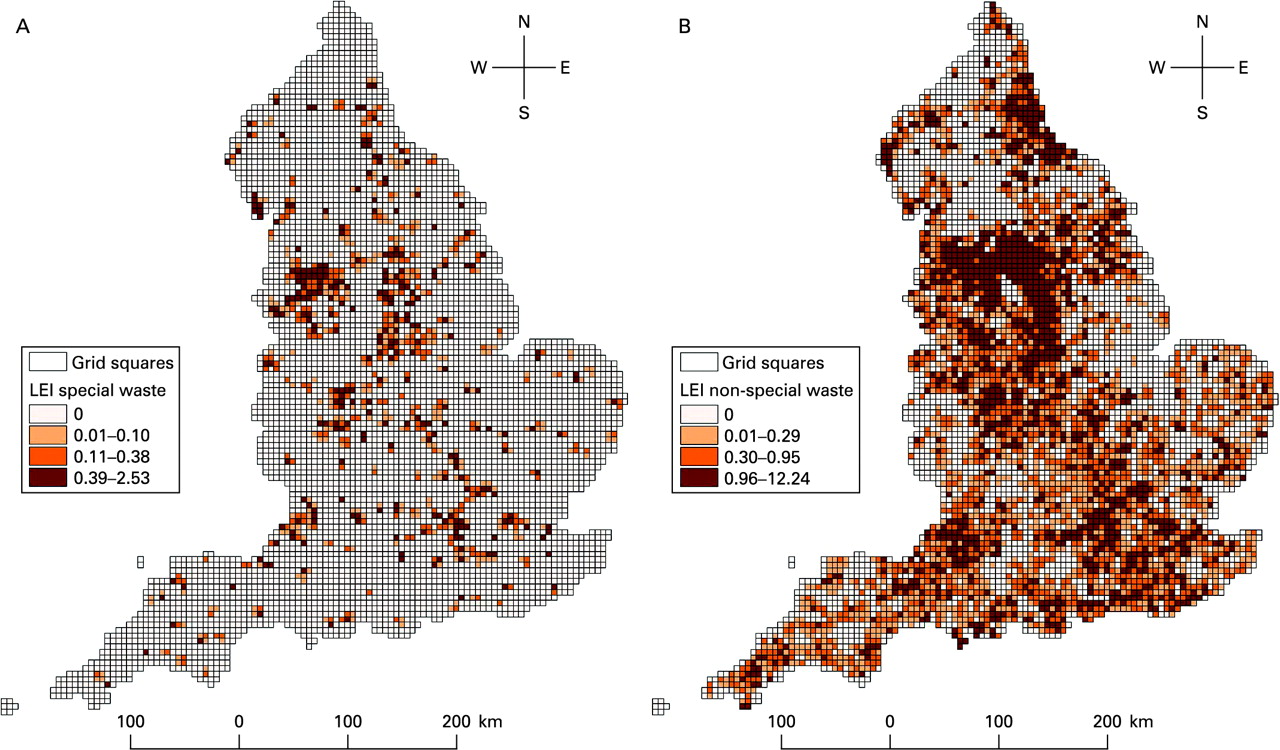
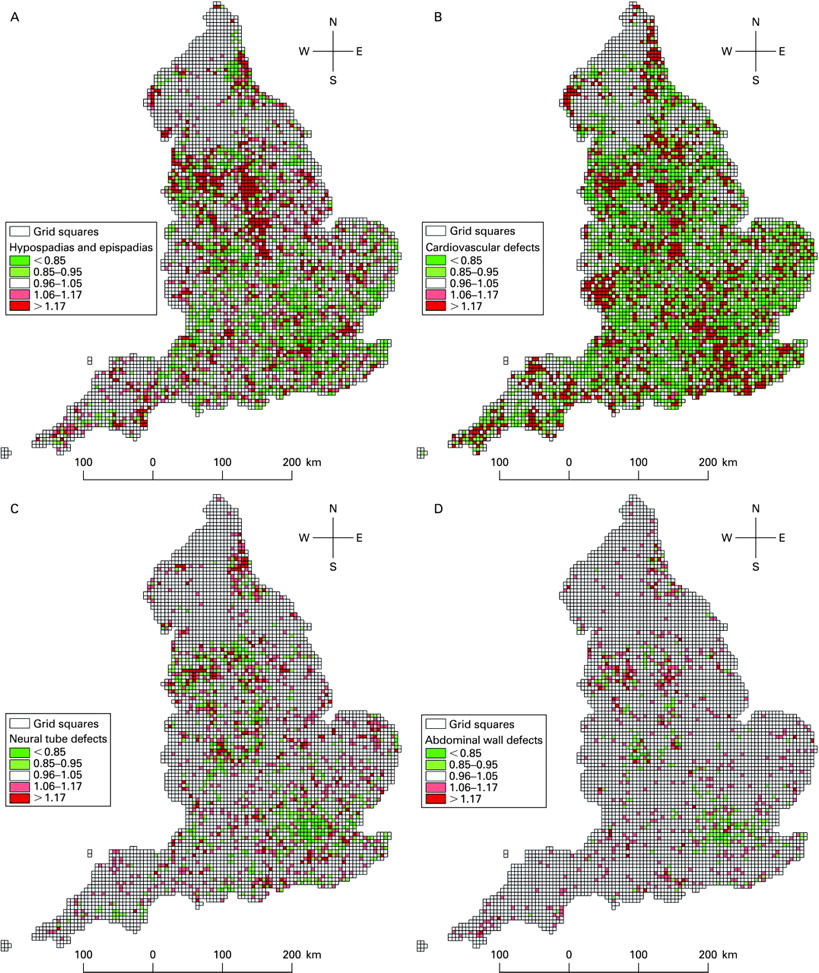
Maps of smoothed relative risks for each of the four specific anomalies are shown in fig 2. For hypospadias and epispadias, and cardiovascular defects, the highest risks were found in the Midlands, north-west and north-east, focused on centres of population (where the effect of smoothing is less than in sparsely populated areas). Figure 3 shows maps of the landfill exposure index for special, and non-special or unknown waste sites. It ranged from zero (for 84% of grid squares) to 2.53 for special sites and from zero (32% of grid squares) to 12.24 for non-special or unknown waste sites (median 0.19, 75th centile 0.84).

Maps of the potential confounders are presented in fig 4. All show clear geographic patterns. The greatest deprivation was found in the Midlands, north-east, north-west and London conurbations. The highest proportions of births to mothers aged 35 years or more were found in the south-east, while births to mothers under the age of 20 were more predominant in the Midlands, north-west and north-east. There were strong correlations between deprivation and births among mothers under 20 years of age (Pearson r = 0.69), births among mothers over 35 years of age (r = −0.50), and between births among mothers under 20 and over 35 years of age (r = −0.61). The landfill exposure index showed low correlations (0.14<|r|<0.18) with these three variables. The presence of a local register was not correlated with the other confounders.

Table 1 shows results for special waste sites. Rates for all anomalies combined, hypospadias and epispadias, and abdominal wall defects all increased across the exposure categories. Compared with the bottom category (landfill exposure index of zero), the adjusted odds ratios were significant for the third category of the index for all anomalies combined and cardiovascular defects (OR 1.08 (95% credible interval 1.02 to 1.13) and 1.16 (1.00 to 1.33), respectively) and for hypospadias and epispadias for the third and top categories (OR 1.11 (1.02 to 1.21) and 1.12 (1.02 to 1.22), respectively). Results for hypospadias and epispadias were 1.14 (1.01 to 1.28) and 1.06 (0.94 to 1.18), respectively, when analyses were restricted to the 3302 grid squares covered by a local congenital anomalies register, and 1.08 (0.99 to 1.17) and 1.08 (1.00 to 1.17) when all 830 special waste landfill sites were included (supplementary tables S1 and S2). Significant findings for neural tube and abdominal wall defects in the unadjusted analyses were no longer significant after adjustment using the Bayesian model.
Table 2 shows results for non-special or unknown waste sites. Significant associations were found for each class of anomalies in unadjusted analyses; the largest risk was found for abdominal wall defects in the top category of the landfill exposure index (OR 1.23 (95% CI 1.06 to 1.43)). However, after adjustment in the Bayesian model, none of the odds ratios were significant.
When analyses were carried out combining the top three categories of the landfill index, a similar pattern emerged. After adjustment for potential confounders, there were significant excess risks for special waste sites for hypospadias and epispadias and all anomalies combined, and a borderline significant excess for abdominal wall defects. After adjustment, none of the risks for non-special or unknown waste sites were significant (see supplementary table S3).
Results were insensitive to the choice of the prior distribution for the variance of the random effects. Inclusion of percentage of industrial land and percentage of urban land as additional potential confounders made little difference to the results (not shown). Use of logistic regression for special waste sites in a frequentist paradigm using a generalised linear mixed model to allow for over-dispersion gave near identical results where the model was determined (see supplementary table S4).
DISCUSSION
For sites handling special wastes, we found a spatial association between geographic density of landfill sites (for the upper two categories of the landfill exposure index) and risk of hypospadias and epispadias at the scale of 5×5 km grid squares. After adjustment, and allowance for over-dispersion, there were no significant associations with sites handling non-special or unknown waste types.
For special sites, the positive association found here for hypospadias and epispadias broadly accords with results from our previous study, in which exposures were classified in terms of distance to the nearest landfill site (with a cut-off of 2 km as the limit for potential exposure).7 That study also found a significant association for special waste sites with cardiovascular defects; in the present study a significant excess of cardiovascular defects, after adjustment, was found only for the third category of the landfill exposure index but not for the top category. For non-special or unknown sites, we previously reported a positive association for most of the anomalies studied, whereas here we found no significant associations after adjustment, although estimated odds ratios above one were found for some anomalies (that is, neural tube and abdominal wall defects) for the top three categories of the landfill exposure index compared to the bottom (zero) category.
The differences between the results of this and our previous study might in part be ascribed to differences in methods and the exposure metrics used. Previously the exposure metric was binary (presence or absence of a landfill site within 2 km), whereas the landfill intensity index used here gives a continuous measure, which we then grouped into categories of potential “exposure” to landfill sites. In the previous study we directly compared areas with one or more landfill sites within 2 km with areas with no landfill sites, covering 75% of the population. In the most comparable analysis in the present study, in which we compared risks for areas that contained a landfill site compared to those with no landfill sites, we again found excess risks of hypospadias and epispadias for special waste sites but not for sites handling non-special or unknown wastes.
Associations between proximity to hazardous waste landfill sites and risk of congenital anomalies have been reported in other studies from Europe5 8 and the USA.2–4 9 A large case–control study reported excess risks of neural tube and cardiovascular defects, and hypospadias, within 3 km of hazardous waste landfill sites in five European countries.5 In the USA, excess risks were reported for a range of anomalies among racial or ethnic minority children living in census tracts containing National Priority List (hazardous waste) sites,9 and of cardiovascular defects in census tracts containing a site of potential environmental contamination.3 Geschwind et al constructed an “exposure risk index” for potentially hazardous waste sites in New York City within 1 mile of residences, similar to our landfill exposure index; it was associated with excess risks of nervous system, musculoskeletal and integument system defects.2 However, other, mainly smaller scale, studies reported no associations.13–15
While results reported here, from our previous report7 and from other studies are suggestive of an excess risk of certain anomalies near hazardous waste sites, data artefacts and potential confounding need to be considered, especially in the absence of data on emissions and human exposures.19 Registration to the Office for National Statistics of congenital anomalies in England is incomplete, and is higher for areas where there is a local congenital anomalies register.25 26 Registration of anomalies detected at birth should occur in the first month after birth; while the national register is kept open for later registrations,27 this may not happen in practice. In addition, the register does not include terminations, although we separately added data on terminations in this study. Registration is not uniform across the country but varies according to defect and the presence or absence of a local register, and by hospital catchment area.25 Concurrence of such spatial patterns with the distribution of landfill sites could lead to spurious associations. While to some extent we guarded against such possibilities by including a factor for the presence or absence of a local congenital anomalies register, more localised effects (reflecting perhaps local hospital practice) might still have been operating. Such effects occur at a fairly broad geographical scale compared with the small areas (5×5 km squares) included for analysis in our study, making systematic bias (eg, due to hospital registration practice) less likely. On the other hand, the sparse nature of the data, particularly for special waste sites, means that estimates of risk at the level of individual grid squares will be imprecise; to deal with this sparseness, model residual between-area variability and provide robust regression estimates, we included random effects for each grid square, introduced via hierarchical models in a Bayesian framework.23
Several sources of locational uncertainty need to be recognised in the data used here. While the site co-ordinates in the original data files were generally rounded to the nearest 100 m, in some cases they were apparently far more approximate (eg, to 1 km or more). As noted, co-ordinates usually referred to are the locations of the gateway to the site (in the year of reporting); thus they do not fully represent the centroid or geographic extent of the site, nor its evolution over time. Postcodes similarly provide only an approximate location for the place of residence. With an average of about 12 households per postcode, they represent very small areas in densely populated urban areas (in some instances, a single tower block). In remote rural areas, in contrast, a single postcode may cover an area of 1 km2 or more. There is thus the possibility for a degree of systematic bias in the exposure estimates (with less precise estimates in rural areas), although adjustment for degree of rurality as a potential confounder should have helped control for this to some extent. Before 2003, postcode files were also known to contain errors in the reported co-ordinates. Although attempts have been made to find and resolve these for this and other studies,28 some residual errors undoubtedly remain, which inevitably imply additional (although probably non-differential) exposure misclassification.
Main messages
-
Geographic associations of increased risks of congenital anomalies near landfill sites have been reported.
-
Previous studies have not differentiated between proximity to one or a large number of landfill sites.
-
We found significant excess risks of hypospadias and epispadias in relation to geographic density of special (hazardous) waste sites.
-
After adjustment, no significant excess risk was found in relation to landfill sites handling non-special or unknown waste types.
-
Further work is needed to evaluate possible risks and routes of exposure of landfill emissions to human populations.
Policy implications
-
The study adds to the evidence for a geographic association, albeit weak, between hazardous waste sites and risk of congenital anomalies.
-
The excess relative risks are small.
-
Mechanisms and pathways for environmental exposures to landfill emissions need to be better understood to help interpretation of whether or not these findings may represent causal associations.
Exposure misclassification is also likely in the categorisation of site types. While sites receiving hazardous wastes on a regular or significant basis have been subject to close inspection and regulation since 1982, and may be expected to be reasonably well-defined, the large number of sites handling unknown waste types provides the potential for some uncertainty. In practice, sites were likely to be of unknown type for three main reasons: because they were legally not subject to regulation due to the nature of their operation (eg, small dump sites on farms taking agricultural waste from the holding), because they were active only briefly and were not caught within the inspection regime during that period, or because they were informal sites that were not identified by the authorities. In many cases, the sites are likely to have been small, temporary and unlikely to be handling the more hazardous types of waste included in special waste sites. For the present analyses, we therefore grouped unknown and non-special waste sites, although it is acknowledged that this grouping will include a somewhat heterogeneous mix of sites, with differences in site management, regulatory oversight and types of waste, and consequent potential for exposure misclassification and dilution of risk estimates.
The use of distance as a basis for exposure classification is also an important limitation. More detailed analysis of sites, based on the specific types or volumes of waste handled, was precluded by the lack of consistent data. Equally, more detailed modelling of exposures (eg, using dispersion models) was not carried out, given the uncertainties in the locational data (eg, lack of boundaries) and the potential diversity of emitted pollutant species, with different chemistries and dispersion properties. However, such analyses are now becoming feasible for some sites as site records improve; any future studies of the reproductive effects of landfill sites may therefore be able to take advantage of such data, as well as improved registration data by focusing such studies in areas with a local congenital anomalies register.
Although the mechanisms and pathways for environmental exposures to landfill emissions are poorly understood, the results of this and other studies indicate a geographic association, albeit weak, between the risk of certain congenital anomalies and proximity to special (hazardous) waste sites. Further work is needed to evaluate possible risks and routes of exposure of landfill emissions to human populations. One need in this respect is for improved data on landfill sites, including waste types and volumes, and emissions. Better knowledge is also required concerning the environmental fate of pollutants released from landfill. In terms of epidemiological research, it seems likely that little more can be achieved by area-level or distance-based studies, or by studies of individual sites. Instead, there is a need for multi-site analyses using stronger study designs (eg, cohort, case–control) involving more explicit, individual-level exposure assessment.
Acknowledgments
We thank Alex Lewin for providing help with the computational issues and David Neasham for comments. We thank the Office for National Statistics for providing data on congenital anomalies, births, stillbirths and hospital admissions. We thank the Environment Agency in England and Wales for providing data on landfill sites and for their help in resolving discrepancies.
STATISTICAL APPENDIX
GIS methods
Computation of the landfill exposure index.
For each year, we constructed a 2 km radius circular zone – the likely limit of dispersion for landfill emissionsA1 – around each landfill site (whether open or closed).A2 We then intersected the resulting zones, year by year, to create a set of annual density maps constructed from the single and overlapping zones, representing the numbers of open and closed 2 km landfill site circular zones across the map. Next, postcode data were intersected with these coverages, year by year, and for each postcode the number of 2 km landfill site circular zones represented at that point was attributed to the postcode. We then multiplied the resulting counts by the number of births at each postcode, and summed across all years for each postcode. Finally, the postcodes were intersected with the 5×5 km grid and the time-weighted counts summed for each grid square and divided by the total number of births over all years in that grid square:

where LEIj is the landfill exposure index in grid square j, Bstj is the number of births within 2 km of landfill site s operating or closed in year t and Nj is the total number of births over all years in grid square j.
Carstairs score for each grid square
The Carstairs index is based on four 1991 census variables: unemployment, access to a car, overcrowding (number of persons per room) and social class of the head of household.A3 Scores were computed as the sum of the z scores of the four variables at enumeration district level (enumeration districts contain on average 440 people), standardised to England. Carstairs scores for each 5 km grid square were computed by intersecting the postcode locations with the enumeration districts, and averaging the scores across all postcodes in each grid cell:

where C̅j is the average Carstairs score in grid square j, Cij is the Carstairs score for postcode i in grid square j, and Pj is the total number of postcodes in grid square j.
Statistical methods
We used a Bayesian hierarchical modelA4,A5 in WinBUGSA6 to assess the association between risk of congenital anomalies and the landfill exposure index. At the first level of the hierarchical model, the number of cases Yj in each grid square j = 1,,5437 was modelled as a binomial variable with a separate unknown risk πj

For mapping purposes, because of sparse data, we smoothed the raw risks (number of cases divided by number of births in each grid square) to the global mean by including random effects uj at the second level:

At this same second level, area-level covariates – Carstairs index (categorised in quintiles), proportions of births in women aged under 20 and 35 and above, and local registry (Yes/No) – were included to produce the adjusted odds ratios for the landfill exposure index grouped into four categories: squares with no landfill sites within 2 km (special/non-special or unknown waste types) and three further groups containing approximately equal numbers of grid squares:

where:
X1j to X4j: are the second to fifth Carstairs quintiles; each one takes value 1 if grid square j is in kth quintile (k = 2,3,4,5) and 0 otherwise.
X5j: is the smoothed proportion of births in women aged under 20.
X6j: is the smoothed proportion of births in women aged 35 and above.
X7j: is the register effect (Yes/No); takes a value of 1 if grid square j is not covered by a local register and 0 otherwise.
βk, k = 1,,7: is the regression coefficient of adjustment variable Xk.
ILEI = m is an indicator variable that takes value 1 if the square belongs to group m = 2,3,4 of the landfill exposure index and 0 otherwise.
γm: is the effect of the landfill exposure index for squares in categories m = 2,3,4 relative to those squares with no landfills (special/non-special or unknown waste type) within 2 km.
All the above models were completed by assigning prior distributions to the parameters in the equation. We chose the following non-informative priors:

Since data on births by maternal age were especially sparse, we smoothed the proportion of births by maternal age before including them in the model. Smoothing was done using a Bayesian multinomial model for the number of births in each maternal age group (under 20, 20 to 34, and 35 and above) with unknown proportions for each square. As in our main model, we assumed a normal random effects model for the proportions in each age group, thus allowing information to be borrowed across grid squares. Let Z1j, Z2j and Z3j be the number of births in maternal age group under 20, between 20 and 34, and 35 and above, respectively, for grid square j, where Z1j + Z2j + Z3j = nj, the total number of births in square j. We considered the following model to smooth the proportion of births in each maternal age band:

The posterior mean of the proportions p1j and p3j were then included in the main model as smoothed maternal age proportions X5j and X6j, respectively.
APPENDIX REFERENCES
-
A1. World Health Organization. Methods of assessing risk to health from exposure to hazards released from waste landfills. Report from a WHO meeting, Lodz, Poland, 10–12 April 2000. Bilthoven, The Netherlands: WHO Regional Office For Europe, European Centre for Environment and Health, 2001.
-
A2. Elliott P, Briggs D, Morris S, et al. Risk of adverse birth outcomes in populations living near landfill sites. BMJ 2001;323:363–8.
-
A3. Carstairs V, Morris R. Deprivation: explaining differences in mortality between Scotland and England. BMJ 1989;299:886–9.
-
A4. Gilks WR, Richardson S, Spiegelhalter DJ. Introducing Markov Chain Monte Carlo. In: Gilks WR, Richardson S, Spiegelhalter DJ, eds. Markov Chain Monte Carlo in practice. London: Chapman & Hall, 1996:1–19.
-
A5. Wakefield JC, Best NG, Waller L. Bayesian approaches to disease mapping. In: Elliott P, Wakefield JC, Best N, et al, eds. Spatial epidemiology: methods and applications. New York: Oxford University Press, 2000:104–27.
-
A6. Spiegelhalter D, Thomas A, Best N, et al. WinBUGS Version 1.4 User’s Manual. Cambridge: MRC Biostatistics Unit, Institute of Public Health; Helsinki: Rolf Nevanlinna Institute, University of Helsinki; London: Department of Epidemiology and Public Health, Imperial College London, 2003. See http://www.mrc-bsu.cam.ac.uk/bugs (accessed 26 November 2008).
REFERENCES
Supplementary materials
web only appendix 66/2/81
Files in this Data Supplement:
Footnotes
-
▸ Additional tables are published online only at http://oem.bmj.com/content/vol66/issue2
-
Funding: The Small Area Health Statistics Unit is funded by a grant from the Department of Health, the Department of the Environment, Food, and Rural Affairs, the Environment Agency, the Scottish Executive, the National Assembly for Wales and the Northern Ireland Department of Health, Social Services and Public Safety.
-
Disclaimer: The views expressed in this publication are those of the authors and not necessarily those of the funding departments, data providers or the Office for National Statistics.
-
Competing interests: None.
-
Ethics approval: Ethical approval for the study was obtained through the St Mary’s Hospital NHS Trust Research Ethics Committee approval of the Small Area Health Statistics Unit research programme.
-
↵i An interval that includes the true parameter with probability 0.95, the Bayesian analogue to the frequentist 95% confidence interval.