Article Text

Abstract
Objective: To analyse the effect of external radiation exposure on the mortality of French nuclear workers.
Methods: A cohort of 29 204 workers employed between 1950 and 1994 at the French Atomic Energy Commission (Commissariat à l’Energie Atomique (CEA)) or at the General Company of Nuclear Fuel (COmpagnie GEnérale des MAtières nucléaires (Cogema, now Areva NC)) was followed up for an average of 17.8 years. Standardised mortality ratios (SMRs) were computed with reference to French mortality rates. Dose-effect relationship were analysed through trend tests and Poisson regression, with linear and log-linear models.
Results: The mean exposure to X and gamma radiation was 8.3 mSv (16.9 mSv for exposed worker population). A total of 1842 deaths occurred between 1968 and 1994. A healthy worker effect was observed, the number of deaths in the cohort being 59% of the number expected from national mortality statistics. Among the 21 main cancer sites studied, a statistically significant excess was observed only for skin melanoma, and an excess of borderline statistical significance was observed for multiple myeloma. A dose-effect relationship was observed for leukaemia after exclusion of chronic lymphoid leukaemia (CLL). The relative risk observed for non-CLL leukaemia, n = 20, was 4.1 per 100 mSv (90% CI 1.4 to 12.2), linear model and 2.2 per 100 mSv (90% CI 1.2 to 3.3), log-linear model. Significant dose-effect relationship were also observed for causes of deaths associated with alcohol consumption: mouth and pharynx cancer, cirrhosis and alcoholic psychosis and external causes of death.
Conclusion: The risk of leukaemia increases with increasing exposure to external radiation; this is consistent with published results on other nuclear workers cohorts.
Statistics from Altmetric.com
The effect of protracted exposure to low external doses of ionising radiation on the risk of cancer is still a subject of debate. Results of a 15-country study from the International Agency for Research on Cancer (IARC) have been published recently. A total of 407 391 nuclear industry workers with mean individual cumulative dose of 19.4 mSv were followed up for 12.7 years on average.1 The study suggested that a small excess risk of cancer exists. Two French cohorts were included in this international study: a cohort from “Electricité de France” and a cohort from the French Atomic Energy Commission (Commissariat à l’Energie Atomique (CEA)) and the General Company of Nuclear Fuel (COmpagnie GEnérale des MAtières nucléaires (Cogema)).
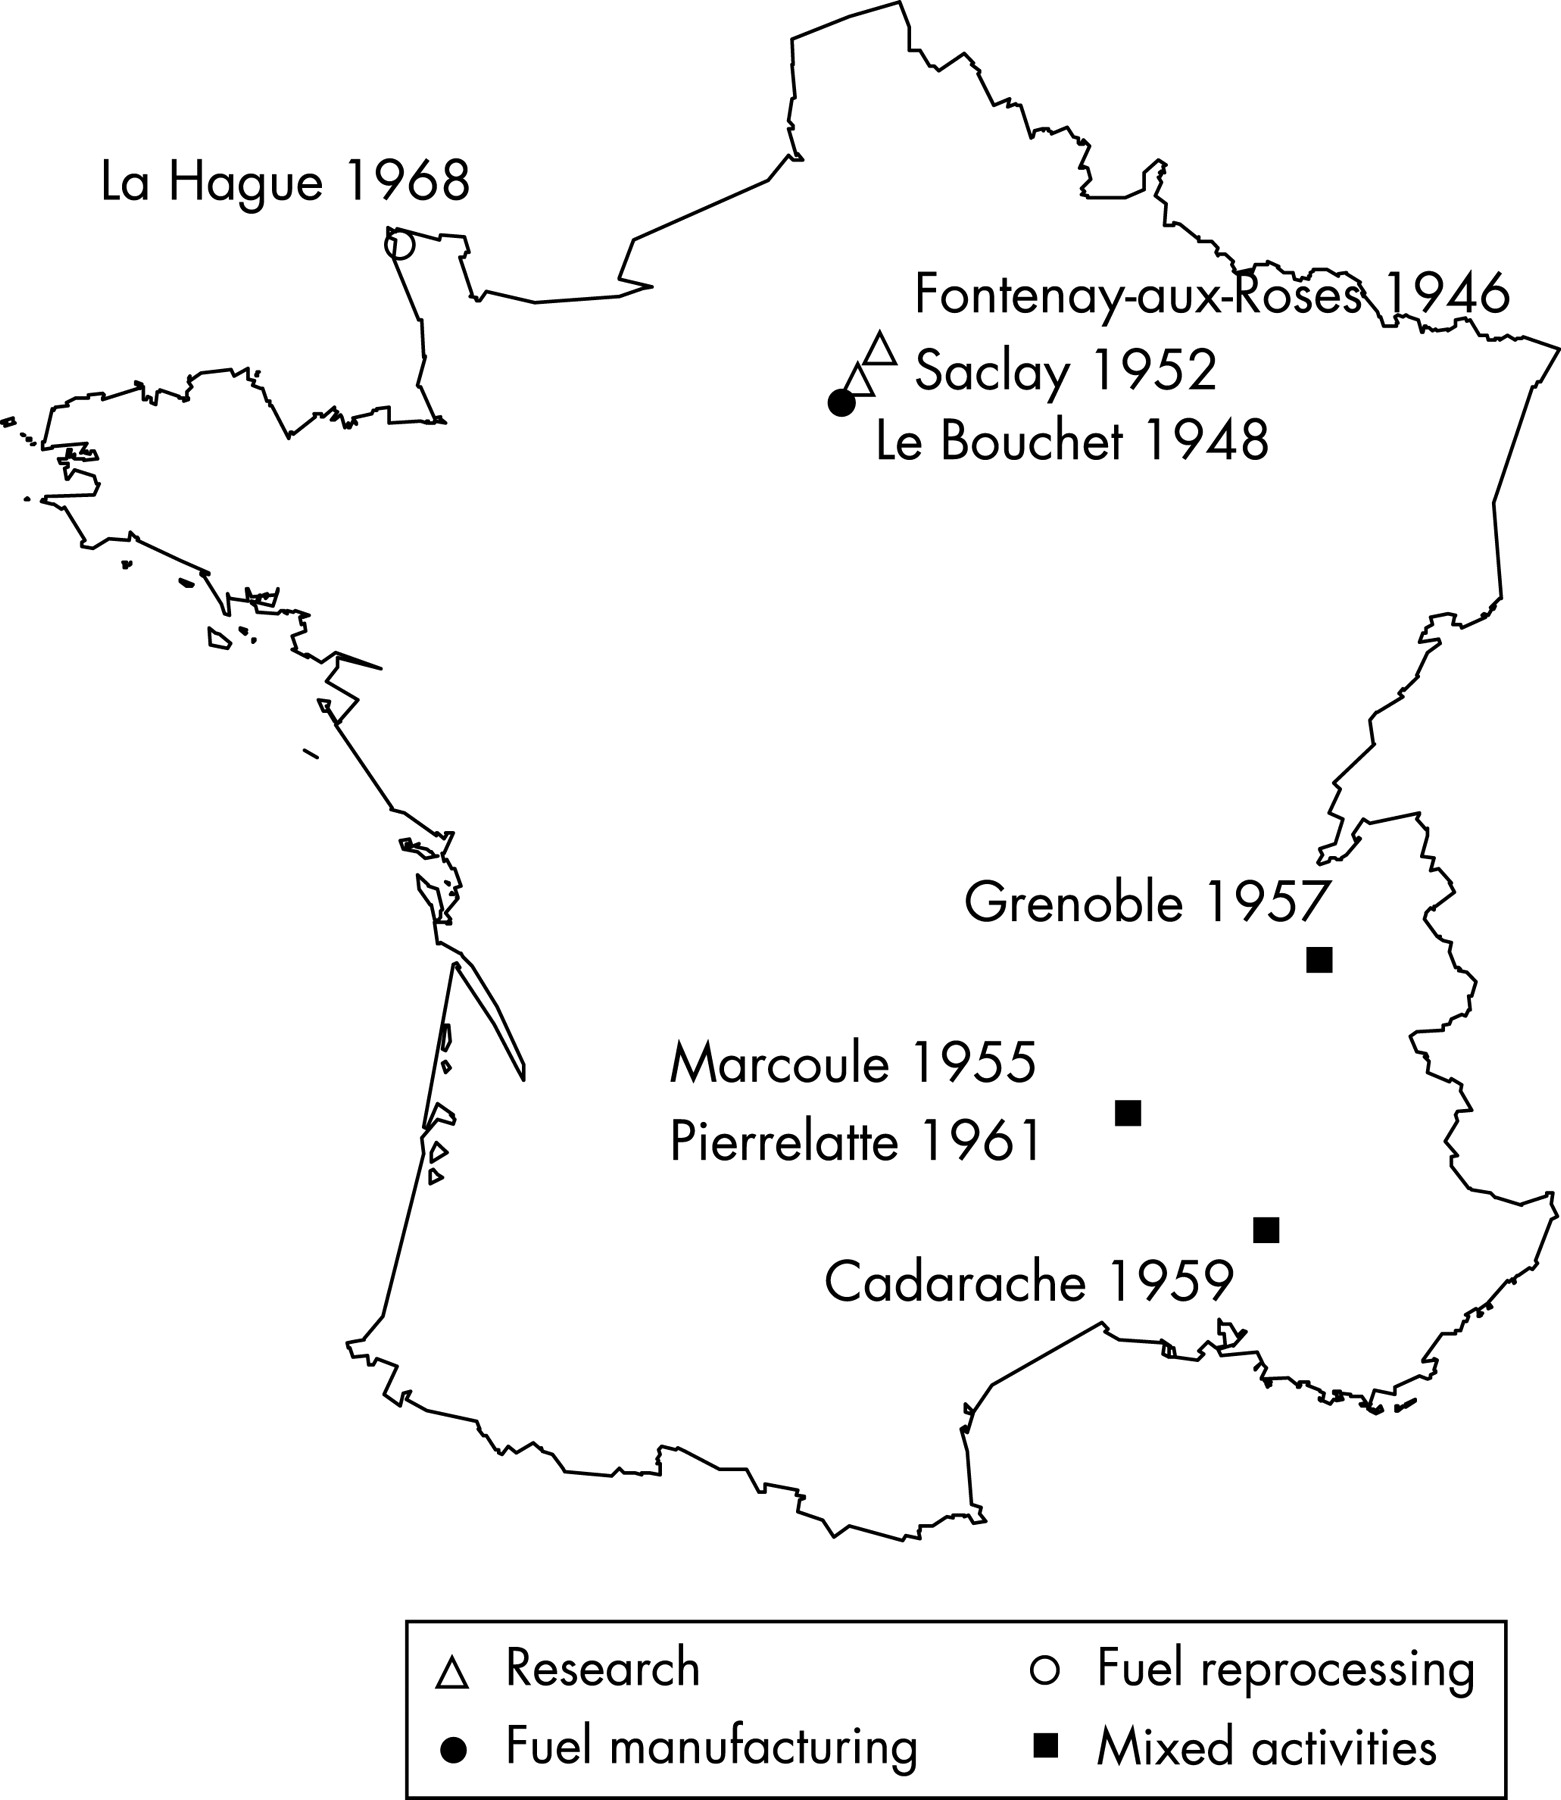
We present in this paper the analysis of the CEA-Cogema cohort, which includes 29 204 workers. It consists of workers who were either entirely monitored in CEA research nuclear sites, excluding military applications, or entirely monitored in Cogema nuclear sites (fig 1). Among the 29 204 workers, 14 796 were included in the IARC 15-country study; the other workers were excluded because of potential exposure to either neutrons or incorporated radionuclides. Workers who worked both in CEA and Cogema sites are not included in this analysis—validation of their exposure history is ongoing and they will be studied in the near future together with workers from the CEA military division.
This paper presents a comparison between the observed mortality of nuclear workers and the expected mortality from national statistics and an analysis of the effect of external photon radiation dose on cause-specific risks of death.
MATERIAL AND METHODS
Cohort definition and data collection
The cohort included workers who (1) worked for more than one year either in CEA or in Cogema, (2) were monitored for external radiation after 1956 according to centralised dosimetry archives and (3) were monitored either entirely in CEA research nuclear sites, excluding military applications, or entirely in Cogema nuclear sites. Cogema uranium miners were not included. Figure 1 shows the main sites studied, the date of the beginning of operation and the main activities.
The following characteristics of each worker: date and place of birth, sex, hiring and end of employment dates were obtained from the CEA and Cogema personnel files. For each worker who left CEA or Cogema, vital status was obtained from his municipality of birth, since deaths in France are reported to the office of vital records of the municipality of birth. After obtaining each worker’s vital status, we queried the national cause of death registry administered by the French national health and medical research institute (Institut National de la Santé et de la Recherche Médicale (INSERM)). The registry includes all deaths and their causes recorded in France since 1968. Linkage with the national death registry was based on the date of birth, sex, and date and place of death. The causes of death were coded according to the International Classification of Diseases of the World Health Organization2 using the 8th revision (ICD-8) for the period 1968–77 and the 9th revision (ICD-9) for the period 1978–94. A total of 30 specific or grouped types of cancer were studied. These data were associated with the annual dosimetry records by linkage on individual identifiers.3
Dose reconstruction
Doses were reconstructed from the central archives of dosimetry files.
For CEA nuclear sites, three periods were identified. Doses were obtained by adding fortnightly doses in the period 1957–9 and monthly doses in the period 1960–6. During these two periods, workers wore Kodak type 1 two filter film badges. Only workers with at least one positive dose were registered in the dosimetry file. In the period 1967–94, annual doses were available separately for X and gamma doses on the one hand, and beta and neutrons doses on the other. Workers wore Kodak PS1 six filter film badges. All workers were registered in the dosimetry file. The lowest recorded doses were 0.25 mSv between 1957 and 1959 and 0.35 mSv afterwards. For individuals monitored after 1957 and hired before, a case-by-case research in the paper files was done to reconstruct their annual doses before 1957.
The dosimetry data were validated: for the data between 1957 and 1966, the computer file and the paper file were compared for a 1% sample of the data. For the yearly data between 1968 and 1994, a 1% random sample of the data file and all doses above 3 mSv were compared to the exposures recorded in the individual medical archives. Differences above 0.01 mSv were observed for less than 4% of the yearly doses in the 1% random sample. For yearly doses above 3 mSv, the validation led to some corrections in the dosimetry file when the dose in the medical file had been modified as the result of a specific enquiry.
For Cogema nuclear sites, monthly records were available in Pierrelatte and La Hague. In Marcoule, fortnightly records were available for the period 1957–9, monthly records for 1960–73 and 1984–94, and annual records for 1956 and 1974–83. The lowest recorded doses were 0.25 mSv in Marcoule and Pierrelatte and 0.15 mSv in La Hague. Kodak type 1 two filter dosimeters were used in Marcoule and Pierrelatte until 1964 and similar badges in La Hague until 1968. Five filter dosimeters were then used (DM6 were replaced by Cogebadge in 1988 in Marcoule and Pierrelatte and in 1987 in La Hague).
Statistical analysis
Analyses were restricted to the period 1968–94 because data from the national registry of causes of death are not available for earlier years. Follow-up began at the most recent of the following dates: (1) 1 January 1968, (2) date of recruitment plus one year and (3) date of first monitoring. The end of follow-up is defined as the date of death for those who died, the study end-point (31 December 1994) for those alive at the end-point, and the date of last contact for those whose vital status could not be ascertained at the end-point (subjects lost to follow-up).
The mortality observed in the cohort was compared to that expected from national mortality statistics, by computing standardised mortality ratios (SMRs). The national population was chosen as the reference because workplaces were spread over the entire national territory. For each sex and five-year age group, the expected mortality was calculated by multiplying the national mortality rates for each calendar year by the number of workers at risk during that year. 90% confidence intervals were computed under the assumption that the observed number of deaths followed a Poisson distribution with a mean equal to the number of expected deaths.4
In all dose-effect relationship analyses, X and gamma doses in mSv were classified in 11 groups ((0–5), (5–10), (10–20), (20–50), (50–100), (100–150), (150–200), (200–300), (300–400), (400–500), (500+)) and treated as a time dependent variable. Trend tests were computed as suggested by Breslow and Day for grouped exposure data in a cohort analysis.4 Poisson regressions were used with both log-linear and linear models. The assumption was thus made that the number of deaths djk, from the stratum j and the kth dose category followed a Poisson distribution with expectation njkλjexp(βxjk) for the log-linear model and njkλj(1+βxjk) for the linear model, where njk is the number of person-years in stratum j and kth dose category, λj the death rate in the stratum j without exposure, β the unknown coefficient of the effect of the dose on the risk and xjk the average dose in stratum j and kth dose category.4 To allow for delayed effects of ionising radiation, the exposures were lagged by two years for leukaemia and by 10 years for other causes of death. The analyses were stratified by sex, age in 15 five-year groups (15–19, 20–24, …, 80–84, 85+), calendar year in six groups (1968–9), and five-year periods, company (CEA vs Cogema), socioeconomic status in four groups (professional and intermediate, skilled non-manual, skilled manual and unskilled, uncertain) and duration of employment in years ((0–5), (5–10), (10+)).
Person-years at risks were calculated with Epicure5 and the Amfit program was used to fit the regression models. SMRs and trend tests were calculated with SAS software.
RESULTS
Cohort description
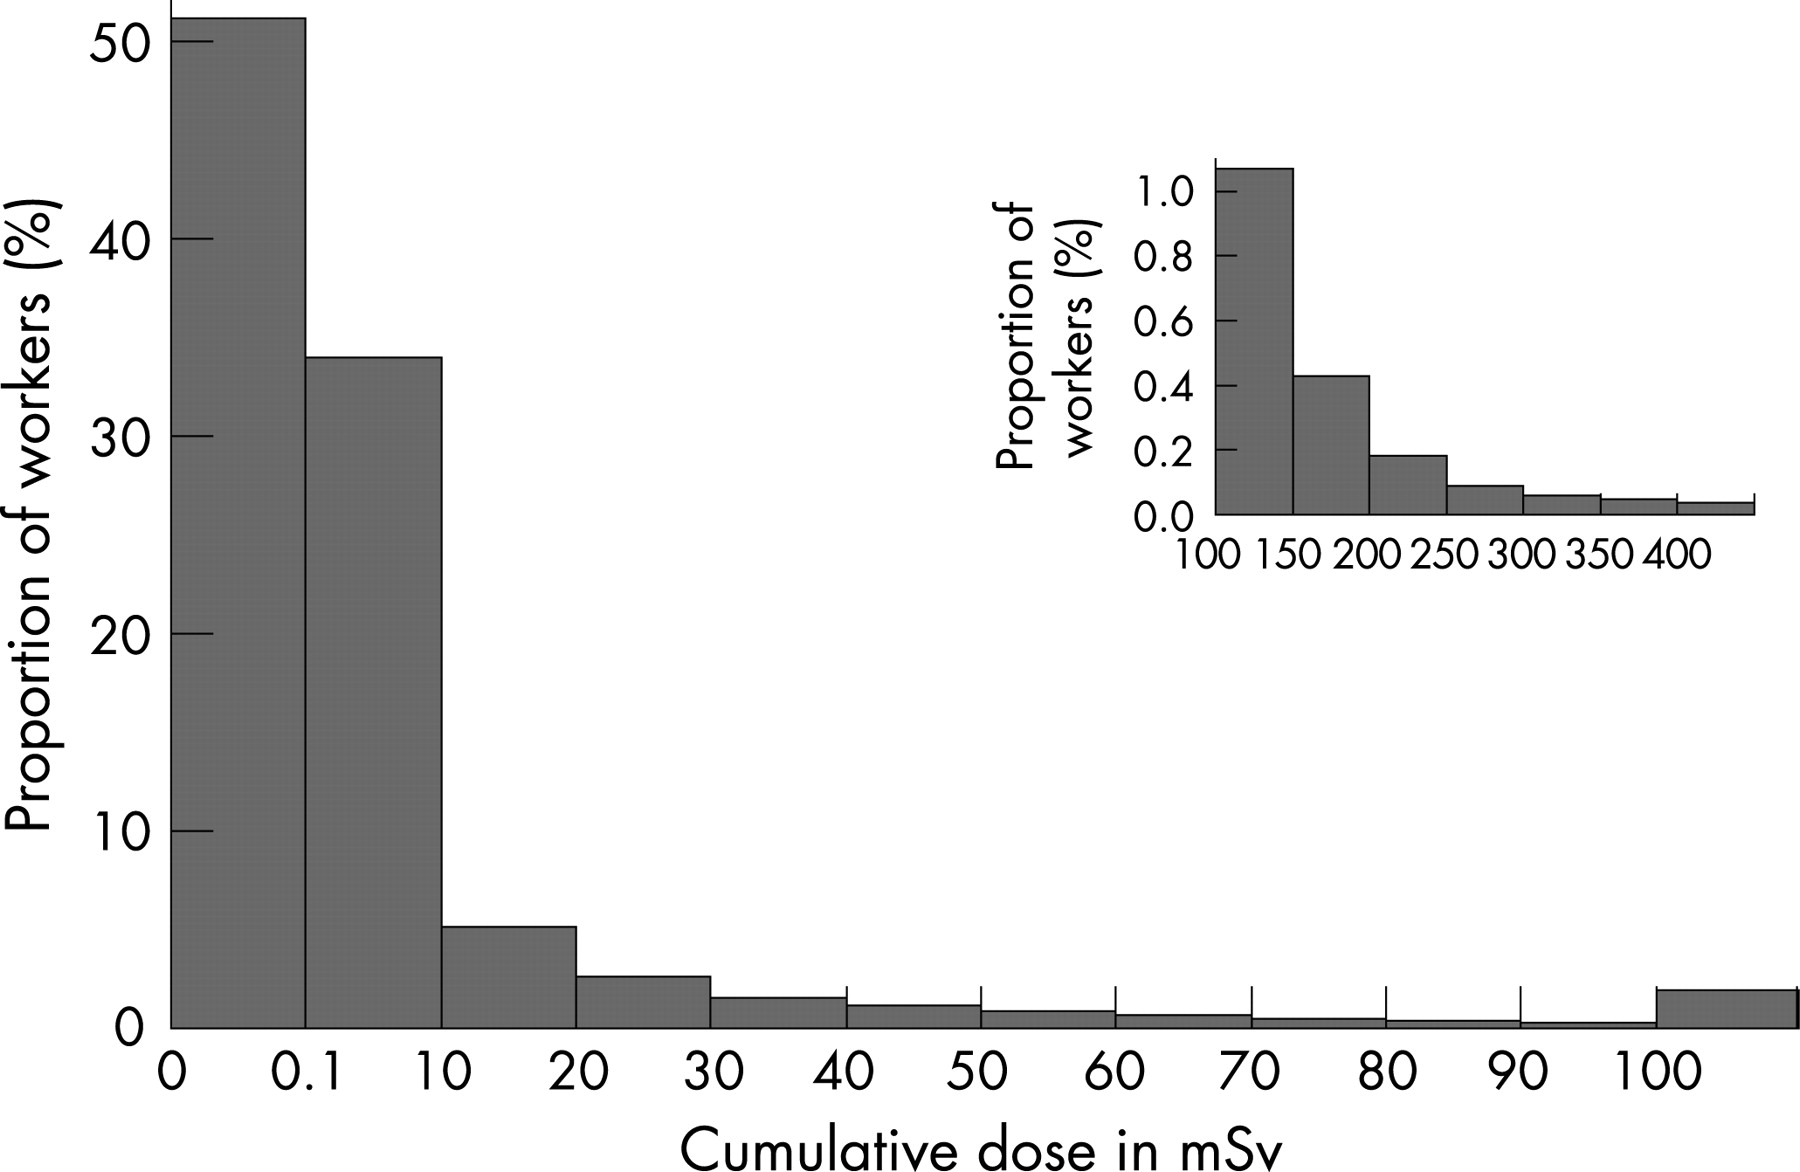
The characteristics of the cohort are described in table 1. Among the 29 204 workers, 78.7% were men; the mean age at cohort entry was 32 years, the duration of dosimetric monitoring was 15 years and the duration of follow-up 18 years. The mean age at the end of 1994 was 50 years. On 31 December 1994, 92.5% workers were still alive, 6.3% were dead and 1.1% lost to follow-up. 95.7% of the causes of death were identified. The study included 518 718 person-years of follow-up. The mean cumulative dose for all workers was 8.3 mSv. Figure 2 shows the distribution of individual cumulative dose: half of the population received no exposure (zero dose), 34% a positive dose under 10 mSv, 13% a dose of 10–100 mSv and 2% a dose greater than 100 mSv.

Mortality compared with national rates
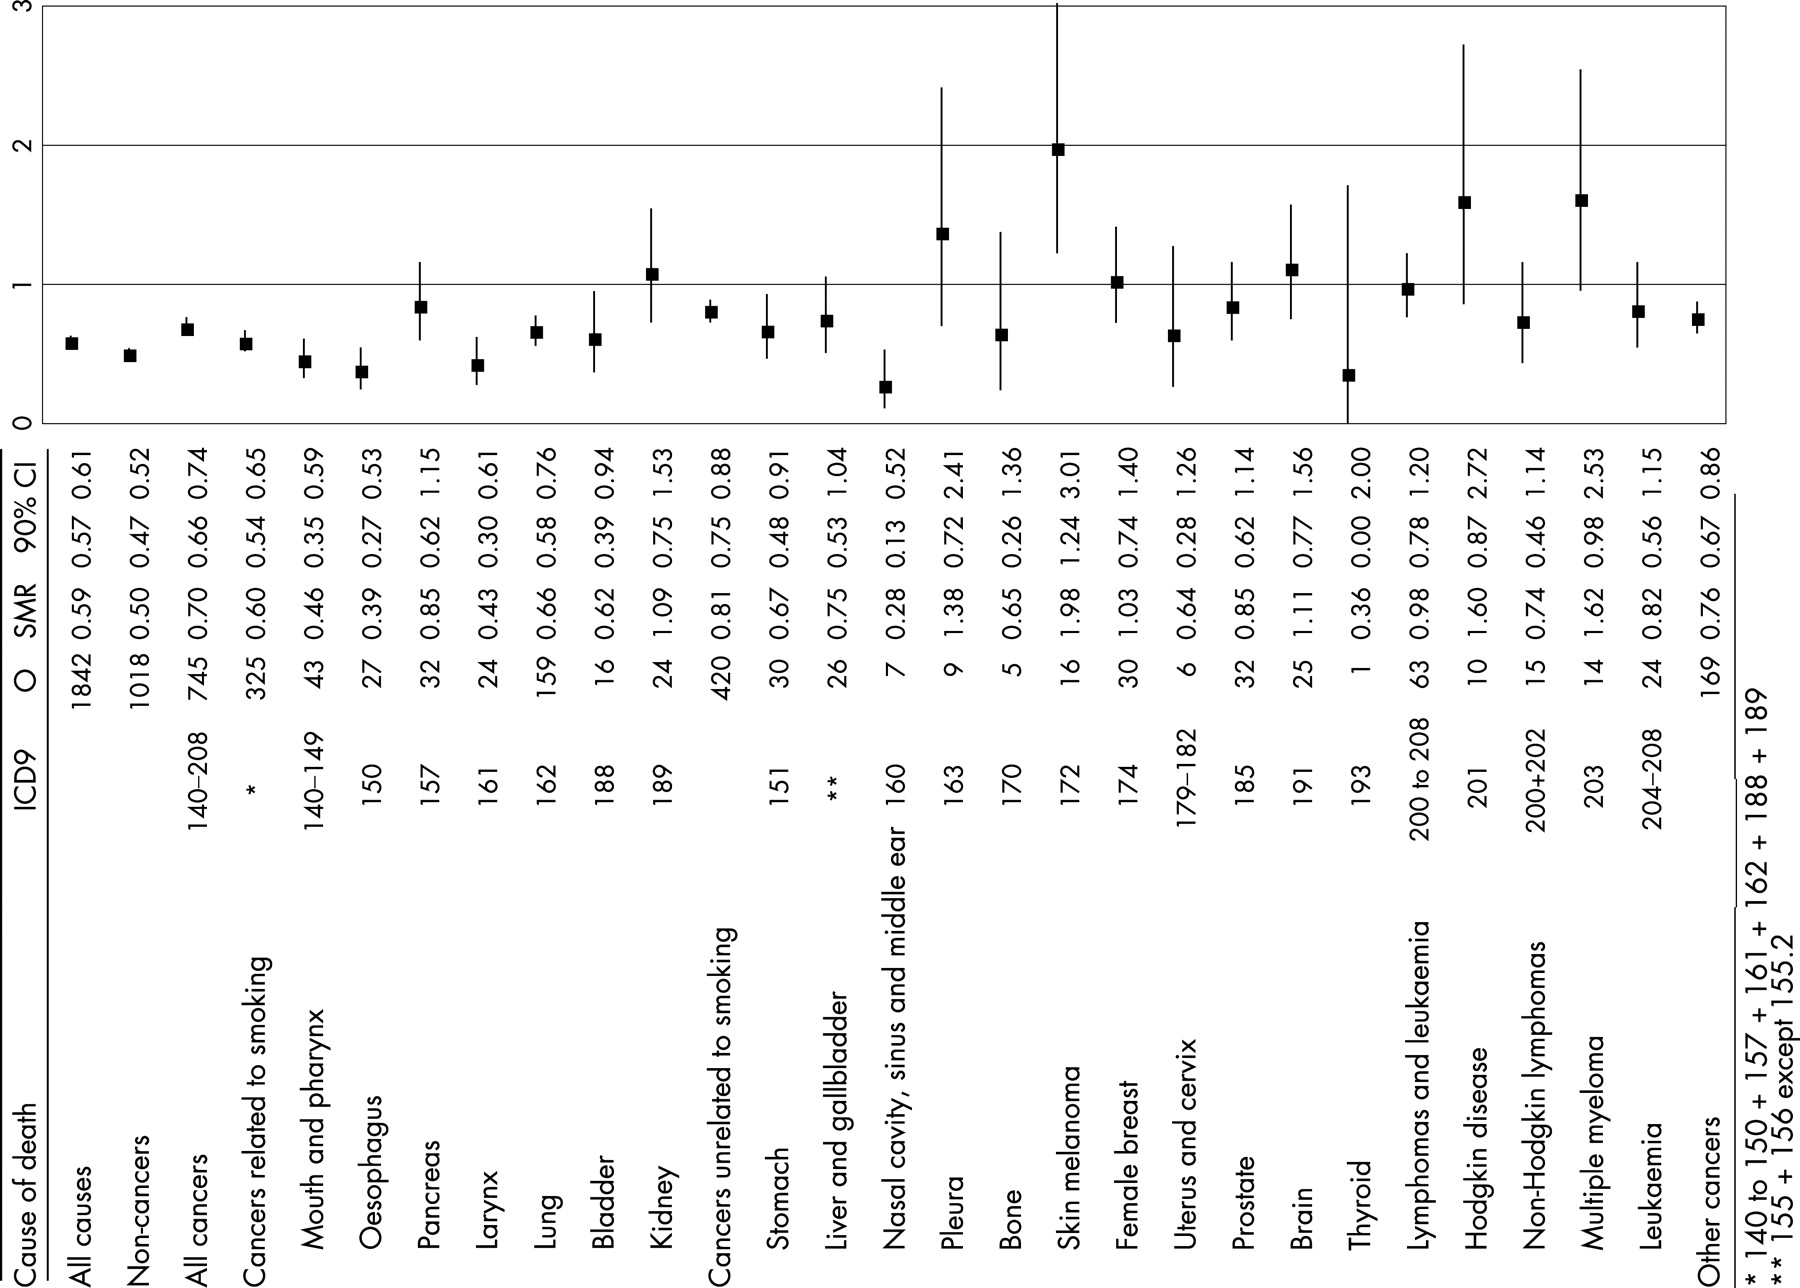
A healthy worker effect was observed: the total number of deaths observed in the cohort was 59% of the number expected from national mortality statistics (SMR 0.59, 90% CI 0.57 to 0.61) (fig 3). This low mortality compared to national rates was observed for non-cancer causes of deaths (SMR 0.50, 90% CI 0.47 to 0.52) and to a lesser extent for all cancers combined (SMR 0.70, 90% CI 0.66 to 0.74). The SMR for cancers known to be related to smoking was 0.60 (90% CI 0.54 to 0.65).6 In particular, SMRs were 0.46 for mouth and pharynx cancers (90% CI 0.35 to 0.59), 0.39 for oesophageal cancers (90% CI 0.27 to 0.53) and 0.43 for larynx cancers (90% CI 0.30 to 0.61), cancers associated both to tobacco and alcohol consumptions.6 7 For cancers known to be unrelated to smoking the SMR was 0.81 (90% CI 0.75 to 0.88). A statistically significant excess of skin melanoma was observed (SMR 1.98, 90% CI 1.24 to 3.01, n = 16). A nearly significant excess of multiple myeloma (SMR 1.62, 90% CI 0.98 to 2.53, n = 14) was observed. Though non-statistically significant, SMRs were above one for pleural cancer and Hodgkin disease (SMR 1.38, 90% CI 0.72 to 2.41 and 1.60, 90% CI 0.87 to 2.72, respectively). Neither an excess nor a deficit was observed for leukaemia compared to the general population.
Dose-effect relationship analyses
Table 2 presents relative risks obtained for a dose of 100 mSv with the linear model and the log-linear model. It includes only causes of death with both an expected number greater than 5 in the SMR analysis and for which the model could fit the data, in the linear model.
A dose-effect relationship of borderline significance was observed for all cancers (1.20, 90% CI 0.99 to 1.45, linear model). A significant dose-effect relationship was observed for cancers known to be related to smoking, the relative risk at 100 mSv being 1.48 (90% CI 1.13 to 1.95). Based on the linear model, significant dose-effect relationship were observed for mouth and pharynx and for larynx. The risk of leukaemia death (except CLL) increased with doses of external radiation. The relative risks for leukaemia (except CLL) at 100 mSv were 4.12 (90% CI 1.39 to 12.2) with the linear model and 2.19 (90% CI 1.15 to 3.34) with the log-linear model (table 2). The 90% CI is much wider with the linear model than with the log-linear model. No dose-effect relationship were observed for the other sites of cancer. Significant dose-effect relationship were observed for cirrhosis and other alcohol-related causes and for external causes.
Table 3 presents the observed and expected number of deaths under the hypothesis of constant risk across dose categories, and the p value of the trend test for 33 causes of death or groups of causes of death. Significantly increasing risks with increasing dose were observed for overall mortality (p = 0.02) and for cancer mortality (p = 0.05). The increase in risk with dose was observed for cancers related to smoking (p = 0.005) and more precisely for mouth and larynx cancer (p = 0.001) and nasal cancer (p = 0.03), and for leukaemia (p = 0.01 for all leukaemia and p = 0.002 for leukaemia except CLL). Risks of death from cirrhosis and from external causes (accidents and suicides) increased also with the dose (p = 0.004 and p = 0.02 respectively).
DISCUSSION
This study of French CEA and Cogema nuclear workers provides the first estimates of the effects of ionising radiation for these companies. The total number of deaths observed in the cohort was 59% of the number expected from national mortality statistics. This ratio of observed to expected was 50% for non-cancer deaths and 70% for cancer deaths. The study of the different cancers sites shows that the mortality of CEA-Cogema workers is less than half of the mortality expected from national mortality statistics for cancers of the mouth and pharynx, oesophagus and larynx. These cancers are known to be associated both with alcohol and tobacco consumption. This suggests very low tobacco and alcohol consumption among CEA-Cogema workers as compared to the French population, although we have no data to verify this fact. Among the 21 main cancer sites studied, a statistically significant excess (as compared to national mortality statistics) was observed only for skin melanoma.
Significant dose-effect relationship were observed for leukaemia and for leukaemia except CLL. Significant dose-effect relations were also observed for causes of deaths associated with alcohol consumption: mouth and pharynx cancer, cirrhosis and alcoholic psychosis and external causes of death.
These two results: an overall mortality reduced as compared to national mortality statistics and a risk of death from leukaemia increasing with dose, are not incompatible. Such a healthy worker effect associated with a dose response is commonly observed in studies of occupational exposures to carcinogens.8
Strengths and weaknesses of the study
CEA and Cogema have very stable workforces and only 1.1% of workers were lost to follow-up at the end of the study after 18 years follow-up on average. The quality of identifiers for deceased workers allowed ascertainment of 95.7% causes of deaths. Systematic monthly monitoring with an individual chest-dosimeter was introduced in the French nuclear industry in the early 1950s allowing a yearly individual exposure assessment.
Individuals who have been monitored both at a civilian CEA site and at a Cogema site are not included in the present study because their radiation exposure has not yet been reconstructed. Workers from the military division of CEA are not included either but their exposure may be more difficult to reconstruct.
Doses mentioned in the archives as below the detection threshold were considered as null doses in the analyses, however their actual value could have been an unknown dose between 0 and the detection threshold. The aggregation of doses below the threshold over several fortnights or months may result in a non-negligible dose.9 When null doses were replaced by half the threshold or by the threshold value, the relative risk estimates were not substantially modified.10 Exposure characteristics, such as the type of radiation, its energy and the geometry of exposure, may have also resulted in uncertainties in the recorded doses. Those uncertainties were quantified by the IARC for a sample of dosimeters including types used at CEA and Cogema.11 12
The analyses of dose-effect relations controlled for the effects of sex, age, calendar period, socioeconomic status, duration of employment and company according to the protocol of the 15-country study.13 Dose-effect relationship were observed for causes of deaths associated both with tobacco and alcohol consumption. There may be an association between radiation exposure and tobacco or alcohol consumption. However, as stated above, data on tobacco or alcohol consumption are not available. Controlling for socioeconomic status may not have been sufficient to eliminate these confounding effects. Case-control studies will have to be set up to address this issue. Such studies have already begun within the framework of a European collaboration for lung cancer and leukaemia.
We have included in our study workers with potential exposure to internal radiation or to neutron adding 14 408 workers to the CEA and Cogema workers included in the 15-country study. This potential exposure was established on the basis of the work unit for internal contamination and on the basis of dosimetry measurement for neutron.
Comparison with literature
The average individual cumulative dose among CEA-Cogema workers was 8.3 mSv. This is low compared to the average dose of 19.4 mSv in the 15-country study, but similar to the 10 mSv average dose observed for instance at INL, a cohort included in the 15-country study.13 More than half of the CEA and Cogema workers have a cumulative dose equal to 0 compared with 7% of Electricité de France workers;14 this reflects in part the practice of assigning dosimeters to a category of workers very unlikely to be exposed (for example, administrative staff). The average dose for CEA-Cogema workers included in the 15-country study was 3.8 mSv because workers potentially exposed to internal contamination or neutron were excluded from this study; these workers were older, had a longer follow-up and higher exposures.
The SMR of 0.59 observed for the all-cause mortality in this cohort was equal to the SMR observed in the study of workers in the National Dose Registry of Canada,15 higher than the 0.48 observed in the Electricité de France cohort and lower than the 0.65 observed in the Belgian nuclear worker cohort.16
Leukaemia
We observed a significant increase in the risk of leukaemia death with increasing dose of external radiation and the relative risk at 100 mSv with the linear model was 4.1 (90% CI 1.4 to 12.2). This observed relative risk is higher than the 1.2 or 1.3 observed relative risks in the 15-country study, the three-country study and the UK NRRW study but the observed confidence interval is overlapping with confidence intervals from these studies: 90% CI 1 to 1.6 for the three-country study,17 90% CI <1 to 1.7 for the 15-country study1 and 90% CI 1.00 to 1.7 for the NRRW study.18 The CEA Cogema relative risk is lower than the 6.3 Canadian nuclear worker study relative risk but the CEA Cogema relative risk confidence interval is included in the Canadian study confidence interval (90% CI 1 to 30).19
Our study does not include workers monitored only between 1957 and 1966 and with null doses over that period. Restricting the study to the workers with a positive dose and monitored only between 1957 and 1966 leads to a relative risk of 3.06 at 100 mSv (90% CI 0.04 to 9.47) not different from the 4.12 observed for the whole population.
To obtain a relative risk at 100 mSv equal to the risk observed in the IARC 15-country study (1.2), doses would have to have been underestimated by a factor of 10.20
We compared the workers who had died from leukaemia to the other workers from the same birth cohort and found that they had been hired at CEA-Cogema at an older age. A study of their previous occupational history showed no exposure to radiation.
The study includes only workers alive on 1 January 1968, but monitoring started in 1957. Deaths from leukaemia between 1957 and 1967 were not taken into account. If one restricts the study to workers monitored since 1966, with a lag time of two years for the risk of leukaemia, all leukaemia deaths are accounted for; the RR at 100 mSv linear model is 3.15 (90% CI <1 to 18.04) instead of 4.12. If one restricts the study to workers monitored since 1963, with a lag time of five years for the risk of leukaemia, the RR at 100 mSv is 6.09 (90% CI <1 to 23.85).
Malignant melanoma
We observed an excess risk of melanoma (SMR 1.98, 90% CI 1.24 to 3.01, n = 16) and no significant dose-effect relation. An excess of malignant melanoma has already been reported among all CEA workers including workers unexposed to ionising radiation.21 Skin malignant melanoma has also been found in excess among Lawrence Livermore National Laboratory workers,22 but this excess is restricted to the period before 1986.23 A nearly significant dose-effect relationship has been found among Atomic Energy Authority workers.24 The main known risk factors for malignant melanoma are ultraviolet rays, genetic factors and high socioeconomic status,25 the latter probably related to sun exposure during leisure activities. The association with ionising radiation remains unclear.26
Multiple myeloma
We observed a non-significant excess of multiple myeloma (SMR 1.62, 90% CI 0.98 to 2.53, n = 14) and no dose-effect relation. The only nuclear worker study where a non-significant excess risk of multiple myeloma has been observed, based on five cases, is Mallinckrodt (SMR 1.30).27 Several studies have reported significant17 or borderline significant31 dose-effect relationship. Further studies are needed to examine with sufficient power the relation between this disease and external doses or other types of exposure.
CONCLUSION
This study shows that it is possible to follow in France a cohort of workers who have been exposed to nuclear radiation from the 1950s. The regulatory dosimetry registries allowed the reconstruction of their yearly exposures. Company files provided identifiers sufficient to link the job history information, the dosimetry data and to obtain vital status and cause of death.
We have presented an overall analysis of the cohort of 29 204 CEA and Cogema workers adding 14 408 workers to the CEA and Cogema workers included in the 15-country study. The additional workers potentially exposed to internal contamination or neutron were hired earlier, were older and had higher exposures. The excess relative risk observed for leukaemia is higher but consistent with the result of the 15-country study.
Main messages
Long-term follow-up of a cohort of CEA and Cogema workers exposed to nuclear radiation has been possible. As reported in other studies of nuclear workers, an important healthy worker effect was observed: the risk of death of CEA and Cogema workers was 59% of the risk expected from national mortality statistics.
For leukaemia death, a dose-effect relation was observed. The relative risk at 100 mSv was 4.1 with a wide confidence interval (1.4 to 12.2). This estimate is consistent with published results on nuclear workers.
Policy implication
The long-term consequences of chronic occupational exposure to low doses of ionising radiation have to be assessed with longer follow-up.
Acknowledgments
We thank Elisabeth Cardis, Hélène Tardy and Martine Vrijheid for their help with the analysis, Agnès Rogel for critical review of the manuscript, Anne de Henning for her help in the English version and the members of the working groups constituted for the study: Dr Auriol, Dr Bataller, Dr Beau, Dr Couleru, Mr Dagorn, Dr Delacroix, Dr Desse, Mrs Duchaud, Mrs Dumeau, Dr Espagnan, Dr Estrabaud, Mrs Frossard, Mr Girod, Mr Joudrier, Dr le Goff, Mr le Tule, Mr Magri, Mr Manenc, Mr Marcellin, Dr Pic, Dr Planchet, Dr Raynaud, Dr Riasse, Mr Richard, Dr Royer, Dr Soudain, Dr Straus, Dr Thierry-Chef, Dr Tourte, Mr Truffert, Mr Videgrain.
REFERENCES
Footnotes
Competing interests: Dr Bermann has been employed by the Commissariat à l’Energie Atomique. Dr Gélas has been employed by Cogema (now Areva NC). Dr Giraud and Mrs Néron are employed by the Commissariat à l’Energie Atomique. Dr Quesne is employed by Areva NC (which includes ex Cogema).
- Abbreviations:
- CEA
- Commissariat à l’Energie Atomique
- CLL
- chronic lymphoid leukaemia
- Cogema
- COmpagnie GEnérale des MAtières nucléaires
- IARC
- International Agency for Research on Cancer
- INL
- Idaho National Laboratory
- SMR
- standardised mortality ratio