Article Text

Abstract
Background and Aims: Few studies have described relations between exposure to laboratory animals and the incidence of laboratory animal allergy (LAA). Studies that have found exposure-response relations have been cross sectional in design or have focused on exposure to rats and mice. This study used longitudinal data collected over a 12 year period to describe the relations between indices of exposure to laboratory animals and the development of LAA and LAA symptoms.
Methods: Data were obtained from questionnaires and serological laboratory results from a dynamic cohort of workers exposed to a variety of laboratory animals in a pharmaceutical manufacturing company. Poisson regression was used to model the incidence rate ratios of species specific and general LAA and LAA symptoms at different levels of exposure.
Results: The 12 year incidence rates of LAA symptoms and LAA for all workers were 2.26 (95% CI 1.61 to 2.91) and 1.32 (95% CI 0.76 to 1.87) per 100 person-years, respectively. Higher rate ratios were seen with increasing reported hours of exposure to tasks that required working with animal cages or with many animals at one time. The most common symptoms were related to rhinitis rather than to asthma.
Conclusions: This study suggests that the risk of LAA increases with duration of exposure to animals and work in animal related tasks. Incidence might be reduced by limiting hours per week of exposure to laboratory animals.
- GSK, GlaxoSmithKline
- LAA, laboratory animal allergy
- RAST, radioallergosorbent test
- RUA, rat urinary allergy
- allergy
- laboratory animal workers
- occupational
- incidence
Statistics from Altmetric.com
- GSK, GlaxoSmithKline
- LAA, laboratory animal allergy
- RAST, radioallergosorbent test
- RUA, rat urinary allergy
Allergy is a common occupational hazard for workers exposed to laboratory animals. Although prevalence estimates vary depending on the definition of laboratory animal allergy (LAA), large studies have estimated that 10% to 23% of exposed workers report symptoms of allergy to laboratory animals.1–3 These estimates do not include workers who may have left the workplace after developing symptoms.
As the magnitude of the problem has become more apparent, interest has turned to describing the exposure-response relations between animal allergens and the development of allergy. One study examining these relations found that certain endpoints, such as chest and skin symptoms, are associated with increasing intensity of exposure to rat urinary allergy (RUA).4,5 Another study found a relation between increasing cumulative exposure and sensitisation to RUA.6
Studies that have not directly addressed exposure-response relations have reported LAA prevalence by job title.2,4,7,8,9,10 The findings of these studies have been inconsistent, with higher LAA prevalence in workers with intensive exposures (for example, cage cleaners, animal handlers)4,7,8 as well as with presumably low level, prolonged exposures (for example, scientists, experimental assistants).2,9
Most studies have focused on exposure to RUA or to rodents in general as these laboratory animals are used in abundance and have allergenic proteins that are easily identified and measured.4–6,11 However, a potentially important aspect of exposure-response relations is the nature of the allergens to which workers are exposed. It has been suggested that workers may develop allergies more easily to some animals than to others12 and that the potential for sensitisation is related to the nature of the animal allergen.6
This study describes the relations between exposures to a variety of laboratory animals and the development of LAA and LAA symptoms in a dynamic cohort of workers over a 12 year period. We examined relations between different indices of exposure and the incidence of LAA, using annual self-reported exposure information about job titles, hours worked with specific animals, and hours spent at different tasks.
METHODS
The data for this study were obtained from medical records of workers with potential exposure to laboratory animals at any time during the period 1 January 1991 through 30 April 2003 at GlaxoSmithKline (GSK), a pharmaceutical company in Research Triangle Park, North Carolina. All workers with potential exposure were enrolled in an LAA surveillance programme, which included annual medical examinations, baseline and periodic serological tests for antibodies to specific animals, and completion of a questionnaire obtaining self-reported exposures and symptoms related to laboratory animals. The programme and questionnaire have been described in more detail in a previous study,12 and the questionnaire has been made available elsewhere.13 The surveillance programme was one component of an overall laboratory allergy prevention programme, which also included training, education, and implementation of engineering controls.
Exposure indices
Estimates of exposure to laboratory animals in general were derived from the following questions: “How many days per week do you work with lab animals or their cages?” and “During these days, how many hours per day (on average) do you work with lab animals or their cages?” Workers were asked to give estimates for the past six months if they did not work with animals on a weekly basis. Exposure to laboratory animals in general was reported as a continuous variable, in hours per week.
Exposures to specific laboratory animals were derived from the question “How many hours per week do you usually have contact with the following species?” Workers were asked about six species in particular, with the option of reporting additional species. Exposures to specific laboratory animals were reported as ordinal variables, as they appeared on the questionnaire (0 hours per week, 1–6 hours per week, 7–20 hours per week, >20 hours per week). To assess the influence of working with several species at different frequency levels, an intensity score was calculated by summing the midpoints of exposure categories across species.
Exposures to specific tasks were reported from a question about hours per week involved in 13 specific work tasks, with ordinal responses as previously described for exposure to specific animals. Tasks have been used in other studies as a surrogate for intensity of exposure.2,4,9 Job titles were evaluated and categorised into major groups based on job descriptions and similarities of tasks. When a job title was not recognisable, senior staff of the GSK animal facility checked the employee record to identify the employee’s job.
Health outcomes
Health outcomes for initial analyses included allergy to laboratory animals in general and allergies to individual animal species. General LAA (that is, not species specific) was defined as having one or more self-reported work related symptoms (runny or stuffy nose, watery or itchy eyes, sneezing, coughing, wheezing or chest tightness, shortness of breath, skin rashes) from exposure to laboratory animals, with serological evidence of sensitisation to at least one laboratory animal. Sensitisation was defined as any positive radioallergosorbent test (RAST) to a panel of laboratory animal allergens (rat urine, rat epithelium, mouse urine, mouse epithelium, guinea pig urine, rabbit urine, cat dander, dog dander). Species specific LAA was defined as having one or more self-reported symptoms from exposure to a specific species, with serological evidence of sensitisation to that species. In assessment of species specific allergy, analyses included only those species named on the questionnaire and tested by RAST (rat, mouse, rabbit, guinea pig, and dog).
Additional analyses focused on the incidence of symptoms alone, without consideration of serological data. Outcomes included self-reported symptoms from exposure to laboratory animals in general and to specific species.
Serological studies
Blood samples collected from workers at baseline and subsequent examinations were sent to the same laboratory over the 12 year period to be tested for antibodies to allergens present in rat skin, rat urine, mouse skin, mouse urine, guinea pig urine, cat dander, dog dander, and rabbit urine. The test methods have been described elsewhere.14,15 The materials and procedures were the same throughout the period of testing. Different batches of the same antibody were radiolabelled approximately every 3–4 months. New activated disks were prepared every 2–3 years and disks were coupled to allergen every 1–2 years. The commercial allergens (epithelia) had three year dating and were obtained from Greer Laboratories (Lenoir, NC, USA). The animal urines used in analysis were collected by veterinarians at the testing laboratory and stored at −20°C.
The methods have been tested against the Pharmacia CAP system, showing good correlation. In this study, a test was considered positive with 0.8–1.9% specific binding, corresponding to a Pharmacia CAP Class 2.
Data analysis
All workers who did not report symptoms to laboratory animals at their initial examination and completed at least one subsequent questionnaire were included in the analyses of LAA symptoms incidence. Of these, only workers with serological data were included in analyses of LAA incidence.
Estimation of person-time
Person-time for fixed factors was calculated from the dates of the first and last available questionnaires. Person-time for changing factors, such as exposure to specific animals or tasks, was calculated by summing person-years for each exposure over periods based on dates of questionnaires. When annual questionnaires were missing, simple imputations were made based on exposure distributions from non-missing questionnaires. For example, if rat exposure was reported in 61.2% of the non-missing person-time, the imputed rat exposure for the missing person-time was (61.2% × number of missing person-years). Total person-time was calculated by summing the non-missing and imputed estimates. To reflect the uncertainty in these estimates, a range of imputations was estimated with the assumption that exposure during the missing person-years may have been as much as 50% greater or 50% less than in the years with non-missing data.
Statistical methods
Incidence rates were calculated for the total population and for different worker groups. Species specific rates were estimated using person-years of exposure to each species, and also using a standard denominator representing person-years of exposure to laboratory animals in general. Poisson regression was used to model the incidence rate ratios of species specific and general LAA (and LAA symptoms) at different levels of exposure.16 Exposures were evaluated in univariate models and in multivariable models including other factors that have been of interest in studies of LAA. These included smoking, pet ownership, physician diagnosed allergy, and family history of allergy or asthma, all self-reported on the questionnaires. Physician diagnosed allergy was used as a surrogate for atopy, and analyses were stratified by atopic status. Age and sex were also evaluated.
Precision was reported as 95% confidence intervals. When analysis results were similar for LAA and LAA symptoms, only the latter was reported due to greater precision. Statistical analyses were conducted using PC SAS software version 8.2 (SAS Institute, Cary, NC, USA) and Stata v.8 (College Station, TX, USA).
RESULTS
Figure 1 illustrates the number of employees enrolled in surveillance and included in analyses. Workers who did not complete at least two questionnaires either left employment before a follow up examination or began employment in the last years of the study and had not yet reported for a follow up examination.
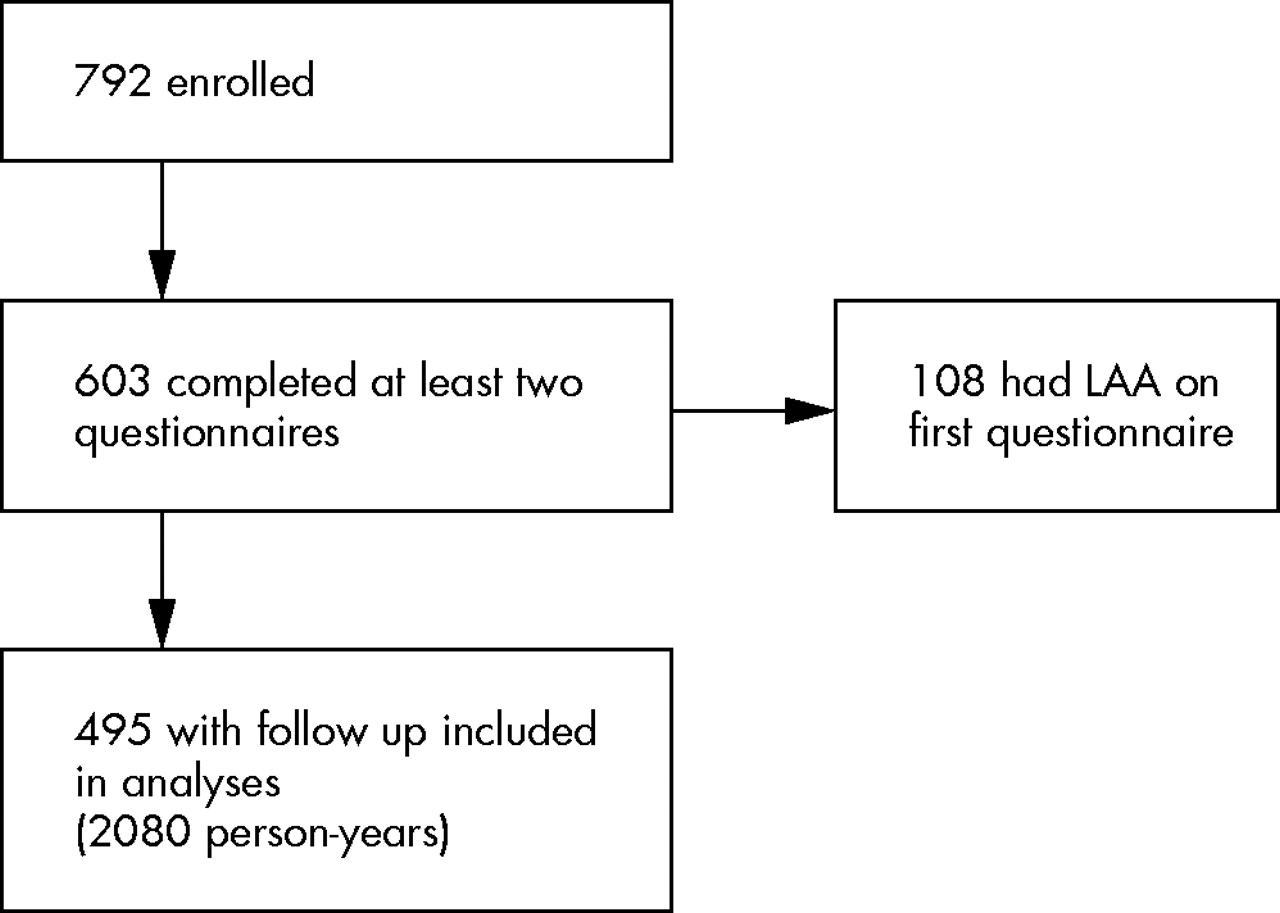
Participation of employees enrolled in laboratory animal allergy surveillance programme at GlaxoSmithKline Inc during 01/01/91 to 30/04/03.
Many workers intermittently failed to attend their annual clinic visits, resulting in intervals of greater than one year between questionnaires. Only 52% of the workers had complete data for their entire follow up period. The mean missing person-time was 1.15 years (SD 1.58), and the range was 0–8 years. Mean missing person-time was higher for non-cases (1.76 years (SD 1.66)) than for cases (1.04 years (SD 1.27)).
Distribution of workers, cases, and LAA incidence rates for time-invariant worker characteristics are shown in table 1. Workers contributed 2080 person-years to the study, but questionnaires covered only 1517 (73%) person-years. Over the 12 year period, 47 workers developed symptoms to laboratory animals, with an estimated incidence rate of 2.26 per 100 person-years. The highest incidence rates were for workers 18–28 years of age and for workers with 1–3 years of follow up. Of the workers who developed LAA symptoms, 87.8% developed symptoms of rhinitis, 18.3% developed symptoms of asthma, and 20.5% developed skin rash (data not shown).
Distribution of workers, cases, and incidence rates for selected characteristics
When the study population was restricted to workers with available serological data (n = 305), the incidence rate of LAA was 1.32 per 100 person-years. The incidence rate of LAA symptoms among the reduced group was 2.22 cases per 100 person-years, similar to that of the total population. The incidence rate was increased when analysis was restricted to workers without prior exposure to laboratory animals (IR 4.26, 95% CI 2.40 to 6.13). Incidence rate ratios were higher for workers with more than six hours per week exposure to laboratory animals or their cages (table 2).
Incidence rate ratios of LAA symptoms (with 95% confidence intervals) for workers (including non-atopic and atopic separately) with increasing hours per week of exposure to laboratory animals or their cages, from univariate Poisson regression
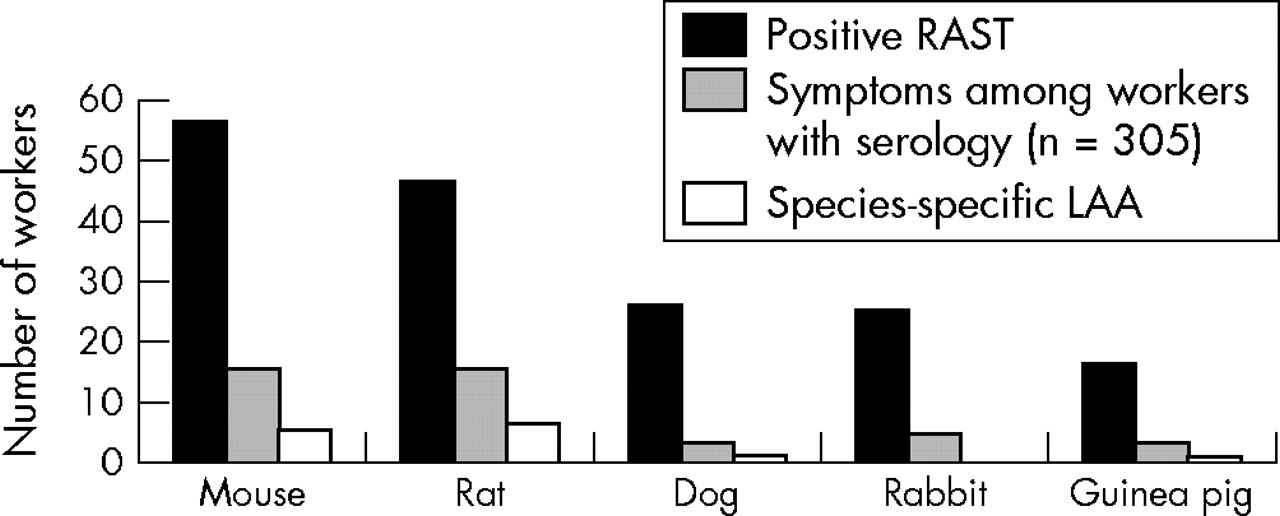
Species specific sensitisation (positive RAST) and LAA (positive RAST in addition to self-reported symptoms) were highest for mice and rats (fig 2). Sensitisation to rabbits and dogs was similar, although more workers reported symptoms to rabbits. None of the workers reporting symptoms to rabbits had positive RAST to rabbit urinary allergen. Data are not shown for hamsters, because no workers reported symptoms to them, and serological studies did not include hamster allergens. Species specific incidence rates, estimated using imputed person-years of exposure for missing data, suggest that rates are higher for allergy to rabbits than for other animals (fig 3).

Distribution of RAST results, species specific laboratory animal allergy (LAA) symptoms, and LAA among workers with serological studies (n = 305).
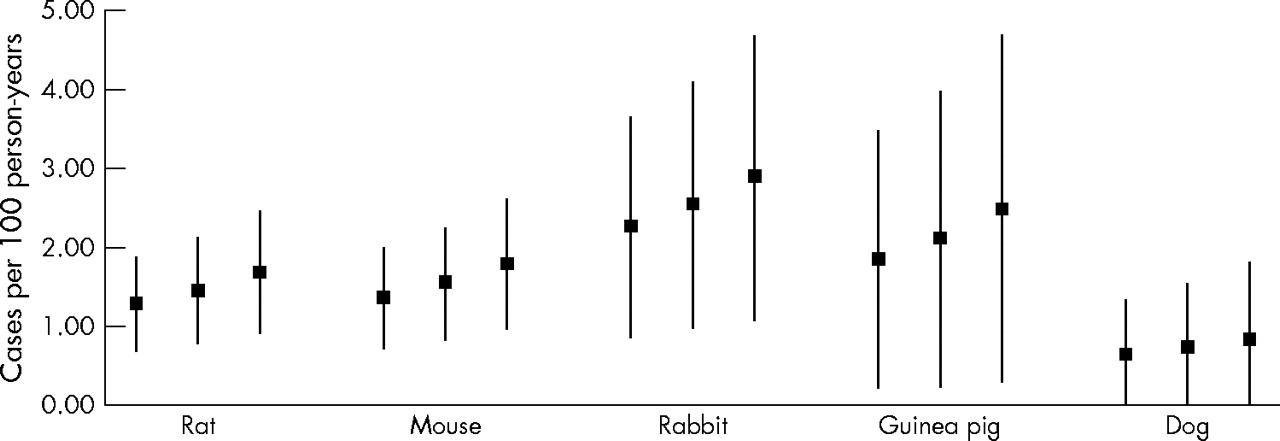
Estimated incidence rates (with 95% confidence intervals) of species specific allergy symptoms, using imputed values for person-years of exposure where questionnaires were missing. The ranges for species specific rates are derived from different imputations of missing data.
Sparse data prevented detailed evaluation of relations between exposure to specific animals and the incidence of species specific LAA and LAA symptoms. The estimated rate ratios generally increased with hours/week exposure to most animals, but the confidence intervals were wide (data not shown). Further analyses for species specific allergy were discontinued.
Rate ratios for LAA symptoms, comparing each job title with the rate for the combined population, are shown in table 3. Animal care workers had the highest rate (rate ratio 3.96, 95% CI 2.15 to 7.28), while scientists and lab technicians had the lowest rates (rate ratios 0.58, 95% CI 0.27 to 1.21, and 0.43, 95% CI 0.06 to 3.08, respectively).
Incidence rate ratios for job titles, comparing rate for each job title with population rate (2.26 cases per 100 person-years, 95% CI 1.61 to 2.90). As job titles are reported each year of follow up and may change over period of employment, rates for job titles are based on person-years from actual questionnaires, without imputations for missing data
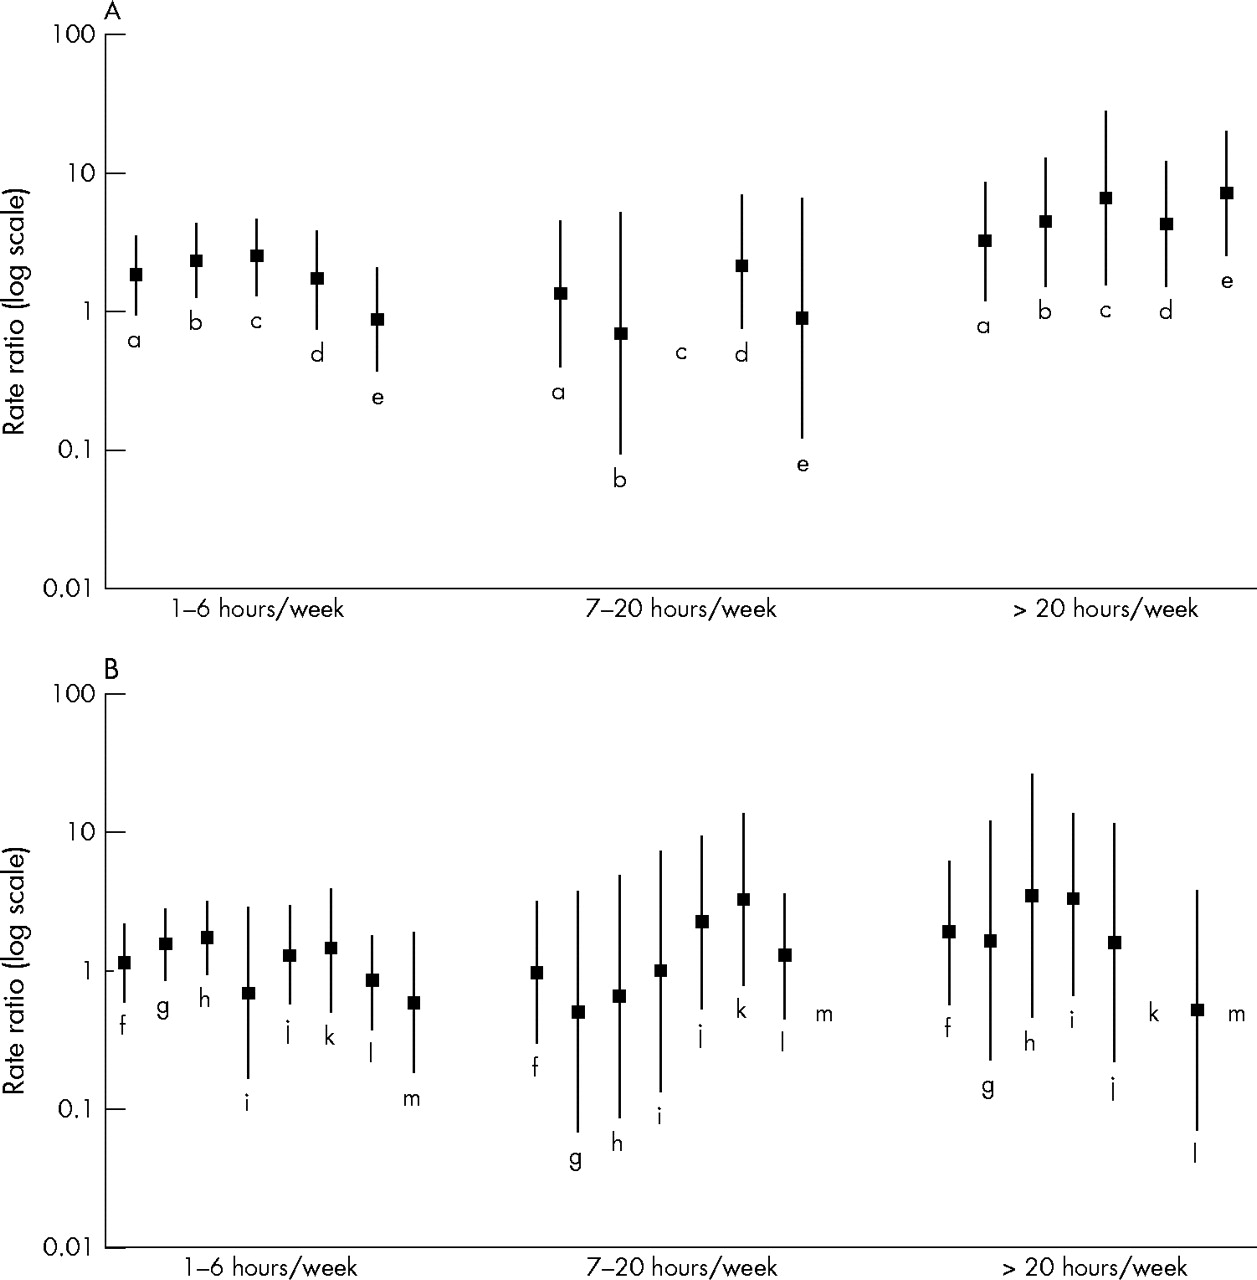
Rate ratios for tasks associated with work involving exposure to cages or many animals increased with hours of exposure (fig 4A). Rate ratios for tasks related to laboratory work, such as dosing, weighing, and experimentation, and jobs that did not require work with many animals at one time, were lower and generally did not increase with exposure (fig 4B). When pet ownership, smoking status, family history of allergy, age, and sex were evaluated in the models, the estimates did not substantially change.

(A) Incidence rate ratios (95% confidence intervals) from univariate Poisson regression for exposure to tasks associated with working with cages or many animals: a, handle dirty cages; b, return clean cages; c, receive animals (no estimate available for exposure at 7–20 hours/week); d, change bedding; e, work in holding room (referent = 0 hours/week). (B) Incidence rate ratios (95% confidence intervals) for exposure to tasks associated with working with few animals: f, gavage; g, weighing animals; h, sacrifice/necropsy; i, breeding room; j, housekeeping; k, isolators; l, using animals outside facility (no estimate available for exposure at >20 hours/week); m, isolated organ or tissue experiments (estimate available only for exposure at 1–6 hours/week) (referent = 0 hours/week).
DISCUSSION
We estimated incidence rates of LAA and LAA symptoms for different worker groups in a dynamic cohort of workers exposed to laboratory animals in a pharmaceutical company. The 12 year incidence rates of LAA and LAA symptoms for all workers were 1.32 (95% CI 0.76 to 1.87) and 2.26 (95% CI 1.61 to 2.91) per 100 person-years. Incidence rates were increased for workers aged 18–28 years and for workers with follow up of 1–3 years. Incidence rate ratios were elevated for workers with more than six hours per week exposure to laboratory animals or their cages, although there did not appear to be a dose-response relation.
Animal care specialists had the highest rates of LAA symptoms, compared with the entire population. Rate ratios increased with increasing hours per week of exposure to tasks that involved working with cages or many animals at the same time. Previous studies have shown higher concentrations of RUA associated with these tasks.17–19 We also found lower rate ratios for tasks associated with handling a few animals (for example, weighing, gavage or other dosing) or using tissues for experimentation, tasks for which measured RUA levels have been low in other studies.17–19 The results did not differ substantially when analyses were stratified by atopic status, defined as physician diagnosed allergy.
Analysis of species specific data suggested that rates of allergy symptoms were higher for exposure to rabbits than to other animals, perhaps a result of different types of exposure. For example, rabbits shed more fur and frequently spray their urine (personal communication, head of GSK animal facility). Workers reporting symptoms from exposure to rabbits did not have serological evidence of sensitisation to rabbit urine, but it is possible that they had symptoms to allergens not included in the RAST assays. It is also possible that these workers developed symptoms from exposure to other unmeasured/unidentified allergens or irritants, such as endotoxin, dust mites, and cleaning agents.
This is one of the first studies to describe relations between levels of exposure to laboratory animals and development of LAA and LAA symptoms. Other studies have been cross sectional in design or of shorter duration, and have generally focused on sensitisation to rat urinary aeroallergen.5,6 This dynamic population of laboratory animal workers has been followed systematically for a longer period than other reported populations, which has allowed calculation of more stable incidence rates for different worker groups.
The study was affected by missing person-time data arising from missed clinic appointments, resulting in questionnaire intervals of greater than one year for many workers. These gaps in the data prevented direct calculation of incidence rates for species specific allergy, as total person-time working with each type of animal was not known for some workers. Similarly, total person-years could be calculated for stable characteristics that did not vary over time, but not for characteristics that could change during the course of the study. For example, missing data prevented the calculation of cumulative exposure over the study period. We calculated rates for job titles even though they could change over an employment period, because it is likely that workers remain in similar job tracts (for example, scientific work, animal care work) throughout employment.
Some cases of LAA were reported after data gaps of two years, although the mean interval between questionnaires for all workers was approximately 1.1 years. If these workers developed LAA during the period of missing person-time, it is possible they self-selected to jobs with lower exposure, which would result in increased rate ratios at lower levels of exposure. Approximately 50% (n = 5) of the cases with data gaps reported lower exposures on the questionnaire in which they reported allergy symptoms, but only three cases reported decreases of greater than two hours per week.
If exposures were reported differentially by cases and non-cases, with cases reporting higher exposures, the resultant misclassification would yield rate ratios that exaggerated the effects of exposure. However, examination of exposure patterns for cases does not support the reporting of higher exposures at the time of reporting allergies.
A potential problem with using this population in an incidence study is that many of the workers had been employed at GSK for a period of time before inception of the study. Workers at high risk for LAA may have developed symptoms and dropped out of the workforce before the study began (healthy worker survivor effect). Under these conditions, the rates of allergy from our study would likely be underestimates of actual rates.
The comparison of observed incidence rates among jobs may have been affected by health related selection. A substantial proportion of the cohort (355 workers) had worked with laboratory animals before entry into the study and these workers had lower rates of incident LAA than workers without previous exposure. This pattern might be a result of job requirements and hiring practices: comparison of job titles at entry into the cohort revealed that positions requiring specialised training or experience—such as scientists—tended to be filled by individuals who had worked with laboratory animals before, whereas less skilled jobs—such as those related to animal care—were more often held by individuals who had not been exposed to animals previously. Increased LAA incidence among workers with no previous exposure could thus reflect assignment of inexperienced workers to less skilled jobs with greater exposures to allergens. However, it is also consistent with the possibility that exposed workers who develop symptoms early leave the industry, so that those who remain are a less sensitive subgroup with lower risk of subsequent symptoms. In this case, exposure related differences in LAA incidence between jobs would be attenuated. Although it is not possible to evaluate directly whether either of these processes is relevant, neither is likely to create the appearance of an exposure effect where none exists.
Many workers in this population came from previous jobs with exposure to laboratory animals, so it is unlikely that there was a truly unexposed group. People who work with laboratory animals tend to be in highly specialised and frequently mobile fields, such as science, veterinary medicine, and toxicology, or they have received intense training in the care of laboratory animals. If these workers change jobs, they may be likely to seek jobs in similar fields.
Non-occupational exposure to animals, particularly household pets, may confound the occupational exposure to animals because many animals used in the laboratory are the same animals kept as pets. Hollander et al3 found allergies to cats and dogs as an important risk factor for LAA. In this population, 64% of the animal workers had pets. We were not able to demonstrate an association between pet ownership and LAA incidence, but we did find higher rate ratios for workers with pet allergies.
This study suggests that a reduction in exposure to tasks involving work with cages or many animals at one time may result in decreased LAA incidence. Engineering and administrative controls have already been developed to mitigate exposure to animal allergens, but it may be necessary to focus continued efforts in this important area. Information from this study may be useful in implementing administrative controls that will regulate exposure for some workers. The information may also be useful in targeting specific areas for measuring animal allergens in the occupational environment, with the purpose of quantifying the exposure-response relations.
Main messages
-
Incidence of laboratory animal allergy (LAA) increases with increasing hours of week exposure to tasks associated with working with many animals or their cages.
-
Rates of allergy symptoms may be related to the type of animal to which a worker is exposed.
Policy implications
-
LAA prevention strategies should include reduction of hours per week of exposure to tasks related to working with many animals or their cages.
-
Environmental monitoring of animal facilities, with focus on tasks and specific animals, may help to elucidate exposure-response relations between animal allergens and the development of allergy.
Acknowledgments
We thank Drs David Savitz and Gregg Stave for constructive comments on earlier versions of this paper. This research was supported in part by training grant number T42/CCT422952 from the National Institute for Occupational Safety and Health, Centers for Disease Control and Prevention. Dr Peden was supported by grant number R01 HL62624, “Endotoxin and Bronchial Inflammation in Asthma”.
REFERENCES
Footnotes
-
The authors declare that they have no competing interests related to this research. Dr Elliott has worked as a consultant to the occupational health department of GlaxoSmithKline, Inc.