Article Text

Abstract
Background: Poisson regression is routinely used in occupational and environmental epidemiology. For typical Poisson regression analyses, person-time and events are tabulated by categorising predictor variables that were originally measured on a continuous scale. In order to estimate a dose-response trend, a researcher must decide how to categorise exposures and how to assign scores to exposure groups.
Aims: To investigate the impact on regression results of decisions about exposure categorisation and score assignment.
Methods: Cohort data were generated by Monte Carlo simulation methods. Exposure categories were defined by quintiles or deciles of the exposure distribution. Scores were assigned to exposure groups based on category midpoint and mean exposure levels. Estimated exposure-disease trends derived via Poisson regression were compared to the “true” association specified for the simulation.
Results: Under the assumption that exposures conform to a lognormal or exponential distribution, trend estimates tend to be negatively biased when scores are assigned based on category midpoints and positively biased when scores are assigned based on cell specific mean values. The degree of bias was greater when exposure categories were defined by quintiles of the exposure distribution than when categories were defined by deciles of the exposure distribution.
Conclusions: The routine practice of exposure categorisation and score assignment introduces exposure misclassification that may be differential with respect to disease status and, consequently, lead to biased exposure-disease trend estimates. When using the Poisson regression method to evaluate exposure-disease trends, such problems can be minimised (but not necessarily eliminated) by forming relatively refined exposure categories based on percentiles of the exposure distribution among cases, and by assigning scores to exposure categories that reflect person-time weighted mean exposure levels.
- epidemiologic methods
- measurement error
- regression analysis
Statistics from Altmetric.com
In occupational and environmental cohort studies, researchers are often interested in evaluating the relation between morbidity or mortality rates and independent predictor variables. Poisson regression is a commonly used method for such analyses,1–7 and advocated by some as the method of choice for analyses of cohort data.8
Poisson regression analyses are typically conducted using a tabulation of person-time and events in which all predictor variables are categorised.8–10 If a researcher wishes to obtain an estimate of the exposure-disease trend using a continuous measure of exposure, rather than using indicator terms for ordered polytomous exposure categories, then a score must be assigned to each exposure category.11 Exposure is then represented by a single variable in order to obtain an estimate of the relative risk per unit exposure.
It is recognised that Poisson regression results may be sensitive to decisions about the cut-points used to categorise continuous exposure variables and the method used to assign scores to exposure categories.12 However, the epidemiological literature provides little insight into the direction and magnitude of bias that may result from these decisions. In this paper we use simulation methods to evaluate the consequences of grouped data analysis under conditions plausibly encountered in occupational research.
METHODS
Overview
Statistical simulation is used to evaluate the direction and magnitude of bias in cumulative exposure-response trends under varying decisions about exposure categorisation and assignment of scores to exposure groups. We focus on the situation in which an exposure-response trend is evaluated by fitting a log-linear regression model that includes a continuous positive valued exposure variable. Simulated cohort data are generated under specified assumptions about the baseline risk of disease, distribution of cumulative exposure, and the true magnitude of the exposure effect, φ. Using these simulated data, an estimate of the exposure-disease association, φ̂, is obtained from the regression coefficient. Effect estimates were averaged over 100 iterations of the simulation process. The ratio of the estimate of the exposure-disease association, φ̂, to the true exposure effect specified for the simulation, φ, is denoted λ. Therefore, the referent value is unity; and, a value of 1.10, for example, indicates that the estimate of the association obtained via Poisson regression was 10% greater than the true exposure effect specified for the simulation. We use the term “positive bias” to refer to the situation in which λ takes a value greater than unity, and the term “negative bias” to refer the situation in which λ takes a value less than unity.
Simulation method
Hypothetical data are generated for 100 cohorts, each with 25 000 workers. Table 1 summarises assumptions common to these simulation analyses. At the start of follow up, each worker is assigned an age-at-entry into the cohort, and maximum lengths of follow up and employment. The distribution of age-at-entry and lengths of follow up and employment are similar to those observed in a study of nuclear industry workers.13 The median age at entry is 25 years, while the 90th centile for age-at-entry is 41 years. The median lengths of employment and follow up are 17 years and 35 years, respectively.
Conditions specified for simulation
Main message
-
Under conditions routinely encountered in occupational and environmental research, estimates of exposure-disease trends obtained via Poisson regression may be biased as a result of exposure categorisation and score assignment.
Each worker is assigned an exposure intensity level (that is, the level of exposure accrued in each year of employment) by random sampling. We evaluate three scenarios. Under the first scenario, exposure intensity conforms to a uniform distribution (that is, all subjects have an exposure intensity of 1 unit/year); cumulative exposure and duration of exposure are identical. This scenario may be plausible in occupational cohort studies where duration of employment is the only indicator of cumulative exposure that is available. Under the second scenario, exposure intensity conforms a lognormal (0,1) distribution; and under the third, exposure intensity conforms to an exponential distribution (with mean and variance of one). In these scenarios, most workers have exposure intensities that are close to 0 units/year, but a small percentage have much higher intensities. Lognormal models are typically applied to occupational exposure data,14 but the exponential and lognormal models are both compatible with occupational cohort studies of industries where the range of exposure intensities may be wide but most workers are exposed at low levels. Cumulative exposure is calculated applying the assigned exposure intensity to each year of an individual’s employment, a situation analogous to an occupational cohort in which workers hold a single job throughout their careers.
For each person-year of observation contributed by a subject, disease status is determined by calculating the value, h, under the model:

where δ0 and δ1 are parameters that define the age specific risk of disease in the absence of exposure, φ is a parameter for the cumulative exposure effect (we divided cumulative exposure by 10 so that φ is the exposure effect per 10 units exposure), and age and x are time dependent indicators of attained age and cumulative exposure, respectively. The value, h, is the hazard rate assigned to a specified unit of person-time (the chance of making a transition in disease status at each time period, conditional on survival to that point). Since we specify values for δ0, δ1, and φ and determine age and x for each person-year, we can calculate h, which is used to assign the subject’s disease status (0 or 1) in each year by sampling from the binomial distribution (1, h). Follow up of each subject may be censored as a result of death due to a cause other than the one under investigation. For each person-year, censoring status is determined under the model:

where η0 and η1 are parameters for a model that defines the age specific risk of mortality due to causes other than the one under investigation. For each individual, date of last observation is defined as the date of death due to the cause under investigation, date of censoring, or the end of follow up (whichever occurs first).
Poisson regression analyses
Person-time and events were cross-classified in a table with 20 categories of attained age (<25, 25–<30, 30–<35 … 85+) and 5, or 10, categories of cumulative exposure. Category cut-points were defined with reference to the following: quintiles of the cumulative exposure distribution in the study population; quintiles of the cumulative exposure distribution among cases; deciles of the cumulative exposure distribution in the study population; and deciles of the cumulative exposure distribution among cases.
In order to derive an estimate of a linear exposure-response trend, scores were assigned to exposure categories. We assigned scores to exposure categories based on: (1) the midpoint of each exposure category (with the score for the highest category based on the midpoint between the lower category boundary and the maximum observed exposure); (2) the person-time weighted mean value of exposures accrued in each exposure category; and (3) the person-time weighted mean value of exposures accrued in each cell of the person-time table defined by the cross-classification of categories of age at risk and cumulative exposure, referred to as the cell specific mean exposure. Poisson regression analyses of the association between disease status and each set of exposure scores were conducted via SAS PROC GENMOD.15
Proportional hazards regression analyses
Proportional hazards regression, conducted using SAS PROC PHREG, was used to derive estimates of the association between cumulative exposure and mortality using the ungrouped exposure data. Attained age was specified as the time scale used to obtain relative risk estimates. Cumulative exposure was treated as continuous variable and was the only explanatory variable included in the model.
RESULTS
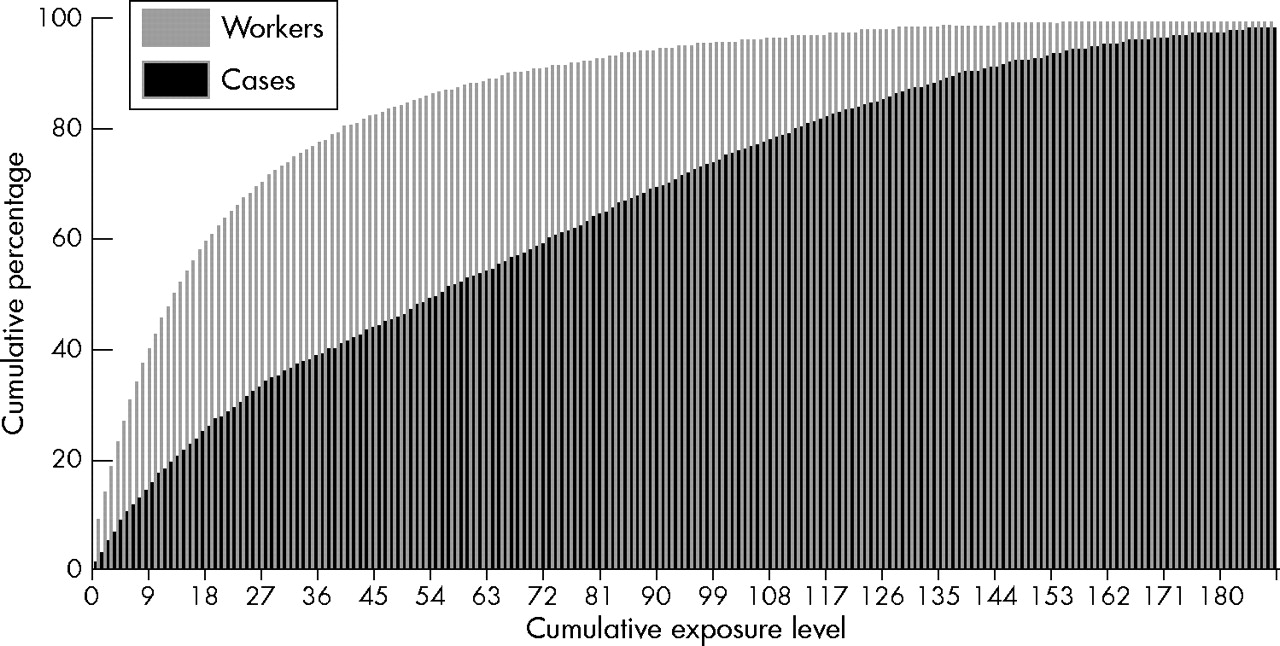
Figure 1 illustrates the population distribution of cumulative exposure for a simulated cohort under the assumption that exposure intensity conforms to a uniform distribution. Quintiles of the distribution are defined by the values: 5.0, 12.0, 20.5, and 31.0 units cumulative exposure.

Population distribution of cumulative exposure and cumulative exposure distribution among cases. Simulated data for 25 000 workers under the assumption that exposure intensity conforms to a uniform distribution.
First, estimates of association between cumulative exposure and disease were derived using the ungrouped exposure data via the proportional hazards regression method. The results obtained via Cox proportional hazards regression were consistent with the “true” value specified for the simulation (λ = 1.00). Next, Poisson regression estimates of the cumulative exposure-disease associations were derived. Cumulative exposure was categorised into 5 categories and 10 categories defined by quintiles and deciles of the cumulative exposure distribution (table 2). Negligible bias in results was observed when scores were assigned to exposure categories using midpoint or mean values.
Estimates of bias in cumulative exposure-disease trends derived via Poisson regression under four rules for exposure categorisation and three methods for exposure score assignment; simulation analyses under the assumption that exposure intensity conforms to a uniform distribution
Figure 1 also shows the distribution of cumulative exposure among cases. Poisson regression results were similar when categorising exposure into groups defined by the quintiles and deciles of the cumulative exposure distribution exposure among cases. When the midpoint for each exposure category was used to assign the exposure scores there was slight negative bias, while when exposure scores were assigned based on the category mean or cell specific mean values, no evidence of bias was observed (table 2).
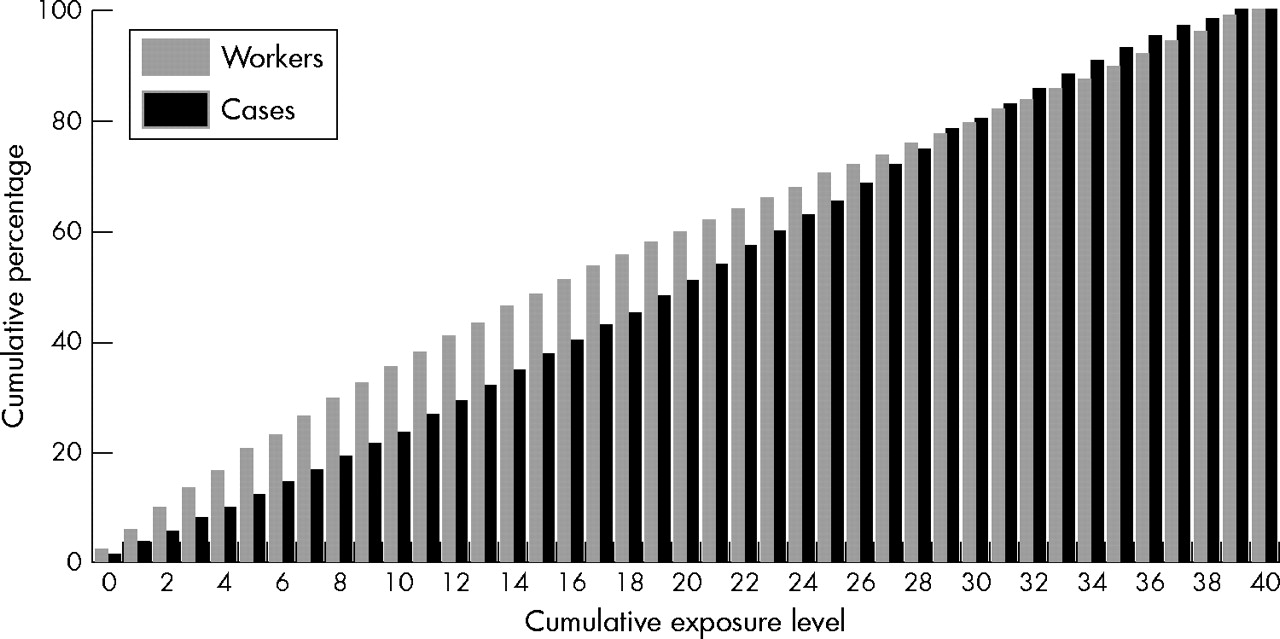
Figure 2 illustrates the population distribution of cumulative exposure under the assumption that exposure intensities conform to the lognormal distribution. For this distribution, too, the estimated association between cumulative exposure and disease, derived via proportional hazards regression using the ungrouped exposure data, was consistent with the value specified for the simulation (λ = 1.00).
Population distribution of cumulative exposure and cumulative exposure distribution among cases. Simulated data for 25 000 workers under the assumption that exposure intensity conforms to a lognormal (0,1) distribution.
Table 3 reports estimates of bias in Poisson regression estimates of cumulative exposure-disease associations. When the category midpoint was used to assign scores to exposure categories (column 2, table 3), trend estimates were negatively biased. When exposure categories were defined based on quintiles or deciles of the population distribution of exposure and scores were assigned to exposure categories based on the category mean or cell specific mean values, positive bias was observed (columns 3–4, table 3). There was negligible evidence of bias when exposure categories were defined by deciles of the exposure distribution among cases and exposure scores were assigned based on the category mean or cell specific mean values (table 3).
Estimates of bias in cumulative exposure-disease trends derived via Poisson regression under four rules for exposure categorisation and three methods for exposure score assignment; simulation analyses under the assumption that exposure intensity conforms to a lognormal (0,1) distribution
Finally, we examined the scenario in which exposure intensities conform to the exponential distribution. The population distribution of cumulative exposure was similar to that observed under the assumption that exposure intensities conform to the lognormal distribution. The estimated association between cumulative exposure and disease, derived via proportional hazards regression using the ungrouped exposure data, was consistent with the value specified for simulation (λ = 1.00). Table 4 reports bias in Poisson regression estimates of cumulative exposure-disease associations. When the category midpoint was used to assign exposure scores, trend estimates were negatively biased (column 2, table 4). When exposure scores were assigned based on the category mean or cell specific mean values, positive bias was observed (columns 3–4, table 4). The magnitude of bias was less when groups were defined by quintiles of the exposure distribution for cases than when groups were defined by quintiles of the exposure distribution for the total study population. When exposure categories were defined by deciles of the distribution of cumulative exposure among cases, the least evidence of bias was observed (table 4).
Estimates of bias in cumulative exposure-disease trends derived via Poisson regression under four rules for exposure categorisation and three methods for exposure score assignment; simulation analyses under the assumption that exposure intensity conforms to an exponential distribution
Similar patterns were observed under alternative assumptions about specified simulation conditions (see http://www.unc.edu/~davidr/poisson).
DISCUSSION
Bias in estimates of cumulative exposure-disease trends may be introduced as a result of categorising continuous exposure data for the purposes of Poisson regression analyses. The choice of method for assignment of scores to exposure categories influenced the direction and magnitude of bias. Assigning scores to exposure groups based on category midpoints can lead to negative bias (attenuation) in estimates of exposure-mortality trends. If exposure intensities are lognormally or exponentially distributed, assigning scores to exposure groups based on category mean values or cell specific mean values may lead to a slight positive bias (inflation) in results.
The explanation for these patterns of bias may be understood in terms of problems arising from exposure measurement error. In these analyses, exposure measurement error arises due to the difference between the score value assigned to an exposure category and the true individual exposure levels. The use of an assigned exposure score suggests a Berkson error structure, which reduces power but does not bias exposure-response coefficients.16,17 However, in the classic Berkson case, the exposure scores are the mean exposures of discrete populations, rather than common values assigned to categories formed arbitrarily by dividing a continuous exposure variable. It has been shown that in the latter case, when exposure categories are formed from a continuous variable, and exposure and disease are associated, the process of categorisation can convert measurement error that is non-differential with respect to disease status to differential exposure misclassification.18,19 The differential misclassification that results from this mechanism can produce positive or negative bias in exposure-response relations, depending on the investigator’s choice of exposure cut-points and the population distribution of exposure.20
In these simulation studies we show the related problem of bias arising in Poisson regression analyses where a surrogate value (that is, the assigned score for an exposure category) is used to represent the exposure of groups formed by categorising a continuous variable. If exposure and disease are associated, the process of exposure categorisation and score assignment can lead to measurement error patterns that differ by case status. Say that z denotes the assigned score for an exposure category, and that xp and xd denote the mean exposure level for the person-time and cases accrued in that category, respectively. Even if the assigned score to an exposure category, z, adequately represents the average exposure for the person-time accrued in that category, such that E(z−xp) = 0, this does not mean that the assigned score adequately represents the average exposure among cases (i.e., E(z−xd) is not necessarily equal to zero). This can be illustrated by reference to values derived from the hypothetical cohort data used to generate fig 2. If we categorise person-time and cases into groups defined by quintiles of the population distribution of exposure, the mean level of exposure for person-time accrued in the upper quintile of the exposure distribution, xp, is 80 units. If that value is used as the exposure score for this category, then the cases in this category will be assigned a surrogate value that tends to underestimate the average exposure level for cases (xd = 100 units). This occurs because exposure and disease are related and the distribution of cases with respect to exposure is consequently skewed towards the upper boundary of the exposure category (relative to the distribution of person-time in that category). Positive bias in trend estimates will tend to occur under this condition (table 3). In contrast, if the score assigned to person-time and cases accrued in the exposure group is based on the midpoint of the range of values observed for the exposure group (153 units), negative bias will tend to occur since the surrogate value will tend to overestimate the true exposure levels for both the cases and person-time accrued in the category. It may be noted that in the absence of a true association between exposure and disease, this type of bias will not occur (see http://www.unc.edu/~davidr/poisson).
One way to avoid these problems associated with exposure categorisation and score assignment is to conduct analyses using the Cox proportional hazards regression method. Proportional hazards regression does not require categorisation of predictor variables that were originally measured on a continuous scale. In some situations, however, there may be substantial computational obstacles to the use of the Cox regression method for analyses of data from large occupational or environmental cohorts.21 The computational resources needed for the Cox regression method tend to increase with the size of the study cohort, to increase with the number of events enumerated within that cohort (that is, computational demands will be greater for analyses of all cause mortality than for analyses of a specific cause of death), to increase for analyses that involve time dependent covariates, and to increase for analyses that involve an interaction between a time dependent covariate and the timescale defining the risk sets enumerated under the Cox model (for example, an interaction between a time dependent indicator of active employment status and attained age).
Furthermore, some investigators prefer to use the Poisson regression approach because it retains an intuitive connection to analyses of a basic epidemiological measure of interest (rate of disease or death) and encourages examination of the study data.8 This paper suggests, however, that when using the Poisson regression approach researchers should be aware of the potential for exposure misclassification that is differential with respect to disease status arising when score values are assigned to exposure categories formed from a continuous variable. Such problems are minimised (but not necessarily eliminated) by forming relatively refined exposure categories based on centiles of the exposure distribution among cases and assigning scores to exposure categories that reflect person-time weighted mean exposure levels.
Acknowledgments
This work was supported in part by CDC grant 1 RO3 OH07521-01.