Article Text

Abstract
Aims: To investigate the relation between colour vision loss and the exposure level of styrene. Exposure level included the current exposure concentration, past cumulative exposure, and the maximum exposure level in the past.
Methods: Colour vision was examined by the Lanthony desaturated panel D-15 test for 76 subjects exposed to styrene in a fibreglass reinforced plastics boat plant (as an exposed group) and 102 non-exposed subjects (as a control group). The current exposure level was expressed by the concentration of atmospheric styrene and end shift urinary mandelic acid (MA) and phenylglyoxylic acid (PGA) levels. The individual cumulative exposure index (CEI) was calculated, based on the exposure frequency and urinary MA concentrations measured for the past eight years.
Results: The Colour Confusion Index (CCI) of the exposed group showed a significant difference from the age matched controls. However, only a slight significant relation was found between CCI and the concentration of urinary MA plus PGA. In this study, the exposed group was further divided into two subgroups (as sub-MA+PGA groups) by the median of urinary MA plus PGA of each subject. The dividing line between the subgroups was 0.24 g/g creatinine, which was equivalent to an atmospheric concentration of styrene of about 10 ppm. The CCI values of both the sub-MA+PGA groups were significantly higher than that of the control group. The relation between CCI value and the maximum exposure concentration in the past eight years was examined. It was found that the CCI values of the group with the maximum exposure concentration of styrene over 50 ppm were significantly higher than that of the other groups.
Conclusions: Exposure to styrene would impair colour vision even if the exposure concentration was lower than 10 ppm. Furthermore, if the maximum concentration of styrene exposure transiently exceeded 50 ppm in the past, the styrene related damage might remain. Thus, the safe limit of exposure to styrene and the relation between exposure to styrene and the degree of damage to ocular structure, retina, optic nerve, and brain need to be re-examined.
- occupational exposure
- styrene
- colour vision
- CCI, colour confusion index
- CEI, cumulative exposure index
- MA, mandelic acid
- PGA, phenylglyoxylic acid
- TLV, threshold limit value
- TWA, time weighted average
Statistics from Altmetric.com
- CCI, colour confusion index
- CEI, cumulative exposure index
- MA, mandelic acid
- PGA, phenylglyoxylic acid
- TLV, threshold limit value
- TWA, time weighted average
Styrene is produced by catalytic dehydrogenation of ethyl benzene. It is extensively used in the manufacture of polystyrene plastics, protective coatings, styrenated polyesters, copolymer resins with acrylonitrile and butadiene, and as a chemical intermediate. In 1993, the total worldwide capacity of styrene production was 17.8 million tons.1 In Japan, the production was 2.94 million tons in 1995 (according to the Tokyo Metropolitan Research Laboratory of Public Health).
Styrene is highly soluble in fat and poorly soluble in water. It is a volatile liquid at normal temperature. It can bind to lipid rich tissues such as brain, myelin, and adipose tissue. In recent years, many researches have shown that styrene is a neurotoxic substance.2–4 It can affect neurone membrane structures. The alteration of membrane receptors may interfere with the propagation of nervous impulses. Neurotoxic effects of styrene exposure might come from its effect on neurotransmitters since some experimental investigations have shown a diminution of striatal and tuberoinfundibulary dopamine in rats5 and also in rabbits6,7 that were exposed to styrene by inhalation.
Many researchers have already examined the effect of styrene on visual function. It is considered that acquired dyschromatopsia is related to styrene exposure in the workplace.8–11 The damage to visual function could reflect neural alterations in the peripheral system. Such dyschromatopsia is probably a result of damage to ocular structures. It can be detected before patients are aware of functional disability.12,13
Some countries have reduced the limit for occupational exposure to styrene in recent years. For example, in Finland, the old limit was 100 ppm; it was changed to 50 ppm in 1981, then lowered again to 20 ppm in 1988. In the United States, the limit was changed from 50 ppm to 20 ppm in 1997.14 In Japan, the same change was made in 1999.15
Styrene related colour vision loss was reported in workers exposed to a time weighted average (TWA) of styrene, even for exposure levels under the current threshold limit value (TLV).8,10 The results obtained in an Italo-Canadian study suggested that significant impairment could be detected at the exposure level of only a few ppm.16
There is a debate about whether styrene related colour vision loss is reversible. Some researchers indicated that the damage might not be reversible over a period of more than a month’s vacation.8 However, another research group recently reported that complete recovery of styrene related colour vision impairment was observed after a vacation of four weeks.17 In addition, some researchers found that the same impairment was reversed over a period of two years in which the exposure concentration was reduced.12
There have only been a few studies in relation to the effects of cumulative occupational styrene exposure on visual function. One of the results was that near visual contrast sensitivity loss increased with long term cumulative exposure, but no significant relation was found between colour vision impairment and the cumulative exposure index.18 However the sample size was very small (only 18 persons) and a re-examination is needed to clarify the relation between colour vision and cumulative exposure.
Main messages
-
The aim of this study was to investigate the relation between colour vision loss and the exposure level of styrene.
-
The CCI of subgroups stratified by urinary metabolites was significantly higher than that of the control group, even when the exposure level was under 10 ppm.
-
A significant correlation was found between colour vision loss and the maximum exposure level in the past. However, a similar correlation was not found between colour vision and cumulative exposure.
In general, for humans, 2.6% of absorbed styrene is excreted in an unchanged state in the exhaled air or in the urine, 85% as urinary mandelic acid (MA) and 10% as urinary phenylglyoxylic acid (PGA).19 The sum of urinary MA and PGA is considered to be a biological indicator for styrene exposure. It can reflect the true exposure concentration of styrene.
This study was carried out in March 1998, and aimed to investigate the relation between colour vision and the level of exposure to styrene, including the current exposure concentration, past cumulative exposure, and the maximum level of styrene exposure in the past.
METHODS
Subjects
In this study, two test groups were examined: the exposed group, consisting of 76 male workers employed in a fibreglass reinforced plastic (FRP) boat plant in Japan, and the non-exposed group, consisting of 102 male subjects as controls. Subjects in the control group included 44 workers in the same plant and 39 employees who worked in another manufacturing plant as clerks, salesmen, drivers, etc. Nineteen volunteer medical students in a university were also included in the control group.
Before being examined, all participants were asked to complete a questionnaire in which the items concerned their work history and lifestyle habits, occupational and vocational organic solvent exposure, alcohol consumption, cigarette smoking, drug use, and anamnesis.
It is known that colour vision discrimination decreases with alcohol consumption, diabetes, and certain medications.20 These factors have to be considered in evaluating the relation between colour vision loss and organic solvent exposure. In this study subjects with any one of the following were excluded from statistical samples: congenital dyschromatopsia or other diseases of eyes, hypertension, diabetes, cerebrovascular disease, history of head injury, use of drugs interfering with colour vision, visual acuity lower than 0.6 (by Landolt ring test, distance = 5 m) in either eye (with lenses or contact lenses as usual), alcohol consumption exceeding 250 g/week, and an exposure period of less than six months. As a result, 19 subjects in the exposed group and 33 in the non-exposed group were excluded: eight had hypertension, five were diabetic, two had head injuries, one had cataracts, eight congenital dyschromatopsia, 26 excessive alcohol assumption, and one had been exposed for only one month. Therefore, the exposed group included 57 subjects and the non-exposed group 69 referents.
Test methods
Past exposure and cumulative exposure index (CEI)
Since 1991, periodic health checkups have been carried out for workers in the boat plant two or three times every year by an industrial physician. Their end shift urinary MA levels were measured. They were asked abstain from drinking alcohol on the day before the health checkup. The work histories of the subjects, including their past work period before and after they joined the plant, and information about the frequency and duration of exposure to other chemicals, were obtained from a standard self administered questionnaire.
Policy implications
-
The results of this study support the dose related effects of styrene on colour vision loss; colour vision is a sensitive indicator for exposure to styrene.
-
Results also suggest that the reversibility of damage to colour vision may depend on the maximum exposure concentration in the past rather than the cumulative exposure index.
In this study, the CEI was defined as the years that a subject has already been exposed to styrene. It was calculated by the exposure frequency and concentrations of urinary MA. However, the exposure frequency and concentrations of urinary MA were different for each subject. As a standard, the exposure years was recognised as the exposure concentration of atmospheric styrene at 20 ppm (TWA) for eight hours in a day, five days in a week. An atmospheric styrene concentration of 20 ppm was equivalent to a urinary MA content of 0.36 g/g creatinine.21 Therefore, the CEI could be calculated by the following equation: where:
MA, urinary mandelic acid
N, health checkup times
m1, months of exposure in a year
d, regular days of exposure in a month
h, regular hours of exposure in a day
m2, passed months from the last health checkup.
Current exposure
The present concentration of styrene exposure was evaluated by both the environmental concentration and biological monitoring on a Monday in the period of the study.
The environmental concentration of organic solvents was measured from individual air samples using an active charcoal personal passive dosimeter (3M, 3500). Data analysis was performed by gas chromatography at one of the institutions of the Japanese Industrial Safety and Health Association, and the TWA for the shift was calculated.
End shift urine samples were collected on the same day as personal environmental monitoring took place. Subjects were asked to abstain from drinking alcohol on the day before the test day. The urinary samples were immediately frozen at −70°C until analysis. Concentrations of urinary MA and PGA were measured using reverse phase high performance liquid chromatography (RP-HPLC). The measured results were corrected for urinary creatinine concentration. The concentration of urinary styrene was measured by head space gas chromatography (HS-GC) in the same laboratory.
Colour discrimination assessment
Colour vision was evaluated by the Lanthony 15 hue desaturated panel (D-15d), which is based on the ability of a subject to rearrange a set of 15 caps painted in desaturated colours in line with a definite chromatic sequence. It allows qualitative as well as quantitative evaluation of colour vision and is effective for both congenital and acquired colour vision impairment. It is specifically suited for early evaluation of mild to moderate acquired colour vision impairment, and can be employed not only in the laboratory under standardised conditions but also at the workplace if necessary.
The test was carried out under standardised conditions. All subjects were examined in the morning before being exposed, and a daylight fluorescent lamp provided 1200 lux on their workplace. The test was described to the examined subjects with exactly the same words. No other remarks were made during or at the end of test. No time limit was imposed for a test (most persons completed the test in 1–3 minutes for one eye). The same examiners conducted the test for both the exposed group and the non-exposed group. They had not been informed to which group the subject belonged. Both eyes of each subject were tested separately as acquired colour vision loss might be monocular or asymmetrical.
The test results were quantitatively evaluated by the colour confusion index (CCI).22 The index value was given as 1.0 when all the caps had been set in the correct order. It was augmented for each mistake in the sequence of the caps and the relevance of the mistake. The subjects who had a large number of mistakes had a high CCI index. A computer program automatically calculated results of the test for CCI.
Statistical methods
Most of the test data were processed by a Statistical Analysis System package (version 8) on an Ultra Enterprise 4000 mainframe computer.
The analytical results were expressed as the mean (SD) and/or median (range) of data. The Wilcoxon signed rank sum test was used to compare CCIs between the age matched subjects in the exposed group and the control group. The Mann–Whitney U test was used to compare the CCIs between the subgroups divided by the maximum value of exposure concentration in the past. The CCIs in subgroups, stratified by the urinary metabolites of styrene and their age matched control group, were compared by the Shirley–Williams test.23,24
The data of CCI could be considered to be expressed as an exponential distribution (fig 1). Therefore, a generalised linear model (GENMOD procedure) was used to examine the correlation between CCI values and their confounding variables.


Distribution graph of CCIs. Exposure (Cal.) and control (Cal.) are the approximation curves in exponential function. where β is a parameter.
RESULTS
Exposure
Figure 2 shows the variation of urinary MA levels in the past eight years in the boat plant. Styrene exposure reached the highest level in the period from 1991 to 1993, while urinary MA level was 0.74–1.04 g/g creatinine, which was equivalent to an atmospheric styrene concentration of about 40–60 ppm.21 From 1994 to 1996, exposure decreased to 0.48–0.57 g/g creatinine, equivalent to an atmospheric styrene concentration of around 30–36 ppm. In 1997, the urinary MA level dropped to the lowest level in the eight years. The mean value was 0.39 g/g creatinine, which meant that the exposure concentration was below 25 ppm.
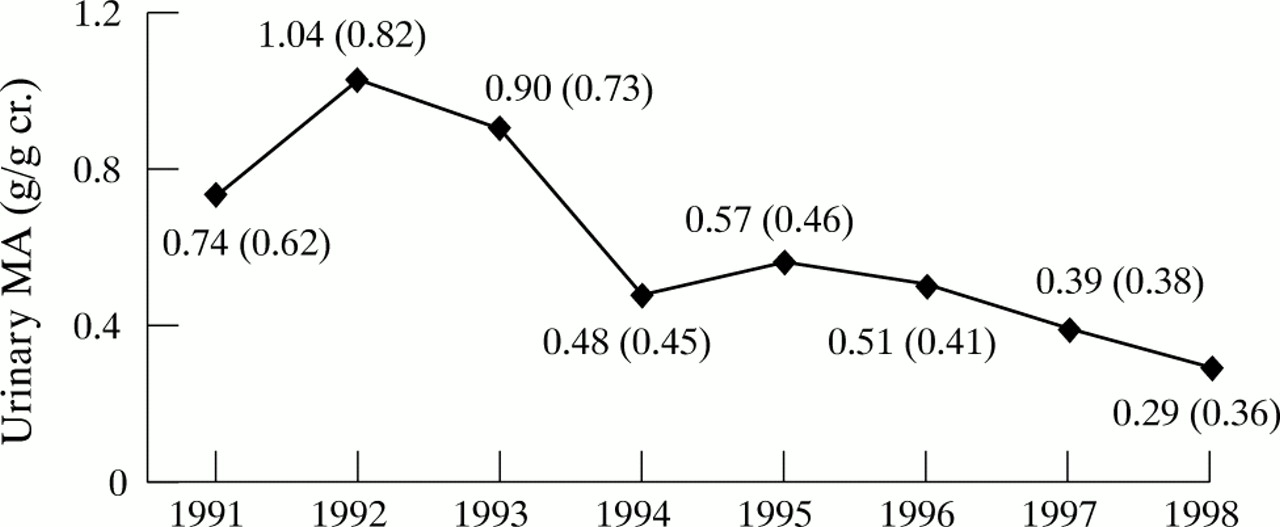
Changes of urinary MA concentration (arithmetic means and SD).
Table 1 lists the characteristics of exposure data of 57 subjects. Atmospheric styrene, acetone, 2-hexanone, orthoxylene, metaxylene, and paraxylene were detected. The mean value of the atmospheric styrene concentration was as high as 49.9 ppm. However, the concentration of acetone was 49.4 ppm. It was much lower than the threshold limit value of 500 ppm.14 Thus, the effect of acetone could be ignored. In the same way, because the concentrations of other organic solvents were under 0.1 ppm, a very low level, the effect of organic solvents was ignored as well.
Characteristics of exposure data of 57 subjects
Statistical analysis showed that the mean concentrations were 0.26 (0.35) g/g creatinine for urinary MA, 0.11 (0.11) g/g creatinine for PGA, and 138.6 (174.1) μg/l for urinary styrene, respectively. The styrene exposed period of these subjects averaged 76.6 (25.1) months. The average CEI was 6.43 (5.27) years.
As described above, the tested workers were exposed to a mean concentration of environmental styrene of 49.9 (35.9) ppm in the investigation period, which far exceeded 20 ppm, the current threshold limit value. However, the mean measured value of the workers’ urinary MA concentration was only 0.26 (0.35) g/g creatinine. By some reported conclusions,21 these data implied that the subjects were exposed to a mean level of styrene exposure 30% lower than the true atmospheric styrene concentration.
The same conclusion was also obtained by linear regression analysis of the end shift urinary MA concentrations of the exposure subjects and the atmospheric styrene levels, as shown in fig 3. The regression equation could be written as the following:
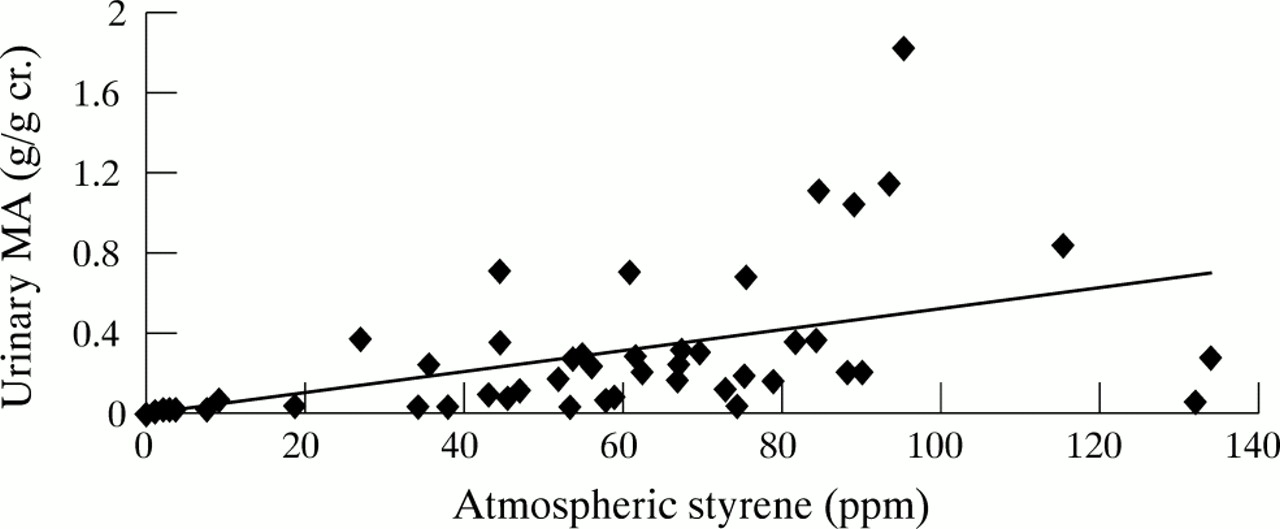
Correlation between urinary MA and atmospheric styrene.
Characteristics of subjects
The mean age of the subjects in the exposed group was 29.3 (4.5); their educational experience averaged 12.3 (0.7) years, they smoked 11.9 (8.5) cigarettes/day, and alcohol consumption was 89.9 (70.0) g/week. The control group’s mean age was 38.3 (11.2); their years of education were 14.0 (2.3), they smoked 8.0 (12.5) cigarettes/day, and alcohol consumption was 77.6 (69.6) g/week. Significant differences were found in age, education, and smoking amount between the two groups. Because the Lanthony D-15d test is sensitive to the change in colour discrimination with age,25 the two groups were matched by age within ±3 years. A total of 43 age matched subjects were picked as pairs (as shown in table 2). Other variables, involving education years and smoking amount, were adjusted in a generalised linear model.
Characteristics of exposed group and control group
Colour Confusion Index and its related variables
Figure 4 shows the CCI values of the two groups. Among the 43 age matched subjects, the CCI value of the exposed group was significantly higher than that of the control group (p < 0.01).

CCI values observed in age matched groups. **p < 0.01 (by Wilcoxon sign rank sum test). The values of CCI are the means of right and left eyes.
Slight significant correlation between CCI (only right eye) and urinary MA plus urinary PGA (p = 0.058) was found by the generalised linear model analysis. However, such a correlation was not observed between CCI and age, alcohol consumption, smoking amount, education, or the CEI (table 3), even though there were significant differences of education and smoking between subjects of the exposed group and control group.
Correlation between the CCI and its confounding variables
Dose relation and threshold effect
The exposed group was divided into two subgroups based on the urinary MA+PGA concentration to investigate the dose relation between the styrene exposure level and impairment of colour vision. Boundary values were 0.24 g/g creatinine of urinary MA+PGA. After stratification, these subjects were matched by age within ±3 years among the subgroups and the control group. Their CCI values were compared.
It was clear that the CCI value of the heavy sub-MA+PGA group (MA+PGA ≥ 0.24 g/g creatinine) was significantly higher than for the age matched controls (p < 0.01). The same interrelation could be found between the light sub-MA+PGA group (MA+PGA < 0.24 g/g creatinine) and the control group (p < 0.01) (see table 4).
Age matched comparison of subjects exposed to styrene and controls
In this study, a hypothesis was proposed that the styrene related damage to colour vision might remain for quite a long term period if the transiently exposure level exceeded a certain threshold. The hypothesis supposed that it was necessary to carefully evaluate the relation between the transiently maximum level of past styrene exposure and colour vision loss.
Another classification was also made in the processing of data. The exposed group was divided into two subgroups by the transiently maximum concentration of urinary MA 0.85 g/g creatinine in the past eight years. The high concentration subgroup consisted of those having the maximum concentration over 0.85 g/g creatinine. Figure 5 shows a scattergram of CCI and the maximum concentrations of urinary MA. The mean value of CCI for the high concentration subgroup was significantly higher than that of the low concentration subgroup, with the maximum concentration less than 0.85 g/g creatinine. The values of CCI were adjusted for age and alcohol consumption (1.00 (0.77–1.69) v 0.95 (0.83–1.15); p < 0.01, by Mann–Whitney U test).

Scattergram of CCI and the maximum concentration of urinary MA. Light group: MA<0.85 g/g cr., heavy group: MA=0.85 g/g cr. CCI is the mean of right and left eyes.
DISCUSSION
Based on the results of in this study, it appears that exposure to styrene can lead to impairment of colour vision. CCI values of the exposed subjects were significantly higher than those of the age matched controls (p < 0.01). This agreed with the results of many other researchers.4,8,9,11 However, the workers were exposed to a quite low level of styrene in the period of the study—about 15 ppm, calculated from their mean urinary MA of 0.26 g/g creatinine at the end of the shift. This exposure level was much lower than that in the studies by Fallas et al (24.3ppm),9 Gobba et al (16.2ppm),8 and Kishi et al (10–20 ppm).26
It was indicated that the deterioration of colour vision was dependent on the concentration of urinary MA plus PGA by generalised linear model. The same conclusion was found by Gobba et al8 and Equchi et al11 who reported that loss of colour vision was related to the concentrations of end shift urinary styrene or MA. However, in this study, the correlation of the CCI and the urinary metabolites of styrene were slightly significant and only on the right eyes of the subjects. This could be because the sample size was not large enough and the subjects were not exposed to a high styrene concentration in the period of this study.
In this study, the effect of styrene on colour vision was considered to have a dose relation. The group exposed to styrene was divided into two subgroups with the median of MA+PGA (sub-MA+PGA groups) as the boundary, which was 0.24 g/g creatinine, equivalent to an atmospheric styrene concentration of about 10 ppm.21 CCI values in both sub-MA+PGA groups were significantly higher than that in the control group. These results suggested that exposure to an atmospheric styrene concentration as low as 10 ppm could induce a dose dependent colour vision loss. This result provides a new proof for the theory that colour vision is a sensitive indicator of exposure to styrene.
The relation between the transiently maximum concentration in the past and the damage to colour vision was examined. Subjects were divided two groups based on the maximum concentration in the past of 0.85 g/g creatinine of urinary MA, which was considered equivalent to about 50 ppm of atmospheric styrene. Comparing the CCI values in the two groups showed that the CCI value in the heavy subgroup was significantly higher than that of the light subgroup. On the one hand, it was at least two years ago when the maximum styrene exposure level over 50 ppm was observed for all subjects in the heavy subgroup. Some researchers reported that it was possible that the colour vision improved with the reduction in styrene exposure over two years.12 The correlation between CCI and the period after the observation of maximum was examined in the subgroup. However, no significant correlation was found (data not shown). This result suggested that if the exposure level transiently exceeded 50 ppm in any period within the eight years, styrene related damage to colour vision might remain long into the future.
On the other hand, based on the generalised linear model, the CEI was not a significant factor for colour vision. A recent investigation also reached a similar conclusion. In that investigation, a follow up study was performed for 18 workers in an FRP plant; no significant relation between colour vision impairment and the CEI was observed.18 This might have been because the exposure situation had been improved by having the workers wear a special mask for a long term period in this boat plant. The organic vapour cartridges of their masks were changed more frequently in the previous half year. The actual exposure concentration was therefore decreased. According to equation (2), as the concentration of atmospheric styrene was 50 ppm, the value of urinary MA was equal to about 0.26 g/g creatinine. However, a urinary MA of 0.26 g/g creatinine ought to result from exposure to an atmospheric styrene concentration as low as 17ppm.21 It was verified that the chemical cartridge masks effectively reduced the amount of atmospheric styrene inhaled by workers.
As a result of this study, the cumulative exposure index was not an indicator of acquired dyschromatopsia. However, a dose relation between the CCI and maximum concentration of past exposure was found. It was caused by the subjects in this plant being exposed to a low concentration for a long time. Concentrations of urinary MA were under 35 ppm from five years earlier, and not more than 25 ppm in the past two years (see fig 2).
The investigation results confirmed that a reduction of styrene exposure could lessen styrene related colour vision loss. This conclusion was also supported by the research of Triegig et al. They observed a complete recovery of styrene related CCI impairment for workers in a smaller group (n = 22) after a vacation of four weeks. The exposure concentration before the vacation was about 20 ppm, which was calculated by urinary MA+PGA 0.47 g/g creatinine.17 Mergler et al reported that it was possible to detect improvement in colour vision related to a reduction in styrene exposure over two years.12 However, different results were presented by Gobba et al, who suggested that styrene related colour vision loss could not be recovered even 30 days after exposure to a concentration of about 30ppm, as calculated by the urinary MA concentration of 0.34 g/l.8 The same researcher reported in another paper that styrene related colour vision loss was not recoverable, even if the atmospheric concentration of styrene was reduced in a follow up investigation after one year.27
The investigation results also suggested that the reversibility of damage to colour vision might depend on the maximum exposure concentration in the past rather than the cumulative exposure index.
The neurochemical and structural bases of styrene neurotoxicity have not yet been understood completely. The pathogenesis of styrene induced colour vision impairment is still unclear. Further studies on the mechanisms of styrene related damage to colour vision, the safe limit of the occupational exposure concentration, and the relation between the degree of damage to the ocular structure, the retina, optic nerve, and the brain, as well as the maximum safe exposure to styrene need to be re-examined.
Acknowledgments
We are particularly indebted to the participants in the study, the plant management, and the occupational nurse and hygienist for their collaboration. The research was supported by grants from the Japan Ministry of Education and Culture and the Japan Industrial Safety and Health Association (JISHA).